
 ?Mathematical formulae have been encoded as MathML and are displayed in this HTML version using MathJax in order to improve their display. Uncheck the box to turn MathJax off. This feature requires Javascript. Click on a formula to zoom.
ABSTRACT
Sign language is an effective form of communication for speech impaired people. However, there is a challenge for people without impairment to communicate with speech impaired people because most are unaware of the language. There are several Machine Learning techniques that have been used in sign language translation. However, no study has been found in Tanzania Sign Language which is the sign language used by speech impaired people in Tanzania. This study seeks to compare the performance of SVM and CNN on translating sign language through the image recognition. The study employs Tanzanian Sign Language images as datasets. Principal Component Analysis was employed for feature extraction. Furthermore, the study used Combined 5x2cv F test to compare the two techniques. The findings indicate that CNN scored 96% in all of the parameters which are accuracy, recall, and precision while SVM scored similar rate in precision but lag behind on recall and accuracy. Additionally, the results show that there is significant difference in performance between the techniques. Therefore, the study recommends the use of CNN since it has high accuracy.
Introduction
Speech impaired people use sign language for communicative purposes. This is the language that is expressed by movement of body parts usually hands, whereby through this movement, the message is conveyed from one person to another. This type of communication has been used by speech impaired people to communicate among themselves and other people who have capability of giving out vocal sounds, hence they use vocal sounds to communicate. However, sign language is not known by most of people without speech impairment. This situation creates difficultness for people with speech impairment to communicate with those who use vocal sounds .
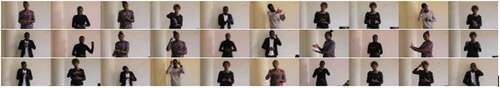
Figure 1. TSL images.
Basing on the factor that can be categorized as environmental, topographical, and social culture, language become different (Kula and Marten Citation2008). This is similar to sign languages that are used by speech impaired people around the world. The first sign language is believed to originate from France. To date, there are many officialized sign languages that are used in the world such as American Sign Language, Korean Sign Language, Chinese Sign Language, and Arabic Sign Language.
In Tanzania, Kiswahili and English are official languages. However, Kiswahili is the most-spoken language after local tribe languages. Kiswahili is a vocal sound-based language; hence, speech impaired people cannot use this form of language to communicate; instead, they use the sign language that is recognized by the Tanzania Association of Deaf People known as Chama cha Viziwi Tanzania (CHAVITA).
Tanzania Sign Language (TSL) is directly translated to Kiswahili language which is the most-spoken official language in the country. The language adopted some of the local signs that were used by speech impaired people around different areas of the country and some of the signs that are used in other languages. However, this language is not known by most of people who use Kiswahili to communicate.
In recent years, the capability of computer advanced technologies has increased to the extent of being able to do visual-based tasks. This capability creates a promise of making the communication between speech impaired people and others who use vocal sounds possible as sign language is a visual-based language. This study intends to investigate the techniques that can be used to perform the translation tasks.
There are several techniques that can enable the computer to perform visual-based tasks or recognize things among them and the most recently used is the use of Machine learning. These techniques use Artificial Intelligence Methods that enable machines to have a capability of automatically learn and enhance its knowledge based on experience without involving explicitly programming.
Image Recognition which is a visual-based task has been successfully implemented in recently years by the use of several Machine learning algorithms such as K-Nearest Neighbor, Decision tree, Artificial Neural Network, CNN and SVM (Rashid Agha, Al Muhammed, and Fattah Citation2018). However, in dealing with static gesture classification, SVM, ANN, and K-NN have been used in recent studies and the studies show that SVM has better performance compared to K-NN (Cheok, Omar, and Jaward Citation2017). On the other hand, ANN and CNN are all Neural Network-based architectures but they differ in connection of layers whereby in CNN, layers are not fully connected. The CNN are specifically applied for Computer Vision applications that involve Image Classification and Object Recognition (Gogul and Sathiesh Kumar Citation2017; Kim Citation2017, 121) and the use of Deep Neural Network is still a challenge due to the demand of large volume of datasets (Hasan et al.Citation2019).
There are several studies that have been conducted with the aim of using machine learning techniques to enhance the translation process of the sign language. The study conducted by Tharwat et al. (Citation2015) focused on two algorithms which are SVM and K-NN with SIFT as a feature extraction technique where the result show that the SVM classifier performed better in Arabic Sign Language. However, the study does not indicate the significance level of the difference in performance.
Similarly, Caliwag, Angsanto, and Lim (Citation2018) conducted a study which used AlexNet and ANN to translate Korean Sign Language. The findings show that the performance of ANN was better compared to AlexNet but AlextNet performed better on complex symbols despite requiring more datasets. However, the study does not state the significance level of the difference in performance.
Hasan, Helmi, and Habshi (Citation2019) compared SVM and Convolutional Neural Network (CNN) for recognition of hyperspectral images. The study used Hyperspec-VNIR Chikusei datasets and the results show that the performances of the models were competitive with other traditional and Deep Learning methods. Furthermore, the study shows that the best accuracy performance was by SVM-RBF model. However, despite dealing with different contexts, the study also did not test the significant level of difference in the performance.
Since sign language is a visual-based language, this study focuses on the two machine learning algorithms which are SVM and CNN that are used in image recognition, with the aim of determining the optimal algorithm than can be used to translate TSL. The two algorithms were chosen based on the success on previous similar studies and their performance in image recognition especially when dealing with static gestures.
Methodology
The study employed images that were taken from five different signers that were translating TSL. Camera was used to record short videos for each of the 30 words as depicted in from TSL dictionary. The videos were shoot from fixed camera position and the same background was used for all of the signers. From the recorded videos, the study extracted frames whereby for each word, 100 frames were extracted making the total datasets for the study being 3000 images. We used 100 image per class similar to study by Jin, Omar, and Jaward (Citation2016).
Table 1. TSL words used for the study
In order to achieve high accuracy, data pre-processing is a necessary step (Chen et al. Citation2020). Pre-processing is the use of computer-defined algorithms to enhance the image information by suppressing unnecessary distortions and improving important image information that can be used by machine learning model. In this step, several actions were done including resizing image, remove noise, segmentation, and morphology (smoothing edges).
Feature selection is a process of eliciting and picking the most-important characteristics of the dataset. This step is important in developing a machine learning algorithm. The value of feature selection comes as they play big role in increasing training speed, model interpretability, and generalization performance on the test sets. In Sign Language Translation, both manual and nonmanual features were used. Manual features include shape, orientation, and location. On the other hand, nonmanual features are generally centered at the face region, that include head movement, eye blinking, eyebrow movement, and mouth shape (Kamal et al. Citation2019).
For the case of features, the study used manual features and Principal Component Analysis (PCA) for feature extraction. This technique was employed as it was recommended by Fatmi, Rashad, and Integlia (Citation2019). These scholars argue that by using feature extraction, the technique can reduce dimensionality and hence training time can be reduced, and in turn, more efficient model can be achieved.
After feature extraction, the study used the collected and pre-processed datasets to train the classification algorithm. The training was done on two targeted models whereby one is based on CNN and another on SVM.
Model Evaluation
There are several reasons of evaluating a machine learning model among them being to be able to generalize the performance of the model, enhancing the predictive performance by tweaking the learning algorithm and suggest best algorithm for the particular problem (Raschka Citation2018). Raschka (bid) argues that a model can be evaluated based on their performance, model selection and model comparison. Mohammad and Nasir (Citation2015) highlighted metrics for performance estimation which include Accuracy, Error Rate, Sensitivity, Specificity, Precision, Recall, F-Measure, Geometric-mean, Averaged Accuracy, Averaged Error Rate, Averaged Precision, Averaged Recall, Averaged F-Measure, Mean Square Error, Area Under the Curve, and Optimized Precision which can be used to estimate performance of the model; however, F-Measure, Geometric-mean are good measures for binary classification problem. However, according to author, for good performance generalization, a learning model h needs to minimize the probability, C(h), of making a wrong prediction:
D is the generating distribution the dataset has been drawn from; x is the feature vector of a training example with class label y
Accuracy ACC which is the total number of correct predictions to the number of samples is given by:
Where ERR is prediction error
where is the true class label of item
and
the predicted class label of item
By using confusion matrix accuracy calculated as ratio of correct predictions divide by total number of samples evaluated (Mohammad and Nasir Citation2015).
- true positive for class
is true positive for class
is false positive for class
false negative for class
true negative for class
is the nth class
Also, this study deals with classification of more than two classes. Therefore, classification precision (p) and recall (r) are also used to evaluate the models employed in the study. These metrics were also depicted on the study by (Sokolova and Lapalme Citation2009).
Precision is the measure of positive patterns that are correctly predicted from the total predicted patterns in a positive class.
Recall metric is used to measure the fraction of positive patterns that are correctly classified by the model.
Machine Learning Model Comparison
There are several tests that can be used to compare machine learning models/algorithms which include McNemar test, Cochran’s Q + McNemar for model comparison and Multiple independent training sets and test sets, Combined 5x2cv F test and Nested cross-validation for algorithm comparison (2018). Based on the datasets used for this study. Combined 5x2cv F test was employed for algorithm comparison.
The 5x2cv combined F test was used to test the significance of the performance of the model. In this test, the datasets were divided in two samples (50% training and 50% test data). The model was executed in five iterations where in each iteration two operation were performed. The first operation was to train the models with the train sample and test with the test sample, and second operation was to train the models with the test sample and test with the train sample.
In all of the operation, the accuracy is identified where ACCA is the accuracy of the SVM and ACCB is the CNN accuracy. In each execution of the iteration, Accuracy deference ACCd is identified such that;
Then, the mean and the variance of the differences are estimated,
Which means that S2 is given by
Therefore, F-statistic is calculated by the formula
which is approximately F distributed with 10 and 5 degrees of freedom.
This test was used to test the hypothesis H0
H0: There is no difference in performance between SVM and CNN when used for TSL translation using image recognition.
Findings and Discussion
The SVM Model
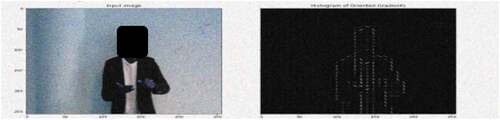
In the process of creating HOG features, the HOG library from scikit-image was used. In this library, all the processes of creating the HOG features were performed abstractly, which means that there is no need to calculate the gradients, magnitude (total gradient), and orientation individually. The hog function would internally calculate it and return the feature matrix. As a result, HOG features matrix (34596,) was returned. presents the output of the whole process.
Figure 2. The input image and HOG image.
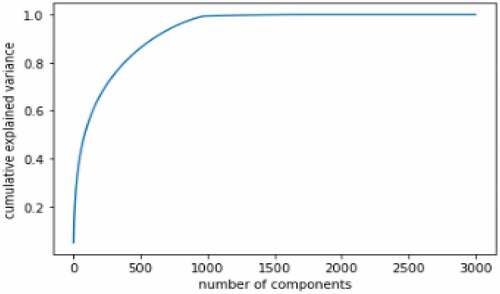
The curve in shows the extent of each of the 3000-dimensional variance as contained within a variable number of components of the HOG features. It was observed that from 1000 number of components, more than 90% of the variances could be retained. Therefore, it was concluded that 1000 components would be enough for effectively representing all of the information in the datasets for effectively classification of the sign language.
Figure 3. The cumulative explained variance of the HOG features.
The classification report for the SVM classifier with the HOG features show that the algorithm has the average precision (p) of 96% and recall (r) of 95%. This shows that the algorithm is reliable since apart from having higher accuracy, it has high rate in both making accurate prediction from total predicted patterns in a positive class (p) and that of positive patterns that are correctly classified (r). However, low rate was observed on p of the word komputer ‘computer’ while the lowest r was observed in the word mwanafunzi ‘student.’ Moreover, the word with the lowest p showed high rate in r while the lowest r has a p of 91%. The overall accuracy of the model is 95.1%. displays the classification report that was produced by the SVM model when the HOG features were used.
Figure 4. The SVM classifier classification report.
indicates the confusion matrix of the classification done by the model. According to the findings, there are some words which are wrongly predicted by the model. The confusion matrix indicates that the word Mwalimu ‘teacher’ appears to be more frequently predicted as ‘computer’ which appeared in 8 cases, mwanafunzi ‘student’ as ‘science’ which counted seven scenarios and mwanafunzi ‘student’ as computer in two cases.
Figure 5. The SVM classifier confusion matrix.
The CNN Model
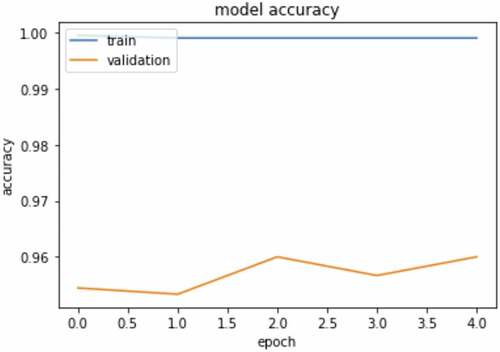
The CNN model was developed using 3000 datasets of TSL datasets. The datasets were divided into two categories which are training datasets and validation datasets at the ratio of 0.3 for validation datasets. Therefore, with 3000 datasets, 2100 datasets were used for training, and 900 for validation. The model consists of three convolution layers with an input of 256 × 256. describes the layers of the CNN model. In addition, the is a graph that describes the training process of the model. Early stopping was used to control the model from overfitting. The training process stopped at epoch 5. The graph shows the relation between the training and validation loss. depict the relation between the training accuracy and validation accuracy.
Figure 6. The CNN convolution layer.
Figure 7. Training and validation loss.
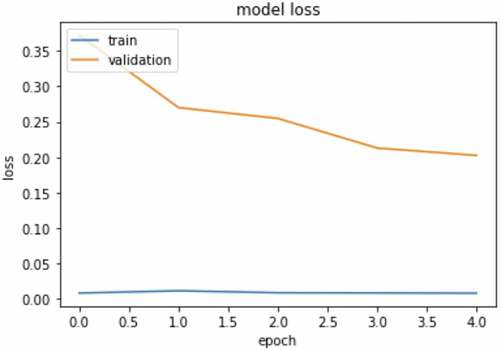
Figure 8. Training and validation accuracy.
The classification report for the CNN classifier show that the algorithm has the average precision of 96% and recall of 97%. This show that the algorithm is reliable since it has high rate in both making accurate predictions from the total predicted patterns in a positive class (p) and that of positive patterns that are correctly classified (r). However, it has been observed that the word daftari ‘exercise book’ has the lowest precision (p) compared to others. It scored 87% of precision. Otherwise, most of words have scored precision of more than 90%. Also, it has been observed that the recall column has the smallest score which is 74% which is the score for the word idara ‘department.’ Despite having the lowest score in r, the word idara has the maximum score in precision which is similar to the lowest score of p. indicates the classification report of the CNN classifier. The overall accuracy of the model is 96%.
Figure 9. The CNN classification report.
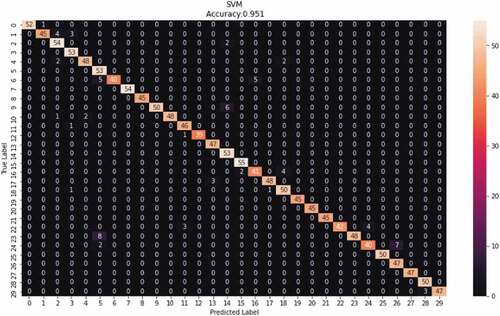
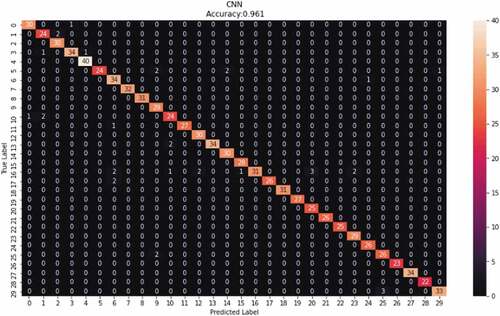
indicates the confusion matrix of the classification done by the CNN model. The model confusion matrix shows a clear diagonal of the correctly predicted words. This also correlates to the overall performance of the model as most of words were clearly mapped to the correct labels. However, there is still a significant number of wrongly predicted words especially for the word idara ‘department.’ The word is wrongly predicted as fafanua ‘explain,’ feli ‘fail,’ historia ‘history,’ kitabu ‘book’ and mwalimu ‘teacher.’
Figure 10. The CNN confusion matrix.
The Comparison Using Combined 5x2cv F Test
The results of the comparison using Combined 5x2cv F test are presented in . The finding shows that the F is equal to 6.518658030882532 which yields a p value of 0.0258. Since the chosen significance level is α = 0.05, the null hypothesis is rejected. This means that there is a significant difference in the performance of the two models. Therefore, based on the accuracy on comparison results, the CNN has better performance significantly compared to the SVM. This means that there can significantly increase in performance when translating sign language by using the CNN as machine learning technique when translating TSL words compared to the use of the SVM.
Table 2. Combined 5x2cv results
Conclusion
The study has used TSL datasets to compare the performance of the SVM and the CNN machine learning techniques in translating TSL words spelling. The finding shows that both models have acceptable rate of accuracy, recall, and precision. However, the accuracy of the CNN model has 1% higher on accuracy and recall than the SVM model. Both models have the same rate in precision. In determining the significance of performance using Combined 5x2cv F test, the results show that a null hypothesis is rejected, which means that there is significant difference in performance of the algorithms when are used to translate TSL. Therefore, the study concludes that the CNN model has significant better performance in translating TSL compared to when the SVM model is used.
Acknowledgments
The authors would like to thank the management of Mzumbe University for the financial support to conduct this study.
Disclosure statement
No potential conflict of interest was reported by the author(s).
References
- Caliwag, A., S. R. Angsanto, and W. Lim. 2018. Korean sign language translation using machine learning 2018 Tenth International Conference on Ubiquitous and Future Networks (ICUFN) (IEEE). 826–466 doi:10.1109/ICUFN.2018.8436747.
- Chen, K.-C., C.-L. Chin, N.-C. Chung, and C.-L. Hsu. 2020. Combining multi-classifier with CNN in detection and classification of breast calcification. Future Trends in Biomedical and Health Informatics and Cybersecurity in Medical Devices Taipei, Taiwan 74 , 304–11. Springer, Chamdoi: 10.1007/978-3-030-30636-6_42.
- Cheok, M. J., Z. Omar, and M. H. Jaward. 2017. A review of hand gesture and sign language recognition techniques. International Journal of Machine Learning and Cybernetics 10 (1):131–53. doi:10.1007/s13042-017-0705-5.
- Fatmi, R., S. Rashad, and R. Integlia. 2019. Comparing ANN, SVM, and HMM based machine learning methods for American sign language recognition using wearable motion sensors. 2019 IEEE 9th Annual Computing and Communication Workshop and Conference, CCWC 2019 7-9 Jan. 2019 (IEEE) Las Vegas, NV, USA, 290–97. doi:10.1109/CCWC.2019.8666491.
- Gogul, I., and V. Sathiesh Kumar. 2017. Flower species recognition system using convolution neural networks and transfer learning. 2017 4th International Conference on Signal Processing, Communication and Networking, ICSCN 2017 16-18 March 2017 (IEEE) Chennai, India, 1–6. doi:10.1109/ICSCN.2017.8085675.
- Hasan, H., Z. M. S. Helmi, and M. Habshi. 2019. A comparison between Support Vector Machine (SVM) and Convolutional Neural Network (CNN) models for hyperspectral image classification. IOP Conference Series: Earth and Environmental Science 357 (November):012035. doi:10.1088/1755-1315/357/1/012035.
- Hasan, M., S. Ullah, M. J. Khan, and K. Khurshid. 2019. Comparative analysis of SVM, ANN and CNN for classifying vegetation species using hyperspectral thermal infrared data. International Archives of the Photogrammetry, Remote Sensing and Spatial Information Sciences - ISPRS Archives 42 (2/W13):1861–68. doi:10.5194/isprs-archives-XLII-2-W13-1861-2019.
- Jin, C. M., Z. Omar, and M. H. Jaward. 2016. A mobile application of American sign language translation via image processing algorithms. 2016 IEEE Region 10 Symposium (TENSYMP) 2016 (IEEE) Bali, Indonesia, 104–09. doi:10.1109/TENCONSpring.2016.7519386.
- Kamal, S. M., Y. Chen, L. Shaozi, X. Shi, and J. Zheng. 2019. Technical approaches to Chinese sign language processing: A review. IEEE Access 7:96926–35. doi:10.1109/ACCESS.2019.2929174.
- Kim, P. 2017. MATLAB deep learning. Berkeley, CA: Apress. doi:10.1007/978-1-4842-2845-6.
- Kula, N. C., and L. Marten. 2008. Central, East, and Southern African languages. In One thousand languages, ed. P. Austin, 86–111. Oxford: The Ivy Press.
- Mohammad, H., and S. M. Nasir. 2015. A review on evaluation metrics for data classification evaluations. International Journal of Data Mining & Knowledge Management Process 5 (2):01–11. doi:10.5121/ijdkp.2015.5201.
- Raschka, S. 2018. Model evaluation, model selection, and algorithm selection in machine learning. http://arxiv.org/abs/1811.12808.
- Rashid Agha, R. A., N. S. Al Muhammed, and P. Fattah. 2018. A comprehensive study on sign languages recognition systems using (SVM, KNN, CNN and ANN). ACM International Conference Proceeding Series. doi:10.1145/3279996.3280024.
- Sokolova, M., and G. Lapalme. 2009. A systematic analysis of performance measures for classification tasks. Information Processing & Management 45 (4):427–37. doi:10.1016/j.ipm.2009.03.002.
- Tharwat, A., T. Gaber, H. M. Aboul Ella, K. Shahin, and B. Refaat. 2015. SIFT-based Arabic sign language recognition system. Advances in Intelligent Systems and Computing 334:359–70. doi:10.1007/978-3-319-13572-4_30.