
ABSTRACT
In recent years, social networks have become very popular and an integral part of everyday life. People express their feelings and experiences in this virtual environment and become aware of others’ opinions and interests. Among them, influential users play an important role in disseminating information on social networks. Identifying such influencers is important in designing techniques to increase the speed of information dissemination. Such techniques are applicable in various fields including viral marketing, preventing the dissemination of harmful information, providing specialized recommendations, etc. Various approaches have been used to detect influencers on social networks, mostly based on the individual’s position in the network structure and their interactions. Considering the strengths and weaknesses of the previous methods, this study presents a novel method based on the content of the users’ posts without considering the network structure. This is done using a combination of high-level features extracted from images to measure the individual’s influence. Users’ images are investigated from three aspects: (1) color scheme, (2) advertising nature, (3) images’ semantics. To describe each of these aspects, feature extraction methods were used with acceptable accuracy in recognizing influential users. Finally, to achieve greater efficiency and precision, feature-combination methods have been investigated to provide an integrated classifier.
Introduction
Over the past 15 years, online social networks have been one of the essential communication tools with high socio-economic value.
The term influencer refers to people with the ability to persuade others to do something. By definition, an influencer is a reliable person who tries to persuade others and presents their supported topics and ideas (Rosenthal Citation2014). Such individuals play an important role in disseminating information on social networks. What they say may affect brand recommendations, advertisements, and evaluation (Neves et al. Citation2015). The importance of social media has turned finding the influencers in the virtual communities into a challenging field of study, in which big data are accompanied by complex interpersonal interactions (Riquelme and González-Cantergiani Citation2016).
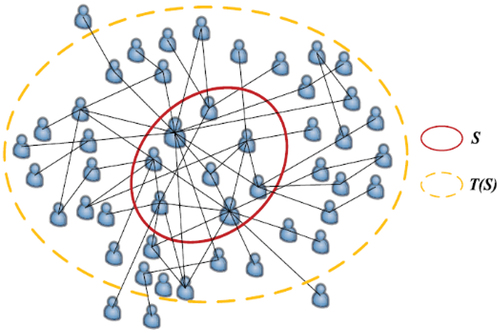
Marketing is the main application of identifying influencers, which is the main reason to conduct this study in the first place. The influencers having the ability to influence their followers, accelerate or hinder message dissemination throughout the network. The following scenario is an example to clarify the problem. A company manufactures a new product and wants to market it through the micro-blogging networks such as Twitter, Instagram, etc. It initially identifies and selects a limited number of users and provides free samples to them. This activity encourages these people to influence their friends and friends of their friends as a sign of appreciation if they are satisfied with the product. Therefore, a large population of network users following this influencer may be convinced to use the product. Now, the question is how to identify and select the initial subjects so that they would influence the most diverse number of individuals. This phenomenon is called “influence maximization.” illustrates the process of viral marketing. The set S includes the primary selected users by the company. T(S) denotes the influenced users by the set S. The purpose is to minimize the set S and maximize the set T(S) as much as possible (Jianqiang, Xiaolin, and Feng Citation2017).
Figure 1. Influence maximization.
Social networks are a combination of nodes and connections, in which each node indicates a user, and connections represent different relationships between users (Räbiger and Spiliopoulou Citation2015). The corresponding graph may change based on the network and modeling the problem. Most of the proposed influencer detection methods use the topological structure of the network and user interactions to identify the influencers. Some methods analyze the textual content of posts. These influencer detection methods suffer from some drawbacks as follows:
Most of these methods entail information about the topological structure of the network even though collecting information about the entire network is a challenging and sometimes an impossible task for real-world networks such as Twitter and Facebook due to the significant changes in time and space (Liu et al. Citation2016). An extensive neighborhood analysis is also inefficient in such networks. The increasing number of online social network users and a significant number of their audiences increase the computational complexity. This is because the order of most methods is directly associated with the number of network users.
Although some popular social networks, like Instagram, are solely based on image sharing, none of the conducted studies so far has addressed the visual content of the posts.
Given the strengths and weaknesses of the methods that have been proposed so far, this study aims to provide an approach to identify the influencers by combining the high-level features extracted from images, regardless of the network structure information and only based on the content of a user’s posts. On the other hand, as a popular image-sharing social network, Instagram is a good platform for advanced research based on user-visual content.
The rest of this paper is structured as follows. The following section provides an overview of the methods that have been proposed in this field so far. Then we describe the proposed method and define how to evaluate it and the next section presents the results of the performed tests. The final two sections will conclude, summarize and provide recommendations for future studies.
Related Works
The existing influencer identification methods are divided into three general categories:
(1) Network structure-based methods: these methods address the user position in a graph to determine his level of influence. Accordingly, a node’s influence is determined according to the network topology. Such algorithms represent social networks as graphs that are sometimes changed depending on the type of algorithm. These methods, which are mainly known as centrality indices, are divided into local, global, and semi-local categories. In the local methods, the influencing node is identified according to the node itself and its neighbors. The “degree centrality index” is one of the most popular local criteria, in which a higher score is achieved by increasing the neighbors of a node. Due to ignoring the structural location of the node in the network, the local methods have low computational complexity with low accuracy. In the global methods, all network nodes participate in calculating the influence of a node. Some global methods include betweenness, closeness, and K-shell centrality indices. One of the weaknesses of these indices is that as the network becomes larger, their computational complexity increases; therefore, they are practically unusable in large networks. The third group is focused on solving the inaccuracy of local methods and the time-consuming nature of the global methods. In these algorithms, a node, its neighbors, and neighbors of its neighbors are considered to detect the influence of a node. The neighborhood centrality index (Liu et al. Citation2016) is one of these methods. There are also more complex algorithms, which combine two or more basic criteria and enjoy their advantages (Bae and Kim Citation2014; Chen et al. Citation2012; Gao et al. Citation2014; Ling Ling et al. Citation2016; Lü et al. Citation2011, Citation2016; Qian and Jun Citation2017; Qian et al. Citation2014; Yu Hsiang, Yuan Huang, and Tsai Sun Citation2015; Zeng and Jun Zhang Citation2013).
(2) User interaction-based methods believe that the position of the node in the network alone does not provide enough information about one’s influence and the interaction of a node with its neighbors also effects a user’s influence. A large number of studies on the level of influence are based on the interactive behaviors of users such as retweeting, mentioning, and commenting. Meanwhile, retweeting has been more popular among interactive behaviors. (Cha et al. Citation2010) examined the performance of input degree retweeting, mentioning, and commenting indices in detecting the influencers. The results indicate that the number of followers or the input degree shows the popularity of a person and it has nothing to do with the other two indices. The results of this study also show that the number of followers provides insignificant information about the user’s influence because a large number of followers may not read his shared content. More complex methods combine interactive behaviors with other features such as network structure. (Kwak et al. Citation2010) uses the input degree (number of followers), PageRank, and retweeting to detect one’s level of influence. Meanwhile, some methods have addressed different behaviors such as the number of clicks on short URLs (Xiao et al. Citation2013).
(3) Content-based methods evaluate the content of shared posts in order to evaluate a user. So far, only the topological structure of the network and the interactions between users have been considered in the proposed methods and the features of the user-generated content that empower his dissemination are ignored. Previous studies in the field of influencer detection neglect the effect of user-generated content or combine it with other methods. For example, (Räbiger and Spiliopoulou Citation2015) has considered the average Flesh- Kincaid Grade Level (FKGL) score on all tweets of an individual along with centrality, community, and interaction features to measure the readability of the content generated by the Twitter user. This index describes how many years of education are required for an individual to understand the given text. Some of the proposed methods emphasize influencer detection in a specific field, which are referred to as topic-sensitive methods. A marketing environment (for example, business owners, investors, and advertising agencies), the purpose of which is to find the influencers in a particular field, is more inclined to use such methods. For example, a well-known biologist’s idea about elections is not as influential as that of a politician (Bigonha et al. Citation2012). The TwitterRank algorithm (Weng et al. Citation2010) is one of these methods, which is based on the PageRank algorithm except that in the TwitterRank, the random walk is topic-sensitive. Another topic-sensitive approach is presented in (Beiming and Vincent Citation2013). Their research applies the Tanimoto coefficient to calculate the similarity between the two texts.
So far, no method has addressed the content of users’ posts and predicted one’s level of influence based on the extracted features from them. However, there are such methods to predict emotions (Rui, Cui, and Zhu Citation2017), events (M Alqhtani, Luo, and Regan Citation2015), personality (Skowron et al. Citation2016), geographical location (Han, Cook, and Baldwin Citation2014), and so on. A post contains different sections such as the text and images, the analysis of which provides some information about detecting a certain attribute about the sharing person.
Various methods have been adopted for feature extraction from a post. (Skowron et al. Citation2016) analyzes the text and image of the posts to predict the personality traits of individuals. It applies natural language processing tools such as LIWC, ANEW and Dialog Acts, and Sentiment classifiers to extract language features and considers features such as brightness, saturation, hue, and pleasure-arousal-dominance and content-based features such as the face of individuals or their whole body to describe images. (M Alqhtani, Luo, and Regan Citation2015) uses the bag-of-words features extracted from the text by the TF-IDF method to describe the text and HOG, GLCM, and color histogram descriptors for image-based feature extraction. Similar to (M Alqhtani, Luo, and Regan Citation2015), (Rui, Cui, and Zhu Citation2017) applies the TF-IDF and color emotions features to describe the text and images of the posts, respectively.
Data and Methods
Evaluation Platform
Since no dataset is available for influencer detection on Instagram, one of the first objectives of this study was to provide appropriate datasets in this field. Accordingly, this study employed a set of Instagram users at www.influence.iconosquare.com who are known as influential users in various fields. Since the influencers rarely follow each other, the followers of these users with acceptable activity who had less than 200 connections (followers and following) were selected as the non-influential users. Then, the required data for each user was loaded by Instagram APIs. Each user’s information includes biography, number of followers, followings, and posts including media ID, caption, hashtag, and images.
General Dataset
In this study, the general dataset includes185, 141 images belonging to 3,787 users, which are collected from the Instagram network. The dataset is divided into influential and non-influential users. The influential group includes 1,187 users and 148,832 images and the non-influential group includes 2,600 users and 36,344 images (). The number of posts varies and ranges from 1 to 8,678. and represent some images of the influential and non-influential people in this dataset.
Figure 2. General dataset of influencers.
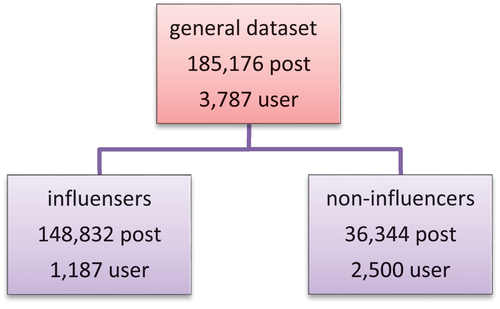
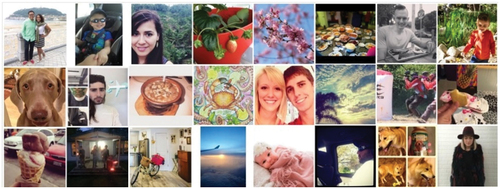
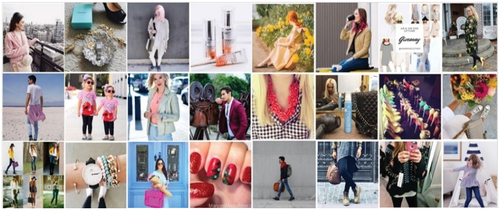
Figure 3. Some of images related to influencers in general dataset.

Figure 4. Some of images related to non-influencers in general dataset.
Topic-based Dataset
Since the influencers in different fields have different personality traits, this study is based on the distinction between the non-influential and influential users in a particular field. This research addressed the influential users in the field of “fashion.” Accordingly, the users in the dataset who work in the field of “fashion” should be specified. To this end, a hashtag-based topic extraction method was used, which is discussed here. The corresponding steps are as follows:
Extracting the included hashtags in the posts of all influential users of the dataset
Estimating the co-occurrence vector for the hashtag “fashion”: In this step, for each hashtag in the dataset, the number of posts containing that hashtag and hashtag “fashion” simultaneously is calculated.
Finding representing hashtags of the topic: it refers to choosing the hashtags that have the most co-occurrence with the hashtag “fashion” in the entire dataset ()
Finding all posts that:
Have at least one of the representing hashtags
Have at least one hashtag that one part of it contains one of the representing hashtags e.g. “instafashion”
Finding active users in the field: It refers to finding users whose number of posts related to the subject is more than a certain threshold. Here, the threshold value of 20 is considered for the number of posts related to users’ topics
Table 1. Co-occurrence vector for hashtag ”fashion”. Hashtags selected as topic representing hashtags are marked in green. Hashtags which include “fashion” do not selected as representing hashtags because they are covered in step 4.a
In the end, the topic-based dataset, which is obtained by the topic extraction method proposed in this section, contains 64,216 images belonging to 3,271 users.
The images in this dataset belong to the influencers in the field of “fashion.” The influential group includes 671 users and 27,872 images and the non-influential group includes 2,600 users and 36,344 images. The number of posts of different users varies ranging from one to 3,905 posts.
o achieve more reliability, the users with less than 20 posts were excluded; then 20 posts of the remaining users were selected randomly and allocated to each user (). presents examples of influential users’ images from the dataset.
Figure 5. Topic-based dataset.
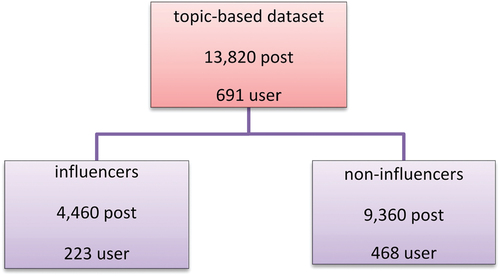
Figure 6. Some of images related to influencers in topic-based dataset.
The Proposed Method
The proposed method in this study determines the influence of a user by the combination of high-level features extracted from images, without network structure information, and only based on the content of posts. This method examines the users’ images based on three aspects: (1) color scheme, (2) advertising nature, and (3) the semantic aspect of the images. The corresponding feature extraction methods, which have an acceptable accuracy in distinguishing between influential and non-influential uses, are applied to describe each aspect. To achieve higher efficiency and accuracy, various feature combination methods are addressed so that an integrated classifier is obtained to identify the influential users on social networks.
Evaluating the Advertising Nature of the Images
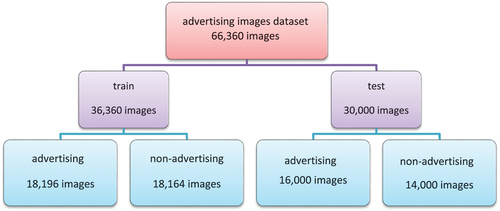
The advertising nature of the posts is one of the addressed features. To this aim, a classifier is trained to distinguish between advertising and non-advertising images and assign advertising score to them. Accordingly, the advertising image dataset (Hussain et al. Citation2017) is applied. This dataset contains 64,832 advertising ,000 of which are used as the positive classes to train the classifier. Moreover, as the non-influential people send fewer advertising posts compared to the influential people, the images shared by non-influential users are considered as the negative or non-advertising class. It is noted that the non-advertising images used in this dataset do not overlap with the influential users’ dataset. presents the details of the dataset used in this section.
Figure 7. Advertising images dataset.
The feature extraction steps are as follows:
Fine-tuning the GoogleNet network by the advertising images’ dataset- In this step, the GoogleNet network, which is pre-trained on ImageNet, is fine-tuned to distinguish between the advertising and non-advertising images.
Extracting features from the advertising image dataset with GoogleNet- The output of the “pool5/7*7_s1” layer, which gives 1024-dimention feature vector, is used for feature extraction.
Training the SVM classifier to distinguish between advertising and non-advertising images- Here, an SVM classifier with RBF kernel is trained using the features extracted in the previous step to distinguish between the advertising and non-advertising images. The accuracy of this classifier on the test dataset is 95%.
Extracting features from the influential user dataset with GoogleNet- Similar to step 2, in this step, the output of the “pool5/7*7_s1” layer of the GoogleNet is used for feature extraction.
Detecting the advertising degree of the influential users’ image dataset using the classifier in step 2- In this step, the outputs of the classifier in step (3) is obtained for each image and their scores are specified. The higher score of an image indicates that the image is more advertising.
Image Evaluation in Terms of Semantics
The adjective-noun pairs are used to examine the images from the semantic point of view (Borth et al. Citation2013). These features cover a set of concepts such as “beautiful flower” or “disgusting food,” etc., and they are described by a 1200-dimensional vector that each dimension represents one of the adjective-noun pairs. By adding an adjective to a simple noun like “dog,” the adjective-noun pairs convert it into a strong semantic concept like “funny dog.” Detecting such a combination in images is easier than a simple adjective such as “beautiful” because adjectives are usually abstract concepts, which makes them difficult to detect in images. The SentiBank library was used to extract the ANP features.
Evaluating the Color Scheme of Images
The Color-Naming descriptor is used to determine the color scheme. In machine vision, color naming is a process in which an RGB value is matched with a linguistic color label. This study applied the matching method proposed in (van de Weijer et al. Citation2009), which is achieved automatically based on the images obtained from the Google image search service (). In this method, each RGB value is matched with an 11-dimensional probability vector the sum of which is 1 and each dimension represents the probability of one of the linguistic color labels.
Figure 8. 11 basic colors learned from google images.
Results
Evaluation Criteria
In this study, the accuracy of classification is measured based on the equal error rate (EER). Any two-class SVM classifier has a threshold that the output of the classifier is compared with it; and according to this compression, the input data is associated with one of the two available classes. In most classifiers, this threshold is set to zero by default, which means that if the score of a data is higher than zero, it is assigned to the positive class; and if it is less than zero, it is assigned to the negative class.
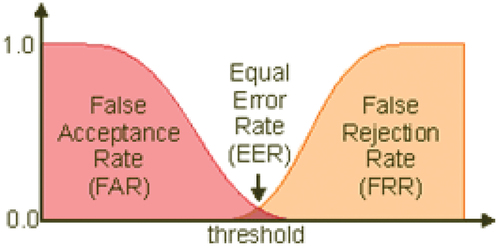
In most cases, choosing the zero-threshold leads to a significant difference between the classes in terms of classification accuracy i.e. the classifier tends toward a particular class. In this study, this issue becomes more apparent due to the unbalanced nature of the data. That is because in a social network, the number of influencers is much less than common people, which affects the dataset. The reason is that if the number of samples in one class is significantly different from the number of samples in another class (e.g. the samples in a negative class is three times greater than the positive class), the classifier achieves an overall accuracy of 75% by assigning a negative label to all data. In such cases, the accuracy of the classifier for the negative class is 100% and 0% for the positive class, which is certainly undesirable. The EER criterion is used to address this problem. According to the definition, EER is the error rate corresponding to the threshold, which leads to the identical false positive rate (FPR) and false-negative rate (FNR) of error ().
Figure 9. Equal error rate chart.
Moreover, the tests were repeated several times to increase the reliability of the results; then the final accuracy was achieved by calculating the average accuracy obtained in different execution. The reason of repeating the tests is the existence of the steps in which random selection occurs. These steps include (1) post-selection step in which 20 posts are randomly selected for each user as discussed in Section 4-1-2 and (2) dividing data for training and testing sets, where the dataset users are randomly selected for training and testing.
Identifying the Influential Posts
The first question that arises after feature extraction from the dataset is how to use these features to detect the influence of the shared posts. In this section, methods to score and label the posts are discussed.
Semantic and Color Features at the Post Level
To detect the influence of the posts based on the semantic and color features introduced previously, the dataset is divided into train and test sets. The results are presented in . The steps of the algorithm are as follows:
Extracting the feature vectors from the images of training dataset
Training a SVM classifier to assign an influence score to the images
Extracting color descriptors from the images of test dataset
Assigning scores to each of the images of test dataset
Determining the label of each images of test dataset using the EER criterion
Table 2. Results of evaluating features in post level
Advertising Features at the Post Level
In terms of the advertising features, it is assumed that the advertising level of posts is directly related to their influence. This means that more advertising posts will be more influential. Therefore, according to previous Section on how to extract advertising features from images, the advertising image dataset is applied to train a classifier, which determines the advertising level. The score that this classifier assigns to the posts is also used to detect the posts’ influence. Consequently, the threshold is set according to the EER criterion and if the advertising score exceeds it, the post will be considered as influential; otherwise, it will be non-influential ().
Identifying the Influential Users
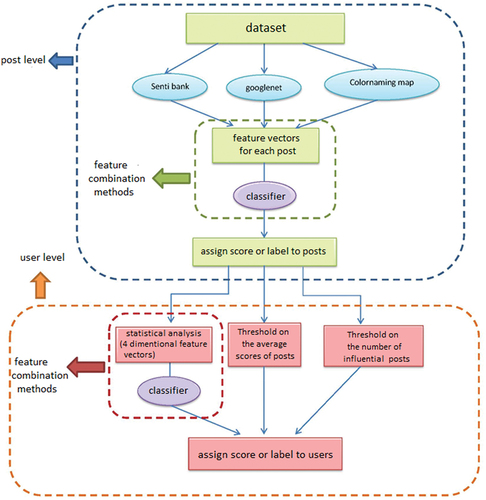
As shown in to , influential user detection occurs in two steps. The first step is the post level, in which the posts are assessed in terms of their influence and each one gains a score based on the level of influence. The second step is the user level in which the influential users are specified according to the influence of their posts. The important issue is how to calculate a user’s influence based on the influence level of their posts. Accordingly, three methods are examined, which are discussed in detail as follows.
Figure 10. The steps of proposed algorithm for identifying influential users.
Threshold-based Methods
In these simple methods, each user’s label is specified by comparing a numerical value with a predetermined threshold. The numerical value for each user is calculated based on the scores or labels assigned to his posts in the first step of the algorithm. In these methods, the dataset is divided into the train and test datasets (). The training set is applied in the first stage of the algorithm, i.e. training a classifier to assign an influence score to the posts and the test set is used to evaluate the first stage classifier at both post and user levels.
Threshold on the number of influential posts
In this method, if the number of influential posts of someone exceeds a threshold, that person is considered as influential. For that reason, first, the label on each user’s post is determined, based on their scores using the EER criterion and then, the number of influential posts of each person is determined.
Threshold on the average scores of posts
In this method, if the average score of a person’s posts exceeds a threshold, that person is considered as influential.
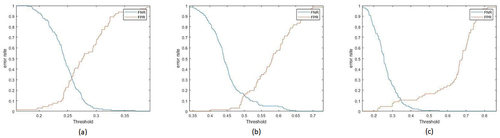
presents the results of threshold-based methods. Accordingly, the accuracy of each feature is calculated for different thresholds, and the threshold with the same error rate in the positive and negative classes is implemented as the final threshold. illustrate the ROC curve of the threshold-based methods for one execution of the algorithm. and indicate the positive and negative error rates for different thresholds in the threshold-based methods. The intersection point of the two curves represents the final threshold and accuracy.
Table 3. Results of evaluating features in user level
Figure 11. The positive and negative error rates for different thresholds in Threshold on the number of influential posts method for (a) color-naming features (b) ANPs (c) advertising features.
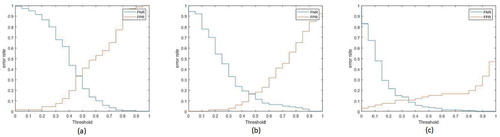
Figure 12. ROC curve of the threshold-based methods for one execution of the algorithm.(a) Threshold on the number of influential posts. (b) Threshold on the average scores of posts.

Figure 13. How to divide the dataset in threshold-based methods.
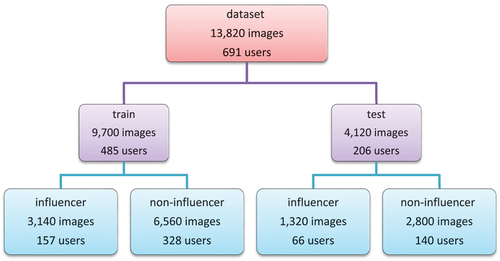
Figure 14. The positive and negative error rates for different thresholds in Threshold on the average scores of posts method for (a) color-naming features (b) ANPs (c) advertising features.
Statistical Analysis
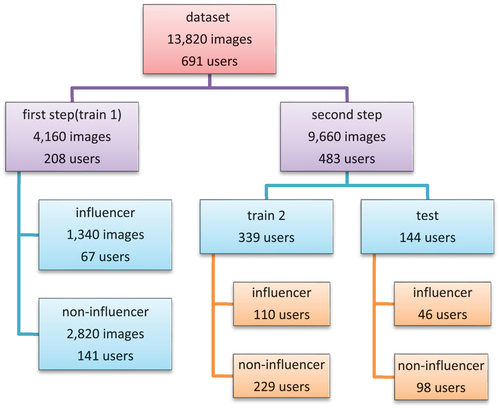
In this method, a 4-dimensional feature vector of the statistics related to the posts is calculated for each user. The statistical information vector includes the minimum, maximum, mean, and variance of scores of each person. In the next step, these feature vectors are used to train a classifier so that it could classify the users into the influential and non-influential classes. Therefore, according to the dataset is divided into train 1, train 2, and test parts. The train 1 set is used for the first stage of the algorithm i.e. training a classifier to assign the influence score to the posts and the train 2 set is used to train a classifier using the statistical information vectors. Finally, the second classifier (user level) is applied to the test set and the results are evaluated. The results of the statistical analysis method are presented in
Figure 15. How to divide the dataset in statistical analysis method.
Combining Features Extracted from Images
So far, this study has addressed detecting a post or user’s influence based on the scores assigned to them by classifiers, which are trained using different feature vectors. However, another choice to be made is how to combine the extracted features from the images, which is discussed in this section. The feature combination method is applicable in any part of an algorithm in which a classifier is trained on a feature vector. In the proposed method () the feature combination methods could be applied in two ways. In the first case, the feature combination is conducted at the post level and on the initial feature vectors extracted from the images, and in the second case, it is done at the user level on the statistical information vectors associated with various features.
Finally, after choosing on which part of the proposed method the feature combination should be conducted, one of the feature combination methods must be selected. Generally, it is possible to classify using a combination of some features at decision and feature levels. The following sections discuss different types of feature combination methods provided in .
Figure 16. Feature combination methods.
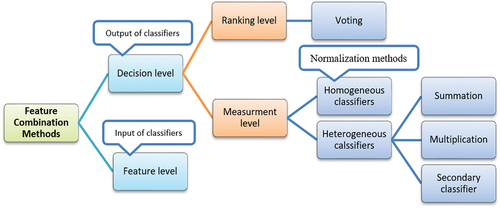
Feature Level
In this case, for each input data, a general feature vector is obtained by putting the initial feature vectors together, which is used to train the final classifier. One of the disadvantages of this method is that if the initial feature vectors’ dimensions are large, the input vector of the final classifier will have a very large dimension. As the input vector dimension of a classifier is larger, the architecture will be more complex, and more training data will be required to train the classifier.
Decision Level
In this case, for each feature type, a classifier is trained using related feature vectors, and the final score of each class is obtained by combining the outputs of these classifiers. The combination of the classifiers depends on the type of output.
Ranking Level
Based on the type of applied classifiers in combining features at the decision level, the outputs of classifiers may denote a ranking, where classes with a higher probability are ranked higher. In this case, the voting methods are used to determine the class of each input data. For example, majority voting is one of the most common methods in such cases in which, the voted class by most classifiers is selected as the intended data class.
Measurement Level
This is the case that the output of the classifiers is in the form of numerical values called scores. The scoring of each classifier depends on its architecture. For example, the output of the classifier in the SVM classifier is the space between the sample and the separator hyper-plane. However, this value may indicate the probability of a class in another classifier. In the measurement level combination, two cases may occur based on the type of applied classifier:
Combining the classifiers with homogeneous output- Generally, if the outputs of classifiers are identical in terms of range and scale, they are called classifiers with homogeneous outputs. In this case, different methods are proposed to combine the output of the classifiers.
Summation: The class with the highest sum of scores is chosen as the input data class;
Multiplication: The class with the highest product of multiplying scores is chosen as the input data class;
Secondary classifier: In this case, a feature vector is obtained by putting the scores of each class together, which is presented to a secondary classifier as an input. Finally, this secondary classifier determines the input data class.
Combining classifiers with heterogeneous output- if the scoring type of classifiers is not the same i.e. they have heterogeneous output, the output of classifiers should become identical in terms of the range and scale using the normalization methods. Then, the proposed methods for classifiers with homogeneous output in the previous section are applied to combine the output of the classifiers.
Since this study applies the SVM classifier, the outputs of the classifiers are homogeneous and there is no need for normalization. Similar to the previous section, the results of the feature combination are discussed at the post and user levels.
Results of Feature Combination at Post Level
illustrates the equal error rate (EER) obtained for each feature combination method. The combination at the feature level is inefficient because of the high dimensions of the feature vectors; therefore, its accuracy is not calculated. In some cases, combining the features increased the classification accuracy significantly. The highest classification accuracy is attained at the decision level for the summation method; while the lowest accuracy is associated with the majority voting or ranking level combination.
Table 4. Results of feature combination methods at post level
Results of Feature Combination at User Level
The feature combination is applicable in two ways to identify influential users. In the first case, similar to the previous section, feature combination is performed at the post level on the primary feature vectors extracted from the images (). Since the output of the feature combination method at the ranking level is the post label (not the score), in this case, the only threshold-based method to determine the influential users, is “Threshold on the number of influential posts.” In threshold-based methods, the accuracy of each feature is calculated on various thresholds, and the threshold with identical positive and negative class error rates is implemented as the final threshold based on the EER criterion. illustrate the ROC curve in threshold-based approaches for one execution of the algorithm. and provide positive and negative error rate charts for different thresholds in the threshold-based method. The intersection point of the two curves represents the final threshold and accuracy.
Table 5. Results of the first case of feature combination methods at user level
Figure 17. ROC curve of the threshold-based methods for different feature combination methods at one execution of the algorithm. (a) Threshold on the number of influential posts. (b) Threshold on the average scores of posts.
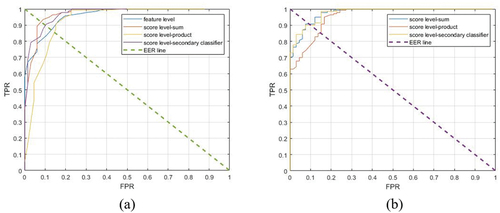
Figure 18. The positive and negative error rates for different thresholds in Threshold on the number of influential posts method for (a) measurement level-Secondary classifier combination method, (b) measurement level-Multiplication combination method, (c) measurement level-summation combination method and (d) ranking level combination method.
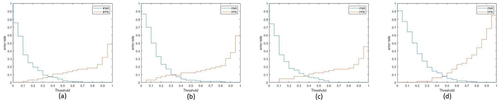
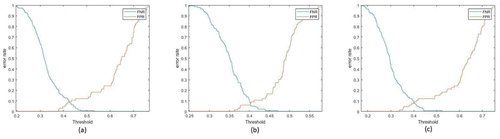
Figure 19. The positive and negative error rates for different thresholds in Threshold on the average scores of posts method for (a) measurement level-Secondary classifier combination method, (b) measurement level-Multiplication combination method, (c) measurement level-summation combination method.
The second case happens at user level in the statistical analysis method, where the feature combination methods are applied on the statistical information vectors related to different features (). In this case, the feature combination results are also investigated at the feature level due to the low dimensions of the feature vectors (4 dimensions).
Table 6. Results of the second case of feature combination methods at user level
Discussion
According to and , the advertising features result in the highest accuracy in detecting influential posts and users. This result confirms the initial hypothesis that most influential user’s posts also have an advertising aspect.
Among the feature combination methods, the summation and secondary classification methods reached the highest accuracy with a slight difference; however, the multiplication and voting methods (ranking level) have the lowest accuracy. The low accuracy of the voting method is because it neglects the information provided by the numerical values and only the label calculated for each data by the classifiers is applied. The low accuracy of the multiplication method is because in this method, if the output of one of the classifiers for the correct class is equal to zero, the product of the multiplication of the scores will be equal to zero and the output of the other classifiers is practically ignored. Moreover, according to (Josef et al. Citation1998), the summation method has higher resistance than the multiplication method in terms of estimation errors, which justifies the high accuracy of this method. The summation and multiplication methods adopt a fixed rule to combine the classifiers in all problems. However, in the secondary classifier method, the rule to combine the classifier scores in each problem is trained based on the nature of the problem, which increases the accuracy of this feature combination method.
Another test addressed the influential users who were mistakenly classified as non-influential users ten times during 50 consecutive executions of the algorithm by the statistical analysis method and using secondary classifier combination method. Six individuals were detected in this way. The images shared by three of them were not very similar to the images shared in the “fashion” field, and they were more related to other areas such as “food” and “travel,” which may be the reason of the incapability of the algorithm to classify them correctly.
As mentioned before, there are a few studies on the influencer identification methods, which classify the influencers in social networks relying on the contents of users’ posts in a framework similar to the dataset used in this study. Thus, among the recent studies, a study is selected that is conducted in a similar framework focusing on textual content of posts to distinguish the influencers. In this study (Bashari and Fazl-ersi Citation2020), the influencers are classified relying the context of the posts. The context of each post is divided into caption and hashtags. Where each part is processed independently to extract the feature vectors. In the next step, an SVM classifier is trained for each feature type obtained in the previous step to discriminate the influencing posts from non-influencing posts. Next, these classifiers are combined in the Kernel space using the weighted mean method. The RBF kernel is used to classify the posts based on caption and histogram sharing is used as kernel to classify the posts based on hashtag. Finally, in order to detect the influencer users on Instagram, the threshold-based methods are used. The Threshold on the number of influential posts method has achieved the maximum accuracy of 83.64% for a threshold of 0.85 and the threshold on average scores of posts method has achieved the maximum accuracy of 83.18% for a threshold of 0.48.
Conclusion
Online social networks are a relatively new phenomenon in the global community, which provide researchers a considerable volume of information to research and study social behaviors. Therefore, in recent years, detecting the influencers in social networks has been one of the important research fields. Virtual marketing is an important application of this research field, which is considered by numerous large companies in production and industry. This study examined the influencer detection methods in social networks and provided the advantages and disadvantages of each one. Given the existing challenges in this area, a method was proposed to eliminate the deficiency of previous studies by emphasizing the image content of users. Then, to evaluate the proposed method properly, the topic-oriented data including the shared images of the influential and non-influential users on the Instagram social network were collected.
The shared images were examined in terms of semantics, color scheme, and advertising aspects. However, an image includes a wide variety of aspects that each one may have the potential to distinguish between influential and non-influential people. Future studies could achieve better results by examining these features and combining them with the ones used in this research. Moreover, while the proposed method emphasized using images to distinguish between the influential and non-influential people, the captions may also contain valuable information. The proposed image-based method can be combined with text-based methods and features extracted by text processing and achieve higher accuracy.
According to , the dataset applied to train the classifiers included 691 users with 20 posts. It is possible to train more complex classifiers with more features and gain higher accuracy by increasing the number of users and consequently the number of posts per user. This research used the hashtags in the text of the images to detect active users in the field of “fashion.” The hashtag-based method is one of the easiest and fastest ways to achieve this goal. Given the progress in text processing, various topic extraction methods with higher accuracy, quality, and applicability emerge every day. Besides the above-mentioned cases, the effectiveness of the proposed method could be addressed in other fields such as “food” and “travel,” etc.
Disclosure statement
No potential conflict of interest was reported by the author(s).
References
- Bae, J., and S. Kim. 2014. Identifying and ranking influential spreaders in complex networks by neighborhood coreness. Physica A: Statistical Mechanics and Its Applications 395 (February):549–824. doi:10.1016/j.physa.2013.10.047.
- Bashari, B., and E. Fazl-ersi . 2020. Influential post identification on instagram through caption and hashtag analysis, Measurement and Control (United Kingdom) 53(3–4): 409–415. https://doi.org/10.1177/0020294019877489. doi:10.1177/0020294019877489.
- Beiming, S. and Vincent, T. Y. N.et al. 2013. Identifying influential users by their postings in social networks, In Atzmueller M., Chin A., Helic D., and Hotho A., Ubiquitous Social Media Analysis. MUSE 2012, MSM 2012. Lecture Notes in Computer Science, vol 8329, Bristol, UK: Springer, Bristol, UK, pp. 128–51. DOI: 10.1007/978-3-642-45392-2_7
- Bigonha, C., T. N. C. Cardoso, M. M. Moro, M. A. Gonçalves, and V. A. F. Almeida. 2012. Sentiment-based influence detection on twitter. Journal of the Brazilian Computer Society 18 (3):169–83. doi:10.1007/s13173-011-0051-5.
- Borth, D., J. Rongrong, T. Chen, T. Breuel, and S.-F. Chang. 2013. Large-scale visual sentiment ontology and detectors using adjective noun pairs, Proceedings of the 21st ACM international conference on Multimedia, October 2013 Association for Computing Machinery, 223–232. Barcelona, Spain. doi:10.1145/2502081.2502282.
- Cha, M., H. Haddai, F. Benevenuto, and K. P. Gummadi . 2010. Measuring user influence in twitter : The million follower fallacy. Proceedings of the Fourth International AAAI Conference on Weblogs and Social Media, 06 2010 Washington, D.C 14 . 10–17 doi:10.1.1.167.192.
- Chen, D., L. Lü, M.-S. Shang, Y.-C. Zhang, and T. Zhou. 2012. Identifying influential nodes in complex networks. Physica A: Statistical Mechanics and Its Applications 391 (4):1777–87. doi:10.1016/j.physa.2011.09.017.
- Gao, S., M. Jun, Z. Chen, G. Wang, and C. Xing. 2014. Ranking the spreading ability of nodes in complex networks based on local structure. Physica A: Statistical Mechanics and Its Applications 403:130–47. doi:10.1016/j.physa.2014.02.032.
- Han, B., P. Cook, and T. Baldwin. 2014. Text-based twitter user geolocation prediction. Journal of Artificial Intelligence Research 49:451–500. doi:10.1613/jair.4200.
- Hussain, Z., M. Zhang, X. Zhang, Y. Keren, C. Thomas, Z. Agha, N. Ong, and A. Kovashka. 2017. Automatic understanding of image and video advertisements. 2017 IEEE Conference on Computer Vision and Pattern Recognition (CVPR), Honolulu, HI, USA, 1100–10. IEEE. 10.1109/CVPR.2017.123.
- Jianqiang, Z., G. Xiaolin, and T. Feng. 2017. A new method of identifying influential users in the micro-blog networks. IEEE Access 5:3008–15. doi:10.1109/ACCESS.2017.2672680.
- Josef, K., M. Hatef, R. P. W. Duin, and J. Matas. 1998. On combining classifiers. IEEE Transactions on Pattern Analysis and Machine Intelligence 20 (3):226–39. doi:10.1109/34.667881.
- Kwak, H., C. Lee, H. Park, and S. Moon. 2010. What is twitter, a social network or a news media? Categories and subject descriptors. Www’ 10:591–600. doi:10.1145/1772690.1772751.
- Ling Ling, M., M. Chuang, H. Feng Zhang, and B. Hong Wang. 2016. Identifying influential spreaders in complex networks based on gravity formula. Physica A: Statistical Mechanics and Its Applications 451:205–12. doi:10.1016/j.physa.2015.12.162.
- Liu, Y., M. Tang, T. Zhou, and D. Younghae. 2016. Identify influential spreaders in complex networks, the role of neighborhood. Physica A: Statistical Mechanics and Its Applications 452 (November 2015):289–98. doi:10.1016/j.physa.2016.02.028.
- Lü, L., T. Zhou, Q.-M. Zhang, and H. Eugene Stanley. 2016. The H-index of a network node and its relation to degree and coreness. Nature Communications 7 (1):10168. doi:10.1038/ncomms10168.
- Lü, L., Y. Cheng Zhang, C. Ho Yeung, and T. Zhou. 2011. Leaders in social networks, the delicious case. PLoS ONE 6 (6). doi: 10.1371/journal.pone.0021202.
- M Alqhtani, S., S. Luo, and B. Regan. 2015. Fusing text and image for event detection in twitter. The International Journal of Multimedia & Its Applications 7 (1):27–35. doi:10.5121/ijma.2015.7103.
- Neves, A., R. Vieira, F. Mourão, and L. Rocha. 2015. Quantifying complementarity among strategies for influencers’ detection on twitter. Procedia Computer Science 51 (1):2435–44. doi:10.1016/j.procs.2015.05.428.
- Qian, L., T. Zhou, L. Lü, and D. Chen. 2014. Identifying influential spreaders by weighted leaderrank. Physica A: Statistical Mechanics and Its Applications 404:47–55. doi:10.1016/j.physa.2014.02.041.
- Qian, M., and M. Jun. 2017. Identifying and ranking influential spreaders in complex networks with consideration of spreading probability. Physica A: Statistical Mechanics and Its Applications 465:312–30. doi:10.1016/j.physa.2016.08.041.
- Räbiger, S., and M. Spiliopoulou. 2015. A framework for validating the merit of properties that predict the influence of a twitter user. Expert Systems with Applications 42 (5):2824–34. doi:10.1016/j.eswa.2014.11.006.
- Riquelme, F., and P. González-Cantergiani. 2016. Measuring user influence on twitter: A survey. Information Processing & Management 52 (5):949–75. doi:10.1016/j.ipm.2016.04.003.
- Rosenthal, S. 2014. Detecting influencers in social media discussions. XRDS: Crossroads, the ACM Magazine for Students 21 (1):40–45. doi:10.1145/2659889.
- Rui, T., P. Cui, and W. Zhu. 2017. Joint user-interest and social-influence emotion prediction for individuals. Neurocomputing 230:66–76. doi:10.1016/j.neucom.2016.11.054.
- Skowron, M., B. Ferwerda, M. Tkalčič, and M. Schedl. 2016. Fusing social media cues: Personality prediction from twitter and instagram. Proceedings of the 25th International Conference Companion on World Wide Web. Montréal Québec Canada, 107–08. 10.1145/2872518.2889368.
- van de Weijer, J., C. Schmid, J. Verbeek, and D. Larlus. 2009. Learning color names for real-world applications. IEEE Transactions on Image Processing 18 (7):1512–23. doi:10.1109/TIP.2009.2019809.
- Weng, J., E.-P. Lim, J. Jiang, and Q. He. 2010. TwitterRank:Finding topic-sensitive influential twitterers. Proceedings of the Third ACM International Conference on Web Search and Data Mining - WSDM ’10 , 261. New York, New York, USA: ACM Press. 10.1145/1718487.1718520.
- Xiao, C., Y. Zhang, X. Zeng, and W. Yue. 2013. Predicting user influence in social media. Journal of Networks 8 (11):2649–55. doi:10.4304/jnw.8.11.2649-2655.
- Yu Hsiang, F., C. Yuan Huang, and C. Tsai Sun. 2015. Using global diversity and local topology features to identify influential network spreaders. Physica A: Statistical Mechanics and Its Applications 433:344–55. doi:10.1016/j.physa.2015.03.042.
- Zeng, A., and C. Jun Zhang. 2013. Ranking spreaders by decomposing complex networks. Physics Letters, Section A: General, Atomic and Solid State Physics 377 (14):1031–35. doi:10.1016/j.physleta.2013.02.039.