
 ?Mathematical formulae have been encoded as MathML and are displayed in this HTML version using MathJax in order to improve their display. Uncheck the box to turn MathJax off. This feature requires Javascript. Click on a formula to zoom.
ABSTRACT
Predictive analytics is being increasingly used to predict various aspects of applications and users. It offers vast opportunities in the growth of the modern era’s business transformation by enabling automated decision-making processes. Being able to determine the intention of users in an automated way is one of the important factors in enabling automated decision-making for applications and businesses using such applications. In this paper, we utilize and build upon the existing works, and propose a comprehensive intention assessment model that detects different possible intents of users by analyzing their text-based reviews on online forums, retail market websites, or on social media. If the information about a product or service experience is present somewhere in a review or post, our technique can accurately segregate different possible purchase intention labels (i.e., positive, negative, and unknown). Our proposed comprehensive model for intention assessment includes extensive data pre-processing, extended feature selection model, utilization of artificial intelligence (machine learning and deep learning) techniques, and customized cost and loss functions. We built a comprehensive testbed and carried out evaluations and comparisons. Our solution demonstrates high accuracy, precision, and F1 score. The proposed solution helps in mining and gaining deeper insights into behavior of consumers and market tendencies and can help in making informed decisions.
Introduction
Use of many online applications employed by businesses such as retail are growing at a high pace and so is the demand for products in the market (Deloitte Touche Tohmatsu Limited, Citation2003). A huge number of transactions are occurring daily, and the number of transactions is continuously increasing every year (Rigby Citation2019). Purchase patterns vary in terms of cultures, geographical locations, social, economic, political situations locally and globally, as well as in terms of users’ etiquette too. Besides, social networking websites and applications provide a platform for users to express their responses toward any consumed goods or services provided by the company (Atouati, Lu, and Sozio Citation2020). In the past, to analyze behavior and to understand the needs of customers, researchers conducted surveys, carried out manual data collection and statistical data analysis (Chrysochou Citation2017).
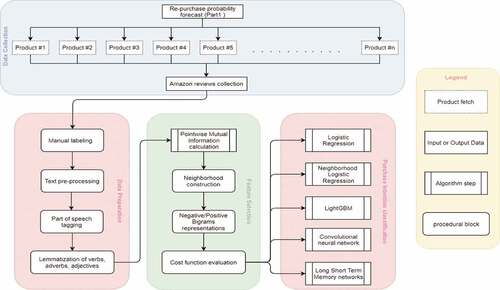
Figure 1. Detailed technical design diagram.
Plenty of research works provided substantial results while evaluating online user-generated data (Da Silva, Hruschka, and Hruschka Citation2014; Kumari and Haider Citation2020). Many customers purchasing online share their personal experiences related to different produces and services offered by businesses. In Joshi and Tekchandani (Citation2016); Liang and Dai (Citation2013), researchers have shown that data resulting from user-generated tweets can be used to predict the movie revenues and sales of digital devices. Centered on the idea of Vatrapu et al. (Citation2015), we assume that online reviews, feedbacks, posts, and discussions about different products or services influence the attention of the current and prospective consumers, and hence may positively or negatively impact the popularity, demand, and market value of such products and services. Therefore, we aim to build a model that can analyze and detect any possible information hidden deep into such user-generated data, such online reviews and any other forms of feedback in textual form that can give an indication on the overall intention of users or customers. Such intentions could be positive, negative, or neutral. There are a few examples presented in that demonstrate differences between sentiment and intention of customers by analyzing their reviews.
Table 1. Difference between intent and sentiment
The existing related works, such as Atouati, Lu, and Sozio (Citation2020) built a binary classifier where their solution was limited to find out if a tweet contains a negative purchase intent context or not. After carrying out extensive experimentation and analysis, we found out that even though utilizing the significant works done in the field of sentiment analysis such as Aung and Pa (Citation2020); Chandra and Jana (Citation2020), sentiment analysis cannot simply be easily adapted to classify purchase intent present in a text. We show that a positive sentiment (PS) may not mean or imply positive purchase intent (PPI), and vice versa. We also show that a negative sentiment (NS) may also not mean or imply negative purchase intent (NPI), and vice versa. The examples showing the difference between sentiment and intention in text-based content generated by users presented in are a subset of our training data retrieved from Amazon Fresh’s website.
In the related works, the concentration is mainly on negative purchase intention. We have expanded the research scope by identifying all three possible categories of intent, i.e., Negative Purchase Intent (NPI), Positive Purchase Intent (PPI), and Unknown or Neutral Purchase Intent (UPI). In order to achieve this, we introduce three distinct binary classifiers for each intent class because purchase intent is expressed using relatively rich and dense vocabulary, which could confuse a multi-classifier. For example, the review “Very fresh berries. I will order them again this month before my prime membership expires. Might switch to Instacart then” contains positive sentiment, positive purchase intent for the next order in the former half of the review. But the user expresses negative purchase intention in the latter half. Hence, in order to accurately evaluate such special cases and avoid classification noise, we introduce three separate binary classifiers for each purchase intent category to be able to clearly identify positive, negative, and unknown purchase intent.
Motivation: The motivation behind this work is to help businesses keep track of the intentions of their customers or users, by building a model that can automatically and correctly predict different purchase intentions of users associated with different items in the retail market. Purchase intentions can be positive, negative, or neutral. In this way, decision makers and strategists can benefit by planning for their businesses and strategies accordingly. Stakeholders can also benefit by planning for efficient, optimized supply chains, marketing, business operations and customer service. Online reviews on different platforms, and posts, discussions on social media are important channels for collecting relevant data, which can be utilized by different machine and deep learning models to identify customers’ intention and predict any possibilities of conversion of customers to purchase.
Contributions: This paper presents the problem of user or customer intention in a broader way, including positive, negative, and unknown purchase intents. We show that positive or negative reviews may not simply mean or imply positive or negative purchase intents. We propose a comprehensive customer intention assessment model by utilizing and building upon the existing works, such as (Atouati, S. et al., Citation2020). We carry out data preparation that includes labeling, data cleaning, part of speech (POS) tagging, and lemmatization. We then presented an extended feature selection model containing the pointwise mutual information and neighborhood construction. We then customized cost and lost functions. We built a testbed to conduct comprehensive evaluation using several machine learning and deep learning models, such as Light GBM, NeighLOR, Recurrent Neural Networks (RNN), Long Short Term Memory (LSTM) Networks, Logistic Regression, and Convolutional Neural Networks (CNN). Our proposed solution acts as an information system that can be used to detect and assess intentions of users or customers by analyzing their text-based reviews.
Structure: The rest of the paper includes section 2, which reviews the literature regarding the product–customer relationship concerning different research methodologies applied so far. The third section contains the methodologies used for model design and implementation. The results and evaluation in terms of functional, efficiency, and comparative analysis are displayed in section 4. Lastly, concluding remarks of our findings are mentioned in section 5.
Related Work
Many literature analyses provide a substantial reason to unfold the relationship between customers and retailers (Deloitte Touche Tohmatsu Limited. Global Powers of Retailing Citation2003). As mentioned in Deloitte Touche Tohmatsu Limited. Global Powers of Retailing (Citation2003), many theories and tools are used to describe how to manage relationships with customers efficiently and strategically by new businesses and organizations (Haque et al. Citation2019; Sakar et al. Citation2019; XingFen, Xiangbin, and Yangchun Citation2018). All these methods are developed by reviewing areas oscillating from consumer psychology and behavior on the customer at an individual level. To provide direction to our research study, we will explain various state-of-the-art prediction models that are being used so far.
Considering this budding issue, Kumar et al. (Citation2019) investigated customer behavior to understand the intentions of repurchase done online. Their study is inferred from a theoretical solution by analyzing the shopping malls context with respect to customer’s behavioral patterns. According to the findings of their experiments, the AdaBoost classification model generated higher accuracy and sensitivity of 97.58% and 0.95, respectively. The focus of their study was to interrogate customer behavior in association with online purchases. Many other factors could have been used to increase the quality of the work by prioritizing these attributes in an efficient manner such as e-service provider’s details and ranking interactive features of websites (Kim and Gupta Citation2009).
XingFen, Xiangbin, and Yangchun (Citation2018), proposed scenario-based optimization algorithms that integrated logistic regression with the XGBoost algorithm with the intention of predicting user’s purchasing behavior on an e-commerce website. The objective of their research was to analyze the purchase pattern of specific products in a certain period. Their research has the potential to provide major improvements in the marketing of online platforms for finding out new and potential buyers. The authors managed to generate superior and feasible results using an integrated model, but the problem of slow parameter search in the XGBoost algorithm is unattended. Artificial Chemical Reaction Optimization Algorithms (ACROA) could be utilized to optimize the parameters of the XGBoost model, as suggested in (Jiang et al.).
Sakar et al. (Citation2019) researched on behavior of customers browsing through online websites of e-commerce platforms and their conversion rate of such customers. Their solution carries out real-time analysis of customer interaction with online platforms. They analyzed pageviews and combined session with customer data. They further utilized data mining techniques on the data that helped them in predicting purchase intentions of customers. The knowledge assembled in the first module of their study was used to generate offers by analyzing the user’s intention of purchase. Considering the technology enhancement of this era, their novel solution could have improved the conversion rates by providing personalized suggestions to the users on various platforms as discussed in Grbovic et al. (Citation2015).
Tahiri, Mazoure, and Makarenkov (Citation2019) a machine learning model is built to predict which products may be purchased by users from different store locations in their next shopping trips. To carry out such prediction, their solution considers purchase history of users, usage of any promotional discounts or similar events in different store locations, and distance of residence of users with the relevant store locations. Due to the limitation in the size of the dataset, they simulated the real data and augmented the real dataset. The amplification of data led to an increase in the accuracy of the model from 27% to 49%. However, the quality of the model could have been increased if the model allowed an influx of new products or user entries in the database.
Gupta et al. (Citation2014) presented an interesting work that aims toward understanding consumer purchase intent based on their social media interactions. The authors evaluated their proposed model solution on a linear SVM model using the area under the curve metric measurement. While training their two data sets, they achieved a 0.93 and 0.89 AUC score.
Haque et al. (Citation2019) worked on the related problem of measuring the purchase probability of the product or services by analyzing Twitter data. They proposed an approach based on recurrent neural networks, but the tangible novelty of their work was reflected by the semi-automatic technique to create a training dataset. For their model evaluation, they addressed the class imbalance problem and measured the performance based on F-score to generate meaningful information. They compared the results of their proposed LSTM model with other base classifiers such as decision trees, logistic regression, random forest, and Naïve Bayes to provide a substantial base to their high achieved F1-score (83%).
Onan and Korukoğlu (Citation2017) proposed an optimization technique to feature selection, which combines the variable lists generated by various feature selection techniques to provide a more efficient and robust feature subset. A genetic algorithm was used to combine the different feature lists. Experiments show that the suggested aggregation model is an effective way for sentiment classification, but capitulate to direct the degree of sentiment.
The focus of Haque et al. (Citation2019) was to classify purchase intents of the Twitter user. However, their model evaluated a high precision rate and sub-standard recall rate. Therefore, their model correctly identified purchase intent tweets but struggled in identifying non-purchase intent tweets.
Basiri et al. (Citation2021) utilized deep learning methods to carry out sentiment analysis of tweets , which demonstrates that adding an attention structure to the outputs of the LSTM and GRU parts of the network improves the semantic information. The primary limitation of this work is that the training data used for sentiment and emotion recognition rely on already labeled or crowd-sourced data.
Ding et al. (Citation2015) presented a domain adaptation model with the aim of mining intentions of social media users to purchase domain-related products. They evaluated the model on a dataset collected from the Chinese microblogging website, Sina Weibo, with the purpose of providing better recommendations to the consumers by targeting advertisements. During model evaluation, they considered accuracy as their main performance assessment metric. However, they neglected the statistics of class imbalance. They mentioned that only 625 out of 1000 posts show the direct intention of purchase, which results in a high imbalance in their data classification. Hence, measuring the accuracy of the experiments might have obscured the meaningful information
A novel technique based on lexicon-semantic patterns was introduced by Hamroun, Gouider, and Said (Citation2015) for leveraging the commercial business. They studied the consumption intention of the users via microblog posts. Precision and Recall were used as evaluation metrics, and they achieved a maximum of 55.59% and 55.28%, respectively. The patterns extracted were then used as features for the classification process. They applied their approach to five different datasets to validate the superiority of the model. The authors did not provide any imbalanced data aspect related to the tweets. Their model worked consistently on pre-defined stable data, which depicts the lack of data-processing and cleaning of other datasets used. Moreover, the method proposed lacks in extracting the domain-specific knowledge out of the text. For example, if the tweet is classified in the intent category, the label is intent remains unclear.
In Atouati, Lu, and Sozio (Citation2020), they introduced a superiorly structured solution model that recognized each aspect related to knowledge extraction from social media data. They worked on identifying specific intent class (negative purchase intention), which no doubt is an addition to the previous related work. However, they could have extended their branch in specifying positive intent class as well by following the same structure model. Thus, their work provides a significant research baseline for the model extension.
Our study could be an example to depict how retail businesses can apply machine learning where no details about user interaction are explicitly available. The task is to predict the customer’s purchase intention labels (negative, positive, or unknown) toward the product by utilizing online user-generated data. Concisely, we aim to understand the intentions of the customers relating to the retail market and the other way around. So, in other words, intention refers to the inclination of the subject toward an object, wherein our case subject and object refers to consumers and retailers.
Solution Design
The high-level structure of the proposed solution comprises three distinctive fragments as shown in . We scraped user reviews posted for products that are purchased from Amazon’s fresh website by specifying a characteristic user-agent string in the request header that allows servers to identify the source browser and operating system from which scraping request has been executed. Before feeding the data to automated proceedings, the manual labeling of each review is done to divide them under three categories of purchase intention (positive, negative, or unknown).
Our solution utilizes and builds upon the existing works. It includes comprehensive data pre-processing, data preparation, data cleaning, labeling, Part Of Speech (POS) tagging, and lemmatization; extension to feature selection model; customization of the existing cost and loss functions; and employing the existing machine learning and deep learning models, including LGBM, NeighLOR, Recurrent Neural Networks (RNN), Long Short Term Memory (LSTM), Logistic Regression and Convolutional Neural Networks (CNN).
In the data preparation block, we clean and prepare the collected reviews by categorizing and tagging part-of-speech for each review with the NLTK library in the Python programming language (NLTK.tag package Citation2020). Next, we feed the pre-processed data to the feature extraction and selection block, which calculates the pointwise mutual information for the tagged words. It is then used to construct the neighborhoods by assessing word bigrams. Following that, we customize the cost function for the classifiers to be applied for the prediction. We employ the machine learning and deep learning models that utilize overlapping neighborhood construction of words and variant parameters of the cost function. In our earlier work (Sharma and Shafiq Citation2020), we built an ensemble model by utilizing different machine learning and deep learning techniques with historical data to carry out purchase prediction. This helped us in selecting the machine learning and deep learning models for building the solution in this work.
Data Collection
In this section, we describe the dataset we used for building the model. For this study, we collected the online product reviews available through Amazon’s fresh website (Amazon Fresh website Citation2020) as of April 2020. We retrieved all the pages containing reviews for 10 products utilizing the user-agent header string for source identification and the Beautiful Soup (Beautiful Soup Citation2020) python library, which is designed to scrape information from HTML and XML pages.
We set the URL search query to each product’s customer review page. The Beautiful Soup library scrapes the class defined by the XML page, which contains the text of reviews. We collected approximately 1700 user reviews associated with each product query. Each web page containing the customer review content was parsed to extract the class type “a-size-base review-text review-text-content” from HTML page formatting. Since we are focused on identifying purchase intention commitment by the user, we only extracted user review text, neglecting other features such as Rating, Date of review, and Helpful count. The quantity of data that we obtained bred one of the major challenges while splitting into training and testing sets. We split the data using sklearn.model_selection module (Training and testing data splitting module from Scikit-learn library Citation2007), where the function test size = 0.2 shows the percentage of the data to be used for testing purposes.
Data Preparation
In this section, we provide details on the preparation of web scraped raw text data for our classification model. Preparation of data is subdivided into four major steps:
Labeling: The labeling of purchase intention detection has been studied to a limited extent, as compared to the text labeling packages for sentiment analysis (Haque et al. Citation2019; VADER sentiment analyzer Citation2020). So, we manually labeled each review based on purchase intent availability in text. As mentioned above, each intent is binary classified under three different target labels: PPI, NPI, UPI. For example, in review “A few bad or moldy raspberries in the box. But rest I enjoyed them immensely and will buy them again!,” the string of words that contains “will buy them again” represents positive purchase intent. Hence, the label PPI will be set to 1 and the other two labels would set 0.
Text cleaning: To enhance the classification quality, we perform the stand preprocessing techniques explained in section 6.2.2. We remove URLs, special characters, and numbers or words that include them from the text; convert the text into the lower case; we also remove extra spaces and alphabets replicating more than twice. The abbreviated words, such as “won’t, shouldn’t,” are extended to their full forms, such as “will not, should not.” We do not remove stop words, as it might remove some useful sections of the text indicating purchase intent, such as negation words.
Part-Of-Speech tagging (POS): POS tagging is a well-known and existing linguistic affiliated process that marks all the words in a text as their corresponding part of speech. For this step, we employ NLTK’s POS tag module (Part-of-speech tag module from NLTK library Citation2020) to identify the POS subcategory for each word, such as verbs and adverbs.
Lemmatization: We execute word lemmatization by utilizing WordNet Lemmatizer (WordNet Lemmatizer Citation2020) function from the NLTK Python library. This function truncates words to root stem, such as “buying” will be converted to “buy.”
Feature Selection
Our solution aims to extend to capture all possible types of purchase intents, such as positive, negative, and neutral. Our process of feature extraction and selection employees two computational segments: the Pointwise Mutual Information and Neighborhood Construction. To identify the association between a word in the review and its intent reflecting class, we utilize Pointwise mutual information and Neighborhood construction from Statistical view of Pointwise mutual information (Citation2020) and Atouati, Lu, and Sozio (Citation2020). It is established in the baseline that the words with the highest PMI score tend to have a high correlation with the intent class. For instance, there exist words {w1, w2, w3 … wn} for a given review r. We set ppi associated with r to 1 if r indicates positive purchase intent, 0 otherwise. We evaluate the association between wi and its class where ppir = 1, statistically:
Given class ppir, for wi mentioned in r, PMI decides if feature wi is of high correlation to the class. The high correlation is directly proportional to the significance of the feature for the learning algorithm.
Since P(ppir = 1) is constant, the right-hand side of the equation is increasing logarithmically which is directly proportional to the nominator (Statistical view of Pointwise mutual information Citation2020). Hence, the correlation probability P(ppir = 1, wi) serves adequately. In the case of rare words penalization, they utilized the Gaussian confidence interval at 95% level. The adapted statistically representation for the lower bound confidence interval (g) for rare word wi is:
where g(wi) is a symmetric Gaussian interval, Pe is conditional probability estimation, rw is the review where w belongs to r, z is a constant that represents the standard normal distribution value for a confidence level. Since we evaluate the Gaussian confidence interval at 95%, in this case, z = 1.96 as proved by Sullivan (Citation2020). The above equations are extended versions of Atouati, Lu, and Sozio (Citation2020). Similar equations are defined for negative purchase intent mentioned in a review (npir) and rest are classified as unknown purchase intent (upir).
For npir:
For upir:
While extending the baseline method, we first utilize the Python package Spacy (Honnibal Citation2015) to extract the exact negation word dependency to directly distinguish the negative purchase intent. Second, in extension, we extracted bigrams of affirmation dependency as well to extract word features like “definitely buying again,” “fabulous quality” utilizing one-hot-encoding. The rest features are categorized as unknown intent depicters.
The final feature selection process includes constructing neighborhoods for the expression that indicated purchase intent. By reviewing the related works and datasets, we note that the words representing substantial intentions are confined in relatively short frames. For example, in review “A few bad or moldy raspberries in the box. But rest I enjoyed them immensely and will buy them again!,” the positive purchase intent (PPI) expressed by the reviewer is represented in the latter half of the sentence. Regardless of the sentiments in all or parts of the review, actual intention of the customer is mentioned in a part of the review. Therefore, we use the technique mentioned to construct overlapping strings by splitting a review into multiple parts. These overlapping strings help in streaming potential words by eliminating the irrelevant words.
For a review r which contains words {w1, w2, w3 … wn}, the h-neighborhood of a word wi represented in 2 h + 1 window, for every retained verb, adverbs, adjectives, and bigrams is defined in above-mentioned feature selection steps. We extended the matrix representation for NPI, we formulated the equations for all three intent labels, i.e., PPI, NPI and UPI. For a given review r, feature matrix is represented in .
Table 2. Feature matrix representation for each intent label
where hr represents the number of neighborhoods constructed for review r, f represents the features and wi is a word in r which indicates the prominent intention of purchase.
Customizing Cost Function
In this section, we customize the cost function of their employed algorithm. Formally, according to Krzyk (Citation2018), the cost function is defined as an error function that provides a summation of prediction errors (loss function) for a training algorithm. Statistically, for every parameter θ, the general equation of cost function F(θ) can be represented as:
where, for iterations from 1 to n, is defined as probability hypothesis function of logistic regression plugged in sigmoid and
is a classification error function for ith training iteration. The hypothesis function manages to limit the cost function between 0 and 1. The hypothesis function of logistic regression is utilized to interpret the neural network. Generally, the hypothesis function is represented as:
In our case, x is our label (x = ppi or npi or upi), conditional probability Pe. For logistic regression, we expect hypothesis to evaluate between 0 and 1. Hence sigmoid (
) is used:
Since our labels x is 1 or 0:
The author customized the hypothesis function (in our case, ) to imitate a neural network by injecting the neighborhood feature matrix constructed in the above section. Hence, by following their approach, our customization of the cost function can be represented as:
where is the number of overlapping neighborhoods constructed on review r. In this way, the maximum value of the sigmoid function is computed for every neighborhood.
Customizing Loss Function
To customize the cost function for the logistic regression algorithm, we focus on tailoring the loss function for the LightGBM (Ke et al. Citation2017) algorithm in this section.
Theoretically, the loss function is an error in predicting a data point correctly, whereas cost function is the sum of loss functions that is the summation of all loss function error in a training set (Dhiraj Citation2019). As we concentrate on binary classification, the loss function for LightGBM (Ke et al. Citation2017) is the same as that used in logistic regression:
By following the idea of Dhiraj (Citation2019) and Grover (Citation2018), we customize the loss function by such means that it minimizes the false-negative classifications. To conduct the same, we magnify the right-hand side of EquationEquation (12)(12)
(12) with a higher value constant (α) than the label 0 and 1, which means α > 1:s
Finally, we define a function for the LightGBM algorithm that uses our customized loss function for both validation and training. To derive gradient descent and hessian, we evaluate calculus derivates of the equation above by setting .
Table
Experimental Design
This section concentrates on the experimental setup for our extended approach to predict the purchase intentions of the Amazon reviewers. We compare our methodology by employing five different machine learning algorithms: 1) an LSTM-based model (Hochreiter and Schmidhuber Citation1997: 2) CNN model (Albawi, Mohammed, and Al-Zawi Citation2017: 3) Tailored LightGBM (Ke et al. Citation2017: 4) Tailored NeighLoR (Atouati, Lu, and Sozio Citation2020: 5) Binary logistic regression (Kleinbaum et al. Citation2002). Each algorithm is utilized separately for binary classifying the three labels: Positive purchase intent (ppi), negative purchase intent (npi), and unknown purchase intent (upi).
We train the LSTM model based on the Keras API provided by the Tensorflow library of python. LSTM consists of an input layer with dimension = 50, an LSTM layer with 32 kernels, an activation layer set to ReLU, a dropout layer with probability of 0.5, and a sigmoid activation function before output layer. The performance of the model is calculated in terms of accuracy, F1 score, precision, and recall.
We employ a Convolutional Neural Network (CNN) for three binary labels with classes 0 and 1. We create a convolutional neural net based on the sequential stack method. The network mostly contains a standard linear dense layer which defines input, weights, and outputs. The input consists of sentences that are converted into a one-hot matrix and we define ReLU as the activation function. Next, we have two dense layers that consist of a dropout probability of 0.1, which randomly removes data to avoid overfitting. We assign sigmoid and softmax activation function to the two dense layers, respectively. At last, we compile the model to evaluate the performance.
The third evaluation is done using LightGBM. We define default LightGBM by injecting a customized cost function approach, and employ our extended loss function for both training and validation while compiling the binary classifier. By default, the learning rate set to 0.1 and 100 number of iterations. We assign Mean Absolute Error (MAE) and Root mean squared error (RMSE) metrics and 10-fold cross-validation over labeled data in terms of accuracy and F1 score to measure model performance.
The next model we utilized is NeighLor introduced by Atouati, Lu, and Sozio (Citation2020). In this work, logistic regression was utilized by inducing neighborhood matrix with a 7-word window. They ran gradient descent on customized cost function with a maximum of 5000 iterations and tolerance rate. Besides, we inject out customized loss functions for training and validation sets. We carry out evaluation of the performance of the model using 10-fold cross-validation based on accuracy, precision, recall, and F1 score.
At last, we apply simple logistic regression for binary classification of the labeled data. To map the binary classes (0 or 1), we define a threshold of 0.5, in other words, input data point producing output more than 0.5 is classified as class 1, 0 otherwise as mentioned in Harrington (Citation2012). The model performance is assessed based on accuracy, precision, F1 score, and recall for consistency with other models.
The generic pseudo-code for our purchase intention classifier is as follows:
For applying the prediction model to analyze customer’s purchase intention, we first disintegrate the words in a review r using tokenizer function. For each word wi, we apply text processing methods (mention in section 6.3.4) to eliminate noise from the dataset. Next, for the feature selection task, we first apply the POS tagger and retain words that are tagged as verbs, adverbs, and adjectives. The retained words are then lemmatized using word lemmatizer function. The lemmatized words are then used to find pointwise mutual information between words to construct the n-word bigrams by utilized the dependency parsing tool. Following that, we construct overlapping neighborhood windows that might contain bigrams and adjectives. Finally, we feed the pre-processed data containing selected features to the customized machine learning algorithms for metrics evaluation.
Design Discussion
This section provides the rationale for electing specific algorithms for the task of predicting customer intentions. We aim to choose the algorithm that is demonstrated to be coherent than logistic regression, thus we apply LightGBM as our primary algorithm. According to Ke et al. (Citation2017), LightGBM is built on a histogram approach that bins continuous elements together which results in efficient training speed and low memory usage. Such parallel learning support provides the capability to perform consistently on larger as well as reduced datasets. Therefore, this algorithm suits best to analyze the fluctuating nature of social media data.
We compared our approach with NeighLoR to demonstrate the advantages and improved functional results. Since NeighLoR itself is an adoption of the logistic regression algorithm, we also apply the latter to compute the result comparison between the two. By comprehending the model choices from related works (Ding et al. Citation2015; Haque et al. Citation2019; Sakar et al. Citation2019), we also employ neural networks to execute a challenging assessment of our framework.
Result and Evalution
Here in this part, we discuss the performance outcomes of our model solution. We utilize five algorithms to establish an evaluation comparison of our processed dataset. We inaugurate the model performance analysis by recalling that each algorithm is evaluated thrice which focuses on binary classification for three distinct purchase intent labels: Positive, Negative, and Unknown.
Functional Analysis
This section discusses results on predictions produced by our customized algorithms. For metrics consistency with other solution models, we calculated accuracy, F1-score, precision, recall, and ROC-Area under the curve as the well-known evaluation metrics already available in the literature. Due to high-class imbalance, F1-score is considered the primary metric of discussion, which combines harmonic mean of precision and recalls into a single metric.
Considering TP as True positive class and FP as False-positive class, according to Powers (Citation2011), the precision on the dataset is the rate of true positive classification that belongs to the positive class. Mathematically:
Also, Powers (Citation2011) defined recall (also known as sensitivity) as a metric that quantifies missed positive predictions.
where FN is false negative class. At last, we observe the Area Under the Curve (AUC) which depicts the overall performance of the test experiment. According to (Walter Citation2005), the AUC results are combined to calculate ROC, which donated the relationship between sensitivity and specificity.
We perform 10-fold cross-validation over the manually labeled data for each intent label. For example, in the case of predicting negative purchase intent, we only consider npi feature label by overlooking the other two (npi and upi) and vice versa. While evaluating LightGBM and NeighLOR algorithms, we applied both, our customized cost function and loss function. We compared the results for Light GBM, NeighLOR, LSTM, Logistic regression and CNN. The results are shown in .
Table 3. Classification report of the model
We find that tailored LightGBM and NeighLoR achieved remarkably similar results for all three intent classifications and they outperform other models followed by LSTM in terms of F1-score. The competitive results of LSTM are because the cost function is inherited from the recurrent neural network. In contrast, disappointing results of CNN might be because the quantity of labeled data suppressed the potentials of the algorithm. While studying the overall performance of the experiments, the ROC_AUC score is taken into consideration. From , we can observe that most consistent results are acquired by the LightGBM model for all three intent label classifications. Hence, the results depict that combining our tailored loss function yields better performance.
We evaluate each intent label individually based on four metrics: F1-score, precision, recall, and ROC-AUC score. depicts the results of negative purchase intent classifiers. The highest F1-score is achieved by the NeighLoR classifier and results of LightGBM are at par, 95.7% and 94.17%, respectively. The positive and unknown intention detection classification results in and follow similar trends. The maximum metric scores are achieved by NeighLoR followed by LightGBM and LSTM. Whereas Logistic regression model obtained the lowest F1-score and minimum precision and recall are manifested by the CNN classifier.
Figure 2. Negative purchase intent assessment.
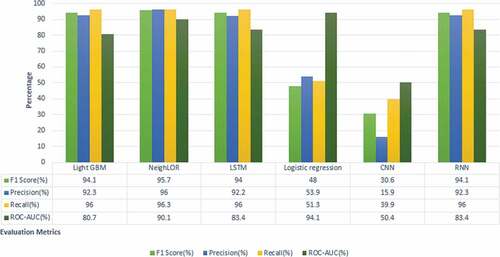
Figure 3. Positive purchase intent assessment.
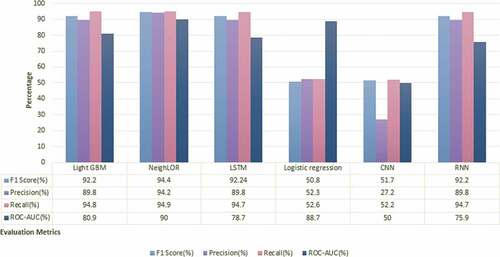
Figure 4. Unknown purchase intent assessment.
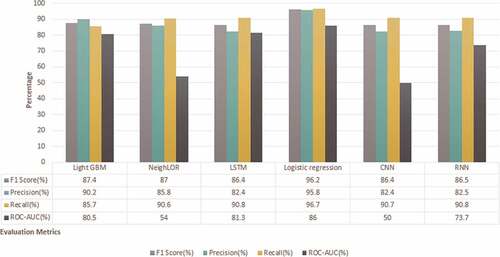
Surprisingly, the results of Logistic regression for neutral purchase classification are overriding other algorithms as it achieved 96.2% F1-score, followed by LightGBM, which performed fairly well with 87.7% F1-score. Whereas NeighLoR achieved sub-standard results. Interestingly, while classifying neutral purchase intent, both LSTM and CNN classifiers exhibited similar results, whereas a huge difference can be seen in the case of the other two labels (positive and negative).
Our proposed customized loss function approach works finest for positive and negative purchase intent classification and dominated other algorithms in every aspect of measurement.
Deployment and Efficiency Analysis
This section presents the details of deployment and efficiency analysis of the proposed comprehensive intention assessment system. The system is implemented in python and several libraries are utilized such as scikit-learn. The system uses the multiple machine learning and deep learning models. The system is deployed on a standalone server for data collection, data pre-processing, model training, and monitoring the models. The models are pre-trained and then deployed. The models are made available using Python Flask API as RESTful web service end-points.
We compare time efficiency of the algorithms at different levels of model building and deployment. The data collected for each model is the same; hence, the first input column of represents the same digits for each algorithm. We compute the time taken for feature selection, which happens to be the same for each intent label irrespective of the word-intent relationship. We mention the overall data pre-processing time for each algorithm. After calculating the time taken at every step by each algorithm and considering the function and complexity analysis, we conclude that the customized LightGBM utilizing the neighborhood construction proves superiority over the other models.
Comparative Analysis
The discussion in this section initiates a comparison of our experiment results with other previous work concentrated on a similar problem. Primarily, we assess our functional results with the baseline as Atouati, Lu, and Sozio (Citation2020). The author introduced a novel extension of the logistic regression model by defining neighborhoods for intent reflecting words aiming to detect negative intent in tweets. To evaluate the results, they collected two datasets related to British Airways and achieved an F1-score of 80.79%. Our solution outperformed the baseline by significant measures. highlights the comparison of the proposed solution with related work.
Table 4. Efficiency analysis
Table 5. Comparison of the proposed solution with the related works
In , each work utilized social media data to identify the purchase intent of the consumer. Gupta et al. (Citation2014) leveraged analysis on the public platforms Quora and Yahoo! Answers, but they only performed analysis on a single algorithm (SVM). Dissecting our proposed solution, we can argue that each algorithm’s performance varies while computing dynamic behavioral patterns. Ding et al. (Citation2015) worked on identifying consumer’s intent to purchase by introducing the novel technique of the Consumption Intention Mining Model (CIMM) based on a Convolutional Neural Network (CNN) and achieved 94.52% accuracy. However, their work does not classify the category of intent (Positive or Negative) detected. Hamroun, Gouider, and Said (Citation2015) also worked on intention analysis by extracting lexico-semantic patterns based on ontology concepts and relations designed by intentional verbs. They evaluated their novel technique using precision and recall metrics and achieved sub-standard results. We collected sufficient data from Amazon Fresh to classify different intent categories reflected in the text. The results in concludes that our detailed experimental assessment against state-of-the-art approaches manifested fairly variant and competitive results.
Conclusion and Future Work
In this section, we present the conclusion of our work followed by the recommendations for the possible extensions in future.
Conclusion
We present a solution for comprehensive intention assessment by building a model that detects three distinct labels of purchase intentions hidden in text-based reviews of users or consumers, i.e., Negative, Positive, and Neutral. Our solution, utilizing and building upon the existing works, includes comprehensive data pre-processing, data preparation, data cleaning, labeling, Part Of Speech (POS) tagging, and lemmatization; extension to feature selection model; customization of the existing cost and loss functions; and employing existing machine learning and deep learning models, including LGBM, NeighLOR, Recurrent Neural Networks (RNN), Long Short Term Memory (LSTM), Logistic Regression and Convolutional Neural Networks (CNN). The LGBM algorithm is adapted for this task by assembling the customized cost function and the tailored loss function. The solution achieves significantly reliable, consistent, and high prediction metric scores (F1 score: NPI = 84.47%, PPI = 92.2%, UPI = 87.4%) as compared to the results of the related works.
Our proposed solution can be used to find out about intentions of users or customers by analyzing their text-based reviews. While comparing our intention detection model with other similar works, we conclude that many empirical findings can further be assessed in technical and application domains to gain deeper insights into user intentions and their implications on building market strategies. Our solution requires labeled data of distinct intentions reflected in online generated data for training. The next step is to look into automating the process of intention labeling mechanism, which will optimize the model by eliminating the requirement of manual data labeling.
Future Work
Despite achieving a decent metric score for our prediction models, the research has potential for extensions. A limitation of the intention prediction model is the manual data labeling of distinct intentions reflected in online-generated data. The next step is to look into different possible automated intention label systems similar to sentiment labeling models (such as VADER) which can optimize the model by eliminating the need for manual data labeling. Moreover, our experiment is based on cost and loss function extension, due to which utilizing neural network with this algorithm faces challenges such as high feature space dimensionality and lack of feature weighting.
During our intention detection research, we only used the data from Amazon Fresh for collecting reviews and already got interesting results, therefore it proved the reliability of the model for predicting user intentions. Hence, in future, we plan to extend the data for intention classification to incorporate all the different kinds of websites with customer reviews in accordance with geographical location and see if this approach can further improve the prediction power.
Acknowledgments
The authors acknowledge the support from the Natural Sciences and Engineering Research Council of Canada (NSERC) and Carleton University, Canada. This paper is based on and is part of the thesis Sharma (Citation2020) of Archika Sharma supervised by M. Omair Shafiq, Carleton University.
Disclosure Statement
No potential conflict of interest was reported by the author(s).
Additional information
Funding
References
- Albawi, S., T. A. Mohammed, and S. Al-Zawi. 2017, August. Understanding of a convolutional neural network. In 2017 International Conference on Engineering and Technology (ICET), Antalya, Turkey, IEEE, 1–1381.
- Amazon Fresh website. 2020. Amazon fresh official website. Accessed https://www.amazon.com/alm/storefront?almBrandId=QW1hem9uIEZyZXNo
- Atouati, S., X. Lu, and M. Sozio. 2020, April. Negative purchase intent identification in Twitter. In Proceedings of The Web Conference 2020, Taipei, Taiwan, 2796–802.
- Aung, H. M. S., and W. P. Pa. 2020, February. Analysis of word vector representation techniques with machine-learning classifiers for sentiment analysis of public Facebook page’s comments in Myanmar text. In 2020 IEEE Conference on Computer Applications (ICCA), Yangon, Myanmar, 1–7.
- Basiri, M. E., S. Nemati, M. Abdar, E. Cambria, and U. R. Acharya. 2021. ABCDM: An attention-based bidirectional CNN-RNN deep model for sentiment analysis. Future Generation Computer Systems 115:279–94. doi:10.1016/j.future.2020.08.005.
- Beautiful Soup. 2020. Beautiful soup from Python library. Accessed https://pypi.org/project/beautifulsoup4/
- Chandra, Y., and A. Jana. 2020, March. Sentiment Analysis using machine learning and deep learning. In 2020 7th International Conference on Computing for Sustainable Global Development (INDIACom), New Delhi, India, IEEE, 1–4.
- Chrysochou, P. (2017). Consumer behavior research methods. In Consumer Perception of Product Risks and Benefits, Cham, Springer, 409–28.
- Da Silva, N. F., E. R. Hruschka, and E. R. Hruschka Jr. 2014. Tweet sentiment analysis with classifier ensembles. Decision Support Systems 66:170–79. doi:10.1016/j.dss.2014.07.003.
- Deloitte Touche Tohmatsu Limited. Global Powers of Retailing. 2003. (for FY2001 data), 2008 (FY2006 data), 2013 (FY2011 data) and 2018 (FY2016 data).
- Dhiraj, K. 2019. How to create a custom loss function in Keras. Accessed June 06, 2020. https://heartbeat.fritz.ai/how-to-create-a-custom-loss-function-in-keras-637bd312e9ab
- Ding, X., T. Liu, J. Duan, and J. Y. Nie. 2015, February. Mining user consumption intention from social media using domain adaptive convolutional neural network. In Twenty-Ninth AAAI Conference on Artificial Intelligence, Austin, Texas, USA.
- Grbovic, M., V. Radosavljevic, N. Djuric, N. Bhamidipati, J. Savla, V. Bhagwan, and D. Sharp. 2015, August. E-commerce in your inbox: Product recommendations at scale. In Proceedings of the 21th ACM SIGKDD international conference on knowledge discovery and data mining, Sydney, NSW, Australia, 1809–18.
- Grover, P. 2018. Custom loss functions for gradient boosting. Accessed August 22, 2020. https://towardsdatascience.com/custom-loss-functions-for-gradient-boosting-f79c1b40466d
- Gupta, V., D. Varshney, H. Jhamtani, D. Kedia, and S. Karwa. 2014, May. Identifying purchase intent from social posts. In Eighth International AAAI Conference on Weblogs and Social Media, Ann Arbor, Michigan, USA.
- Hamroun, M., M. S. Gouider, and L. B. Said. 2015. Lexico Semantic Patterns for Customer Intentions Analysis of Microblogging. In The 11th International Conference on Semantics, Knowledge and Grids, Beijing, China, 2–6.
- Haque, R., M. Hasanuzzaman, A. Ramadurai, and A. Way. 2019. Mining purchase intent in Twitter. Computación y Sistemas 23 (3). doi:10.13053/cys-23-3-3254.
- Harrington, P. 2012. Machine learning in action. Manning Publications Co.
- Hochreiter, S., and J. Schmidhuber. 1997. Long short-term memory. Neural Computation 9 (8):1735–80. doi:10.1162/neco.1997.9.8.1735.
- Honnibal, M. 2015. Accessed June 06, 2020. https://spacy.io
- Jiang Y, Tong G, Yin H and Xiong N. A Pedestrian Detection Method Based on Genetic Algorithm for Optimize XGBoost Training Parameters. IEEE Access, 7 118310–118321. doi:10.1109/ACCESS.2019.2936454
- Joshi, R., and R. Tekchandani. 2016, August. Comparative analysis of Twitter data using supervised classifiers. In 2016 I nternational Conference on Inventive Computation Technologies (ICICT), Coimbatore, India, Vol.3. IEEE, 1–6.
- Ke, G., Q. Meng, T. Finley, T. Wang, W. Chen, W. Ma, … T. Y. Liu. 2017. LightGBM: A Highly Efficient Gradient Boosting Decision Tree Advances in Neural Information Processing Systems 30 NIPS Long Beach, CA, USA. In , 3146–54.
- Kim, H. W., and S. Gupta. 2009. A comparison of purchase decision calculus between potential and repeat customers of an online store. Decision Support Systems 47 (4):477–87. doi:10.1016/j.dss.2009.04.014.
- Kleinbaum, D. G., K. Dietz, M. Gail, M. Klein, and M. Klein. 2002. Logistic regression. New York: Springer-Verlag.
- Krzyk, K. 2018. Coding deep learning for beginners — Linear regression (Part 2): Cost function. Accessed https://towardsdatascience.com/coding-deep-learning-for-beginners-linear-regression-part-2-cost-function49545303d29f
- Kumar, A., G. Kabra, E. K. Mussada, M. K. Dash, and P. S. Rana. 2019. Combined artificial bee colony algorithm and machine learning techniques for prediction of online consumer repurchase intention. Neural Computing & Applications 31 (S2):877–90. doi:10.1007/s00521-017-3047-z.
- Kumari, P., and M. T. U. Haider (2020, January). Sentiment analysis on Aadhaar for Twitter Data—A hybrid classification approach. In Proc of International Conference on Computational Science and Applications: ICCSA 2019, Springer Nature, 309.
- Liang, P. W., and B. R. Dai. 2013, June. Opinion mining on social media data. In 2013 IEEE 14th International Conference on Mobile Data Management, Milan, Italy, Vol. 2, 91–96.
- NLTK.tag package. 2020. Accessed https://www.nltk.org/api/nltk.tag.html
- Onan, A., and S. Korukoğlu. 2017. A feature selection model based on genetic rank aggregation for text sentiment classification. Journal of Information Science 43 (1):25–38. doi:10.1177/0165551515613226.
- Part-of-speech tag module from NLTK library. 2020. Accessed https://www.nltk.org/api/nltk.tag.html
- Powers, D. M. 2011. Evaluation: From precision, recall and F-measure to ROC, informedness, markedness and correlation.
- Rigby, D. K. 2019. “The future of shopping” – Harvard business review. Accessed https://hbr.org/2011/12/the-future-of-shopping
- Sakar, C. O., S. O. Polat, M. Katircioglu, and Y. Kastro. 2019. Real-time prediction of online shoppers’ purchasing intention using multilayer perceptron and LSTM recurrent neural networks. Neural Computing & Applications 31 (10):6893–908. doi:10.1007/s00521-018-3523-0.
- Sharma, A. 2020, August. Retail customer and market proclivity assessment using historical data and social media analytics. Master thesis., supervised by M. Omair Shafiq, Carleton University.
- Sharma, A., and M. O. Shafiq. 2020. Predicting purchase probability of retail items using an ensemble learning approach and historical data, 19th IEEE International Conference on Machine Learning and Applications (ICMLA), Miami, FL, USA, December 2020.
- Statistical view of Pointwise mutual information. 2020. Accessed https://en.wikipedia.org/wiki/Pointwise_mutual_information
- Sullivan Dr, L. 2020. Confidence intervals. Accessed http://sphweb.bumc.bu.edu/otlt/MPHModules/BS/BS704_Confidence_Intervals/BS704_Confidence_Intervals_print.html
- Tahiri, N., B. Mazoure, and V. Makarenkov. 2019. An intelligent shopping list based on the application of partitioning and machine learning algorithms.
- Training and testing data splitting module from Scikit-learn library. 2007. Accessed https://scikit_learn.org/stable/modules/generated/sklearn.model_selection.train_test_split.html
- VADER sentiment analyzer. 2020. Accessed https://www.nltk.org/_modules/nltk/sentiment/vader.html
- Vatrapu, R., A. Hussain, N. B. Lassen, R. Mukkamala, B. Flesch, and R. Madsen. 2015. Social set analysis: Four demonstrative case studies. Proceedings of the 2015 International Conference on Social Media & Society, Toronto, ON, Canada.
- Walter S D. 2005. The partial area under the summary ROC curve. Statist. Med., 24(13), 2025–2040. 10.1002/sim.2103
- WordNet Lemmatizer. 2020. A module from NLTK library. Accessed https://www.nltk.org/_modules/nltk/stem/wordnet.html
- XingFen, W., Y. Xiangbin, and M. Yangchun. 2018, December. Research on user consumption behavior prediction based on improved XGBoost algorithm. In 2018 IEEE Intl Conf on Big Data (Big Data), Seattle, WA, USA, 4169–75.