
 ?Mathematical formulae have been encoded as MathML and are displayed in this HTML version using MathJax in order to improve their display. Uncheck the box to turn MathJax off. This feature requires Javascript. Click on a formula to zoom.
ABSTRACT
The sudden outbreak of the novel coronavirus (nCoV-19, COVID-19) and its rampant spread led to a significant number of people being infected worldwide and disrupted several businesses. With most of the countries imposing serious lockdowns due to the increasing number of fatalities, the social lives of millions of people were affected. Although the lockdown led to an increase in network activities, online shopping, and social network usage, it also raised questions On the mental wellness of society. Interestingly, excessive usage of social networks also witnessed humor traveling across the Internet in the form of Internet Memes during the lockdown period. Humor is known to affect our well-being, decision-making, and psychological systems. In this paper, we have analyzed the Internet Meme activity in Social Networks during the COVID-19 Lockdown period. As humor is known to relieve individuals from psychological stress, it is necessary to understand how human beings adopted Internet Memes for coping up with the lockdown stress and stress-relieving mechanism during the lockdown period. In this paper, we have considered thirty popular memes and the increase in the number of their captions within the period (September 2017 to August 2020). An increase in Internet Meme activity since the lockdown period (March 2020) depicts an increase in online social behavior. We analyze the internet meme activity in social networks during the COVID-19 lockdown period using random forest, multi-layer perceptron, and instance-based learning algorithms followed by data visualization using line graph and Heat Map (8 & 15 clustered). We also compared the performance of the models using evaluation parameters like mean absolute error, root-mean-squared error & Kappa statistics and observed that random forest and instance-based learning algorithms perform better than multi-layer perceptrons. The result indicates that random forest and instance-based learning classifiers are having near perfect classification tendencies whereas multi-layer perceptrons showed around 97% classification accuracy.
Introduction
The novel coronavirus was discovered in late December 2019 in the Wuhan district of China (Phelan, Katz, and Gostin Citation2020). With the escalating number of cases worldwide, it touched a million confirmed cases in no time (Sujatha et al., Citation2020). As the case fatality ratio increased, the World Health Organization (WHO) declared it a pandemic (Cucinotta et. al, Citation2020). The primary reason for this virus infection in such a large population is because it is airborne and can be transmitted from person to person quite easily (Domingo, Marquès, and Rovira Citation2020). An added complication to the situation was the unavailability of the appropriate vaccine for the treatment of the disease (Zhu et al. Citation2020). Since humans are not immune to the novel coronavirus, the effect was seen in the rising number of confirmed cases worldwide (Dansana et al. Citation2020; Priyadarshini et al. Citation2020). This led to worldwide panic and resulted in lockdown restrictions being imposed all over the world (Alvarez, Argente, and Lippi Citation2020). It affected several businesses and industries globally. As the lockdown extended for months, it affected the social life of millions of people. Studies show that since man is a social animal, lockdown restrictions had a psychological impact on the mental wellbeing of people (Cao et al. Citation2020; Zhong, Huang, and Liu Citation2020). Some studies highlighted the use of electronic devices increasing during the lockdown (Wong et al. Citation2020). As the internet offers connectivity (Priyadarshini Citation2018), millions of people relied on the use of internet services to beat psychological distress and boredom (Guessoum et al. Citation2020). An increase in e-commerce is indicative of the same (Hall et al. Citation2020). Social media networks offer the perfect platform for communication and sharing ideas. The lockdown witnessed an increasing activity in the use of social media. Several studies have relied on this information for investigating the state of mind of people. Social media platforms not only propagate posts, messages, advertisements, and facts but also encourage humor to travel across the internet. Internet Memes are defined as concepts or ideas that are usually concerned with humor traveling across the internet (Priyadarshini and Cotton Citation2019; Priyadarshini, Wang, and Cotton Citation2019).
Humor is also one of the popular defense mechanisms used by humans to survive psychological stress (Ostrower, Citation2020). Therefore, it may be thought of as a stress-relieving mechanism used by humans during the lockdown period. Further, humor is also essential for decision-making, wellbeing, emotions, judgments, and psychological systems in humans (Martin Citation2002). Therefore, it is necessary to analyze the spread of humor during these times of distress where humans were put under lockdown and prevented from being social. In this paper, we analyze the Internet Meme Activity during the COVID-19 lockdown period. Several other papers analyze psychological stresses (Pakpour, Griffiths, and Lin Citation2020), sentiments of people (Aslam et al. Citation2020), sexual health (Tang, Gaoshan, and Ahonsi Citation2020), physical activity (Tison et al. Citation2020), use of electronic devices (Munsamy and Chetty Citation2020), etc. during the lockdown period; however, none of the articles in the past have discovered the changes in the Internet Meme activity during the lockdown period. This article is the first of its kind to contemplate internet memes as a defense mechanism and a stress-relieving component of humans for battling with lockdown stress. The study analyzes the dynamics of internet meme behavior from September 2017 to August 2020, which also incorporates lockdown periods (March 2020–June 2020 tentatively). The main contributions of the study are as follows:
In this paper, we study the increase in internet meme activity during the lockdown period over the internet.
We have used RF, MLP, and IL algorithms to explore the changes in Internet Meme activity over the last few years.
Data visualization techniques like Line Graph and Heat Map have also been considered for analysis.
The performance of the models has been evaluated using evaluation parameters like mean absolute error (MAE), root mean squared error (RMSE) & Kappa statistics.
The rest of the paper is organized as follows. Section 2 discusses Materials and Methods in which we highlight the Related Works and the Proposed Work. In section 3, we present the experimental analysis, while in Section 4 we discuss the Results. This section also includes performance evaluation and Comparative Analysis. Finally, Section 5 summarizes the study in the Conclusion and discusses the Future Work.
Material and Methods
In this section, we present the related works as well as our proposed work for the study.
Related Works
Vitiuk et al. Citation2020 identified internet memes as a part of the modern digital culture. The study asserts that internet memes and their variations may be considered a new phenomenon in human public life and a new type of communication. The study explores the grounds which make memes popular and increase in information chaos over the internet may be attributed to the same. (Bury Citation2016) contemplated that internet memes may be used for the purpose of advertisement by tweaking the original templates and adding humorous content to them. Creative memes include interesting phrases and pictures and are often considered by marketers for advertising their products. Likewise (Jung and Jeong Citation2021) suggested using Internet memes for analyzing stock markets and societal moods. This study investigates the sentiment intensity and user engagement as mood variables for analyzing index prices. The internet memes collected from public platforms are used to examine the relationship between societal mood and stock market. Kaltenhauser, Terzimehić, and Butz Citation2021 presented a study on how internet memes can be used to understand humans using human computer interaction (MEMEography). The interactional contexts could be used to study work practices, challenges, emotions pertaining to users. DE SAINT LAURENT, GLĂVEANU, AND LITERAT Citation2021 propounded that memes are associated with psychology and presented a study on Internet memes specific to the COVID-19 pandemic. Internet Memes can represent partial stories, and the study aims to analyze the political narratives associated with coronavirus memes, which are also found to have social and psychological implications.
Venter et al. Citation2020 conducted a study to investigate the air pollution decline during the COVID-19 lockdown phase. A satellite data and network of more than ten thousand air quality stations were used to study the concentration of tropospheric and ground-level air pollution. The effects of meteorological variability have also been taken into account for exploring the decrease in the concentration of nitrogen dioxide, and fine particulate matter. The analysis was conducted on data from January to May for 2017–2020. Results highlighted that the decline in pollution levels may be attributed to reduced economic activity as well as meteorological variability. Aslan Citation2021 asserts that the pandemic witnessed many users generated internet memes substantiating the creativity of users over the internet. The study reports that several memes highlighted pandemic-related content such as daily hygiene and face masks. It also suggests that internet users rely on humor during crisis situations. Norstrom and Sarna Citation2021 presented a study on Internet Memes during lockdown specific to Poland. The study analyzes internet memes as a communication medium for internet users and asserts that internet memes are a form of expression in the digital culture. Many of the memes circulated over the internet were about ‘bans and orders’ due to the imposed restrictions and penalties.
Rossi et al. Citation2020 presented a study on the mental health of people in Italy during three to four weeks of COVID-19 lockdown through a web-based survey from March 27, 2020, to April 06, 2020. A total of 18147 individuals took the survey, which incorporated approximately 80% women. Regression analysis was considered for determining the risk factors of the pandemic. It was reported that many people suffered from depression, perceived stress, post-traumatic stress symptoms, anxiety, and insomnia.
Mandal and Pal Citation2020 analyzed the lockdown effects on the environment, specifically crushing and stone quarrying areas. The factors considered for the exploration are particulate matter, land surface temperature, water quality, noise using an image, and field-derived data before and after the lockdown was imposed. Results manifest that after 18 days, there is a decrease in particulate matter and a reduction in land surface temperature. River water has qualitatively improved and there is a decreased level of pollution in the environment.
He, Pan, and Tanaka Citation2020 reported a study on the short-term impacts of the COVID-19 lockdown in China. The impact was studied concerning Air Quality Index (AQI), and particulate matter. The study demonstrates that within weeks of the lockdown imposition, the pollution levels were brought down. The effects were much more straightforward in colder, richer, and industrialized areas. However, the concentration of particulate matter remained higher than recommended by WHO.
Marelli et al., Citation2020conducted an analysis on the sleep quality of university students and administrative staff during the COVID-19 lockdown. The study was performed for 400 subjects, using a web-based survey, and included monitoring Bedtime hour, Sleep Latency, and Wake-Up time. Results show a decrease in sleep quality and insomnia symptoms. There is a delay in Bedtime and wake-up time for students. Almost a third of the subjects showed depression and anxiety symptoms. Moreover, the impact is seen more in females and students.
Bhuiyan et al. Citation2020; Jayakumar, Brohi, and Zaman Citation2020 investigated the number of suicides in Bangladesh because of lockdown and economic crisis due to COVID-19. A total of eight suicide cases were reported in the study from media reports. The study asserts that COVID-19 lockdown had an impact on the availability and production of food, economy, and jobs which led to an increase in poverty and distress. This may also be associated with the psychological impacts on the poor and unprivileged individuals.
Guessoum et al. Citation2020 presented a study on the effect of COVID-19 lockdown on psychiatric disorders in adolescents. The study was conducted based on literature surveys. The effects analyzed were psychological in the form of trauma, stress, anxiety, and depression. The study also reports additional screen time, decreased physical activity, imbalanced diets, and irregular sleep patterns. An increase in the number of suicide rates was also seen during the lockdown. Addictive disorders have been commonly reported. There is grief associated with the death of loved ones. An increase in internet activity and social media usage is also reported.
Barkur et al., Citation2020 performed a sentiment analysis on Twitter data from India during the COVID-19 lockdown phase. A total of 24000 tweets were gathered between March 25, 2020, to March 28, 2020, for the analysis. The sentiments considered are anger, anticipation, disgust, fear, joy, negative, positive sadness, surprise, and trust. Tweets depicting positive and trust sentiments are dominant while tweets depicting disgust and surprise are less frequent.
Pietrobelli et al. Citation2020 studied the effects of lockdown due to COVID-19 on lifestyle behavior in Italy, especially obesity. A total of 41 obese students participated in the analysis, which monitored diet, activity, and sleep activity for three weeks. Although there was no change in the diet, time spent in sports activities increased and sleep time increased. Thus COVID-19 lockdown had a significant impact on adiposity levels of adults.
Cellini et al. Citation2020; Saeed et al. Citation2021 analyzed the changes in sleep pattern, sense of time, and use of digital media in Italy during COVID-19 lockdown. Data from 1310 participants was used to conduct the study based on a survey. Around 25% of the participants had symptoms of depression, 32% had anxiety, 50% had stress. An increase in the use of digital media by two hours was also reported in the study. Sleep time was affected by people going to bed late and waking up accordingly (late), which also led to lower sleep quality.
Based on the past works, we observe that COVID-19 not only infected millions of people worldwide physically but had a significant effect on the mental health of people. Obesity, lack of sleep, psychological stress, decrease in sports activity, etc. can be attributed to long periods of lockdown. Since vaccines have not proven to be 100% effective, most of the population was observed to have depression, anxiety, and stress. As survival and coping mechanism, internet users got more inclined toward humor and an increased internet activity witnessed humor in the form of Internet memes traveling across platforms to relieve people from stress. We have analyzed the rise in the internet meme activity during lockdown using a set of artificial intelligence techniques discussed in the following section.
Artificial Intelligence Techniques
Machine learning (ML) algorithms provide interesting inferences and forecast the future in a perfect manner that helps in knowing the trend of the near future. Memes are inevitable in people’s lives and have been used to entertain the audience on both intellectual and humorous levels. For analysis purposes, thirty famous memes have been taken into consideration. In this section, we describe three artificial intelligence techniques that we have considered for the study which are as follows:
Random Forest Classifiers: This classifier incorporates several decision trees that work as an ensemble (Priyadarshini and Puri Citation2021; Tuan et al. Citation2019). Individual trees provide class predictions such that the class with the maximum votes becomes the model’s prediction. The underlying idea behind the working of RF classifiers is that several unrelated models that work as a group will overpower any individual models. Uncorrelated models can effectively produce ensemble predictions that carry more accuracy than individual models. Thus, trees protect each other from individual errors. In the case that some trees go wrong, many others will move in the correct direction, thereby increasing the overall performance (Iwendi et al. Citation2020). This ensemble method is based on the divide and conquers approach where individual decision trees are created based on attribute selection indicators. These indicators may be in the form of gain, gain ratio, and Gini index, etc. Each tree relies on an independent random sample. Finally, each tree votes, and the result is given by the most popular class. It is a highly accurate classifier that can guarantee efficiency in large datasets. It is also used to provide an estimate of what variables are important and handles missing data.
Multilayer Perceptron: These are deep artificial neural networks with more than one perceptron (Jha et al., Citation2019a). They are used for identifying patterns in sequential data. The three types of layers that form a part of MLP are the input layer, hidden layer, and output layer (Quek et al. Citation2019). The input layer is responsible for receiving the input signal, while the output layer is responsible for performing prediction and classification. The computational engine of the MLP is determined by the arbitrary number of hidden layers placed between the input layer and the output layer. While the data flow in a forwarding direction from input to output, the neurons follow the backpropagation training procedure. MLPs can effectively approximate continuous functions and solve problems that may be linearly separable. Apart from classification and prediction, MLPs can be used for approximation and recognition.
Instance-based Learning Algorithms: IL or memory-based learning refers to a family of learning algorithms that do not perform explicit generalization but compare new problem instances to training instances already stored in the memory (Aha, Kibler, and Albert Citation1991). Self-organizing maps, k-nearest neighbor, and kernel machines are examples of such algorithms (Patro et al. Citation2020; Jha et al., Citation2019b). These algorithms can create assumptions from training data instances and their time complexity relies on the size of training data. The efficiency of these algorithms can be improvised by introducing the preprocessing phase, which is a data structure that enables efficient usage of run-time modeling of test instances. IL algorithms can adapt to previously unseen data. Thus, a new instance cannot be stored, and an old instance cannot be dropped.
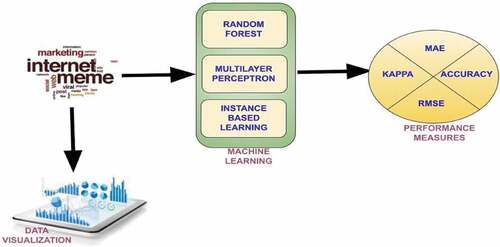
illustrates the overall methodology of the study conducted. Once the dataset is pre-processed, and we have the resulting data to conduct the analysis, we perform data visualization in the form of line graphs and heat maps. The underlying idea is to identify patterns from the data. In this study, we will observe internet meme activity over social media by observing the spikes in the number of internet memes and their captions over time (Vo et al. Citation2020). Following data visualization, we perform classification and prediction using the artificial intelligence techniques discussed in this section, i.e., RF, MLP, and IL algorithms. Once the ML models are built, their efficiency is evaluated using parameters like MAE, RMSE, accuracy, and the kappa statistic.
Figure 1. Overall methodology of the study.
Experimental Analysis
This section comprises three parts. The first part discusses the dataset we used for the study. The second part depicts classification using AI techniques, and the final section uses data visualization techniques for making certain observations.
Dataset
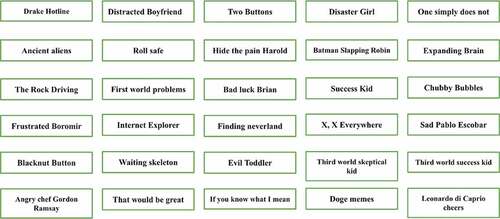
For the study to be conducted we have constructed a dataset of 30 popular memes, some of which are Ancient Alien, Chubby Bubbles, Disaster Girl, Roll Safe, Waiting Skeleton, Evil Toddler, Unlucky Brian, etc. The dataset incorporates a list of these memes and the number of captions these memes had from September 2017 to August 2020 every month. The data has been collected over time from (www.imgflip.com) for specific memes, which is one of the leading websites for creating and sharing images. The idea is that a spike in the number of captions depicts the popularity of the meme during that phase. Specific meme templates over the website have varying numbers of captions throughout the months. We specifically chose popular memes that had data from September 2017 to August 2020 for proper study. A total of 1050 data points are there in the dataset. We are splitting the data into 70% train set and 30% test set for carrying out the experimental analysis. The popular memes that are a part of this dataset are mentioned in .
Figure 2. Popular memes considered for the study.
Data Visualization and Analysis
Analyzing individual Memes
We provide the increase in the popularity of all the thirty memes considered. The graphs in represent the number of captions over time (September 2017- August 2020).
Figure 3. (a-d) Number of Captions over time for Internet Memes (individual graphs)
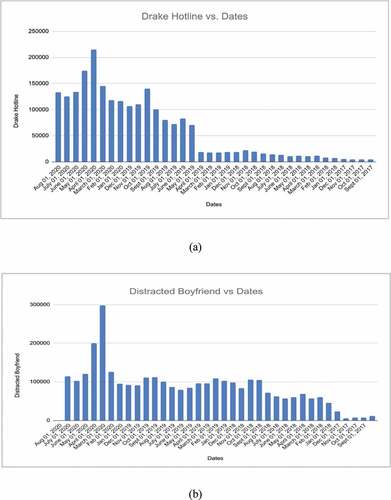
Figure 3. Continued.
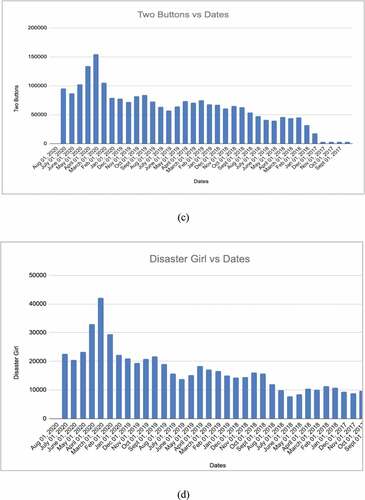
The Internet Meme activity for the listed memes (number of captions over time) is depicted as follows.
We have observed that for individual graphs the increase in the internet meme activity or the number of captions is mostly around (March 2020-May 2020), which is exactly after the lockdown was imposed. Few graphs show an increase in the number of captions over other times as well.
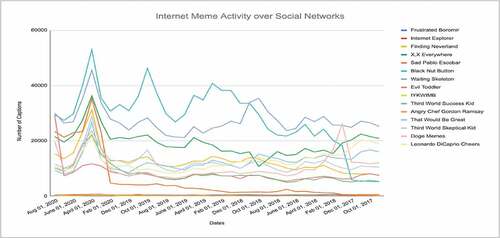
Analyzing Internet Meme activity using Line Plots
We use line plots to depict the Internet Meme activity over social networks in . To promote clarity, we do it in two parts, we take fifteen memes in two different parts and present the line plots accordingly.
Figure 4. Line plots depicting number of captions over time for internet memes.
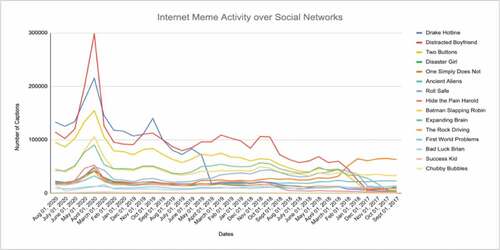
We observe that most peaks are observed during the lockdown phase (March 2020–May 2020) as per . Since there are some memes, that also show slight peaks during other times, there is a need to analyze the overall Internet Meme Activity
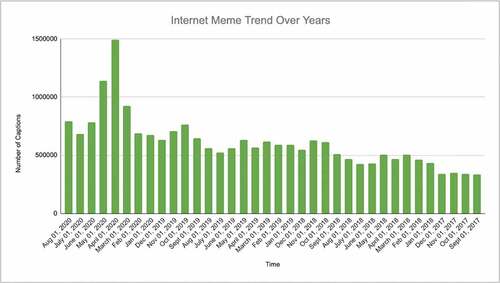
Analyzing the combined number of captions overtime for all the memes listed
Figure 5. Line plots depicting number of captions over time for internet memes.
Combining the number of captions for the 30 memes considered over time, we present the overall Internet Meme Trend over years.
From , it is evident that the maximum Internet meme activity was observed in the months of March 2020–May 2020, which is synchronous with the COVID-19 lockdown.
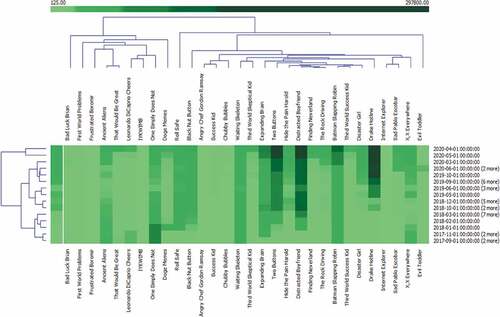
Data Visualization using Heat maps
Figure 6. Overall internet meme trend (September 2017- August 2020).
Heat Map is an effective way of data visualization and depicts the value of the attribute by mapping to the corresponding class It’s commonly used in the biomedical field for analyzing datasets in an explorative manner. illustrate the Heat Map for the internet meme activity in social networks during the COVID-19 lockdown period with k-means 8 and 15 clustering options with row type. Various techniques like distributions, scatter plots, and so on are available for any scale of the dataset. Based on the requirement and nature of data, a particular technique could be utilized.
Figure 7. Heat map with 8 clusters.
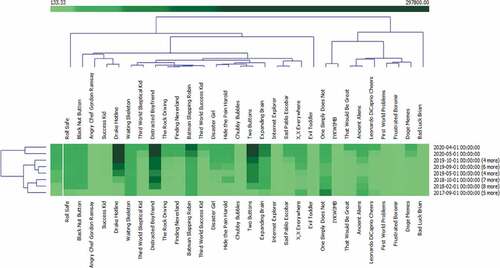
Figure 8. Heat map with 15 clusters.
This was followed by applying the three ML algorithms, i.e., RF, MLP, and IL algorithms. The performance of the models is depicted in the following section.
Results and Discussions
In this section, we present the results and discussions in the form of performance evaluation and comparative analysis.
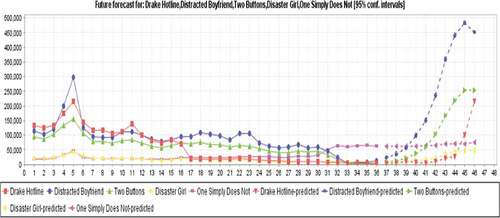
Based on the RF, MLP, and IL classifiers, the forecast is drawn with 95% confidence intervals. illustrate the forecast for 10 days for 5 memes taken on random using RF, IL, and MLP respectively.
Figure 9. RF forecast.
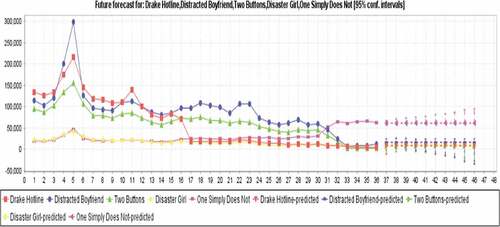
Figure 10. IL forecast.
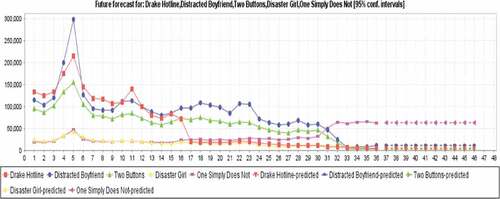
Figure 11. MLP forecast.
Classification Using AI Techniques
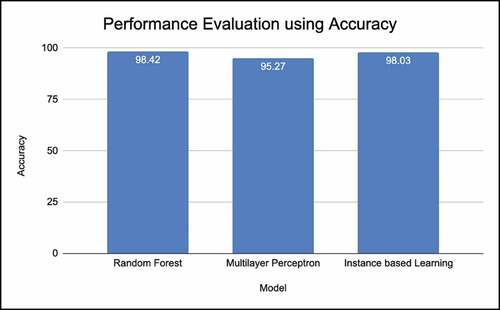
In this study, we have considered the Waikato Environment for Knowledge Analysis (Weka) classifier for performing the classification. The frequency-based classification considers a specific threshold to determine the rise in the internet meme activity. On applying the classifier over the meme’s dataset, the output is graphically shown in , and it indicates that RF and IL classifiers are having classification scores of 98.42% and 98.03%. MLP showed a 95.27% classification accuracy.
Figure 12. Classification accuracy.
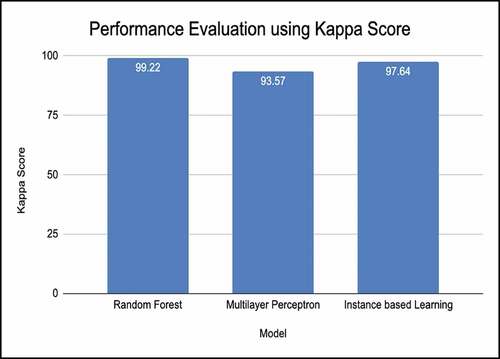
Kappa statistic is the measure that is mapped between observed agreement and expected agreement. It is given as
Where, is the observed agreement and
is the expected agreement.
The ideal value for a perfect agreement is considered as 1 and, in our work, both RF and IL algorithm is revealing a suitable value that measures of the agreement are almost near perfect. Kappa scores for classification are determined automatically by Weka for performing classification. It depicts that internet meme activity could be high (1) during the lockdown and low (0) when the lockdown was not imposed ().
Figure 13. Kappa statistic.
Performance Evaluation Parameters
Mean absolute error (MAE) and Root mean squared error (RMSE) provides insight into the accuracy. Lesser the value higher the classifier accuracy. MAE is a statistical parameter that shows the errors that prevail between paired observations expressing a similar phenomenon. It is a linear score that will weigh in an average way all the individual differences. It is derived as mentioned in Equationequation 2(2)
(2) .
Where, is the prediction
is the true value
m is the total number of records
RMSE is derived from the mean square error and is a quadratic scoring method. It is used in forecasting applications (DhamodharavadhaDhamodharavadhani, Rathipriya, and Chatterjee Citation2020). It is estimated as shown in equation 3.
Where, is the prediction
is the true value
m is the total number of records
Similar to stated earlier measures, MAE and RMSE also show reduced error rates for the RF and IL, and the same is plotted in .
Figure 14. MAE and RMSE plots.
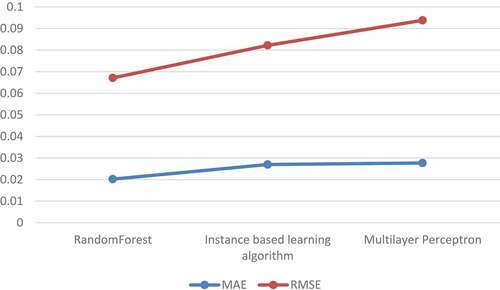
Both the parameters depict error; hence, lesser the error, more is the efficiency of the classifier, hence more accurate classification. A lower error depicts lesser deviation from the predicted value, increasing the overall performance of the classifier (Ramirez, de Campos Velho, and Ferreira Citation2005).
Comparative Analysis
presents the comparative analysis of our work with some previous works. COVID-19 lockdown had a variety of repercussions on the mental wellbeing of individuals. It also led to an increase in the number of suicides and individuals suffering from depression. An increase in internet meme activity is indicative of the positivity spread by people over social media during difficult times. While no past research works have analyzed internet meme activity during the lockdown, there have been other patterns observed like social network activity change, implication on mental health, exercise schedule, social media behavior, etc. depicts some of these works and highlights how our proposed work is novel and more robust than these.
Table 1. Comparative analysis of our work with existing works
Based on the comparative analysis, we observe that our proposed work is indeed robust in terms of novelty, the usage of ML algorithms, and evaluation parameters. Our results show that out of all the ML algorithms considered, the RF model is the most efficient one.
Conclusion and Future Work
Over the last few decades, Internet memes have become immensely popular across various social media platforms. Humor traveling through the internet in the form of internet memes has kept users glued to social media platforms and led to an increase in internet usage among individuals. COVID-19 measures were not only confined to social distancing but also mandated lockdown across the world. The Internet, being the only thing that could connect individuals during such dire circumstances saw an increase in the number of users and online activities. As the number of users over social media increased, there was an increase in the number of internet memes. Since memes incorporate humor, it was adopted as a psychological stress reliever. In this paper, we have attempted to analyze the internet meme activity over the last few years and compared the internet meme activity in general to the COVID-19 lockdown period. We observed that indeed, internet meme activity has increased during the lockdown phase. We have also relied on artificial intelligence techniques like RF, MLP, and IL algorithms to perform classification and prediction. A combination of evaluation parameters like MAE, RMSE, classification accuracy, and kappa statistics reveals that the RF model performs most efficiently. In the future, we would like to identify more such algorithms and propose hybrid AI techniques to analyze internet meme activity. Similarly, other evaluation parameters can also be applied to explore future studies in detail.
The authors would like to acknowledge Taif University Researchers Supporting Project number (TURSP-2020/10) Taif University, Taif, Saudi Arabia.
Acknowledgement
The authors would like to acknowledge Taif University Researchers Supporting Project number (TURSP-2020/10) Taif University, Taif, Saudi Arabia.
Disclosure Statement
No potential conflict of interest was reported by the author(s).
Additional information
Funding
References
- Aha, D. W., D. Kibler, and M. K. Albert. 1991. Instance-based learning algorithms. Machine Learning 6 (1):37–1405. doi:10.1007/BF00153759.
- Alvarez, F. E., D. Argente, and F. Lippi. 2020. A simple planning problem for covid-19 lockdown (No. w26981). National Bureau of Economic Research, Cambridge, MA.
- Aslam, F., T. M. Awan, J. H. Syed, A. Kashif, and M. Parveen. 2020. Sentiments and emotions evoked by news headlines of coronavirus disease (COVID-19) outbreak. Humanities and Social Sciences Communications 7 (1):1–9. doi:10.1057/s41599-020-0523-3.
- Aslan, E. 2021. When the internet Gets ‘Coronafied’: pandemic creativity and humour in internet memes. In: Jones, R. H. (ed.) Viral Discourse. Elements in applied linguistics. Cambridge University Press, Cambridge. ISBN 9781108986465.’
- Barkur, G. V., and G. B. Kamath. 2020. Sentiment analysis of nationwide lockdown due to COVID 19 outbreak: Evidence from India. Asian journal of psychiatry 51, 102089. (Elsevier). https://www.sciencedirect.com/science/article/pii/S1876201820302008?via%3Dihub
- Bhatti, A., H. Akram, H. M. Basit, A. U. Khan, S. M. Raza, and M. B. Naqvi. 2020. E-commerce trends during COVID-19 Pandemic. International Journal of Future Generation Communication and Networking 13 (2):1449–52.
- Bhuiyan, A. I., N. Sakib, A. H. Pakpour, M. D. Griffiths, and M. A. Mamun. 2020. COVID-19-related suicides in Bangladesh due to lockdown and economic factors: Case study evidence from media reports. International Journal of Mental Health and Addiction, 19, 2110–2115. https://doi.org/10.1007/s11469-020-00307-y
- Bury, B. 2016. Creative use of internet memes in advertising, 57. World Scientific News. http://www.worldscientificnews.com/wp-content/uploads/2016/06/WSN-57-2016-33-41.pdf
- Candela, M., V. Luconi, and A. Vecchio. 2020. Impact of the COVID-19 pandemic on the Internet latency: A large-scale study. Computer Networks 182:107495. doi:10.1016/j.comnet.2020.107495.
- Cao, W., Z. Fang, G. Hou, M. Han, X. Xu, J. Dong, and J. Zheng. 2020. The psychological impact of the COVID-19 epidemic on college students in China, 287, 112934. Psychiatry Research. https://www.sciencedirect.com/science/article/pii/S0165178120305400?via%3Dihub
- Cellini, N., N. Canale, G. Mioni, and S. Costa. 2020. Changes in sleep pattern, sense of time, and digital media use during COVID‐19 lockdown in Italy. Journal of Sleep Research 29 (4):e13074. doi:10.1111/jsr.13074.
- Colley, R. C., T. Bushnik, and K. Langlois. 2020. Exercise and screen time during the COVID-19 pandemic. Health Rep 31 (6):3–11.
- Cucinotta, D., and M. Vanelli. 2020. WHO declares COVID-19 a pandemic? Acta Bio Medica: Atenei Parmensis 91 (1):157. doi:10.23750/abm.v91i1.9397.
- Dansana, D., R. Kumar, J. D. Adhikari, M. Mohapatra, R. Sharma, I. Priyadarshini, and D. N. Le. 2020. Global forecasting confirmed and fatal cases of COVID-19 outbreak using autoregressive integrated moving average model, 8. Frontiers in Public Health. https://www.frontiersin.org/articles/10.3389/fpubh.2020.580327/full
- de Saint Laurent, C., V. P. Glăveanu, and I. Literat. 2021. Internet memes as partial stories: Identifying political narratives in coronavirus memes. Social Media+ Society 7 (1):2056305121988932.
- Dhamodharavadhani, S., R. Rathipriya, and J. M. Chatterjee. 2020. Covid-19 mortality rate prediction for India using statistical neural network models, 8. Frontiers in Public Health.
- Domingo, J. L., M. Marquès, and J. Rovira. 2020. Influence of airborne transmission of SARS-CoV-2 on COVID-19 pandemic, In A review Environmental Research, 109861. https://www.sciencedirect.com/science/article/pii/S0013935120307568?via%3Dihub
- Elmer, T., K. Mepham, and C. Stadtfeld. 2020. Students under lockdown: Comparisons of students’ social networks and mental health before and during the COVID-19 crisis in Switzerland. PloS One 15 (7):e0236337. doi:10.1371/journal.pone.0236337.
- Feldmann, A., O. Gasser, F. Lichtblau, E. Pujol, I. Poese, C. Dietzel, … G. Smaragdakis. 2021a. March. Implications of the COVID-19 Pandemic on the Internet Traffic. In Broadband Coverage in Germany; 15th ITG-Symposium. VDE, 1–5, Germany.
- Feldmann, A., O. Gasser, F. Lichtblau, E. Pujol, I. Poese, C. Dietzel, G. Smaragdakis, M. Wichtlhuber, J. Tapiador, and N. Vallina-Rodriguez. 2021b. A year in lockdown: How the waves of COVID-19 impact internet traffic. Communications of the ACM 64 (7):101–08. doi:10.1145/3465212.
- Guessoum, S. B., J. Lachal, R. Radjack, E. Carretier, S. Minassian, L. Benoit, and M. R. Moro. 2020. Adolescent psychiatric disorders during the COVID-19 pandemic and lockdown. Psychiatry Research 291:113264. doi:10.1016/j.psychres.2020.113264.
- Hall, M. C., G. Prayag, P. Fieger, and D. Dyason. 2020. Beyond panic buying: Consumption displacement and COVID-19. Journal of Service Management.
- He, G., Y. Pan, and T. Tanaka. 2020. The short-term impacts of COVID-19 lockdown on urban air pollution in China. Nature Sustainability 3 (12):1005–11. doi:10.1038/s41893-020-0581-y.
- Iwendi, C., A. K. Bashir, A. Peshkar, R. Sujatha, J. M. Chatterjee, S. Pasupuleti, O. Jo, S. Pillai, and O. Jo. 2020. COVID-19 patient health prediction using boosted random forest algorithm. Frontiers in Public Health 8:357. doi:10.3389/fpubh.2020.00357.
- Jayakumar, P., S. N. Brohi, and N. Zaman. 2020. Top 7 lessons learned from COVID-19 pandemic. https://www.techrxiv.org/articles/preprint/Top_7_Lessons_Learned_from_COVID-19_Pandemic/12264722
- Jha, S., R. Kumar, F. Chiclana, V. Puri, and I. Priyadarshini. 2019b. Neutrosophic approach for enhancing the quality of signals, 1–32. Multimedia Tools and Applications.
- Jha, S., R. Kumar, M. Abdel-Basset, I. Priyadarshini, R. Sharma, and H. V. Long. 2019a. Deep learning approach for software maintainability metrics prediction. IEEE Access 7:61840–55. doi:10.1109/ACCESS.2019.2913349.
- Jung, S. H., and Y. J. Jeong. 2021. Examining stock markets and societal mood using Internet memes. Journal of Behavioral and Experimental Finance 32:100575. doi:10.1016/j.jbef.2021.100575.
- Kaltenhauser, A., N. Terzimehić, and A. Butz (2021, May). MEMEography: Understanding Users Through Internet Memes. In Extended Abstracts of the 2021 CHI Conference on Human Factors in Computing Systems (pp. 1–7), Yokohama Japan.
- Kochhar, A. S., R. Bhasin, G. K. Kochhar, H. Dadlani, V. V. Mehta, R. Kaur, and C. K. Bhasin. 2020. Lockdown of 1.3 billion people in India during Covid-19 pandemic: A survey of its impact on mental health. Asian Journal of Psychiatry 54:102213. doi:10.1016/j.ajp.2020.102213.
- Mandal, I., and S. Pal. 2020. COVID-19 pandemic persuaded lockdown effects on environment over stone quarrying and crushing areas. The Science of the Total Environment 732:139281. doi:10.1016/j.scitotenv.2020.139281.
- Marelli, S., A. Castelnuovo, A. Somma, V. Castronovo, S. Mombelli, D. Bottoni, L. Ferini-Strambi, A. Fossati, and L. Ferini-Strambi. 2021. Impact of COVID-19 lockdown on sleep quality in university students and administration staff. Journal of Neurology 268 (1):8–15. doi:10.1007/s00415-020-10056-6.
- Martin, R. A. 2002. Is laughter the best medicine? Humor, laughter, and physical health. Current Directions in Psychological Science 11 (6):216–20. doi:10.1111/1467-8721.00204.
- Munsamy, A. J., and V. Chetty. 2020. Digital eye syndrome: COVID-19 lockdown side-effect? South African Medical Journal 110 (7):7. doi:10.7196/SAMJ.2020.v110i7.14906.
- Ni, M. Y., L. Yang, C. M. Leung, N. Li, X. I. Yao, Y. Wang, … Q. Liao. 2020. Mental health, risk factors, and social media use during the COVID-19 epidemic and cordon sanitaire among the community and health professionals in Wuhan, China: Cross-sectional survey. JMIR Mental Health 7 (5):e19009. doi:10.2196/19009.
- Norstrom, R., and P. Sarna. 2021. Internet memes in Covid-19 lockdown times in Poland. Comunicar 29 (67):67. doi:10.3916/C67-2021-06.
- Ostrower, C. 2000. Humor as a defense mechanism in the Holocaust. Tel-Aviv University Ph.D. thesis.
- Pakpour, A. H., M. D. Griffiths, and C. Y. Lin. 2020. Assessing psychological response to the COVID-19: The fear of COVID-19 Scale and the COVID Stress Scales. International Journal of Mental Health and Addiction, 19, 2407–2410. https://doi.org/10.1007/s11469-020-00334-9.
- Patro, S. G. K., B. K. Mishra, S. K. Panda, R. Kumar, H. V. Long, D. Taniar, and I. Priyadarshini. 2020. A Hybrid Action-Related K-Nearest Neighbour (HAR-KNN) Approach for Recommendation Systems. IEEE Access 8:90978–91. doi:10.1109/ACCESS.2020.2994056.
- Phelan, A. L., R. Katz, and L. O. Gostin. 2020. The novel coronavirus originating in Wuhan, China: Challenges for global health governance. Jama 323 (8):709–10. doi:10.1001/jama.2020.1097.
- Pietrobelli, A., L. Pecoraro, A. Ferruzzi, M. Heo, M. Faith, T. Zoller, … S. B. Heymsfield. 2020. Effects of COVID‐19 lockdown on lifestyle behaviors in children with obesity living in Verona. Italy: a longitudinal study. Obesity.
- Priyadarshini, I., and C. Cotton 2019, October. Internet Memes: A Novel Approach to Distinguish Humans and Bots for Authentication. In Proceedings of the Future Technologies Conference, San Francisco, USA on October 24–25, 2019, (pp. 204–22). Springer, Cham.
- Priyadarshini, I., H. Wang, and C. Cotton 2019, October. Some Cyberpsychology Techniques to Distinguish Humans and Bots for Authentication. In Proceedings of the Future Technologies Conference (pp. 306–23). Springer, Cham.
- Priyadarshini, I., P. Mohanty, R. Kumar, L. H. Son, H. T. M. Chau, V. H. Nhu, P. T. Ngo, and D. Tien Bui. 2020. June. Analysis of Outbreak and Global Impacts of the COVID-19. In Healthcare. vol. 8, No. 2 148.Multidisciplinary Digital Publishing Institute.
- Priyadarshini, I., and V. Puri. 2021. A convolutional neural network (CNN) based ensemble model for exoplanet detection. In Earth Science Informatics, Springer, 1–13.
- Priyadarshini, I. 2018. Features and architecture of the modern cyber range: A qualitative analysis and survey. Doctoral dissertation, University of Delaware, USA.
- Quek, S. G., G. Selvachandran, M. Munir, T. Mahmood, K. Ullah, L. H. Son, P. T. Thong, R. Kumar, and I. Priyadarshini. 2019. Multi-attribute multi-perception decision-making based on generalized T-spherical fuzzy weighted aggregation operators on neutrosophic sets. Mathematics 7 (9):780. doi:10.3390/math7090780.
- Ramirez, M. C. V., H. F. de Campos Velho, and N. J. Ferreira. 2005. Artificial neural network technique for rainfall forecasting applied to the Sao Paulo region. Journal of Hydrology 301 (1–4):146–62. doi:10.1016/j.jhydrol.2004.06.028.
- Rossi, R., V. Socci, D. Talevi, S. Mensi, C. Niolu, F. Pacitti, A. Di Marco, A. Rossi, A. Siracusano, and G. Di Lorenzo. 2020. COVID-19 Pandemic and Lockdown Measures Impact on Mental Health Among the General Population in Italy. Frontiers in Psychiatry 11:790. doi:10.3389/fpsyt.2020.00790.
- Saeed, S., N. Z. Jhanjhi, M. Naqvi, M. Humayun, and V. Ponnusamy (2021). Quantitative analysis of COVID-19 patients: A preliminary statistical result of deep learning artificial intelligence framework. In ICT Solutions for Improving Smart Communities in Asia (pp. 218–42). IGI Global.
- Singh, V., S. Singh, A. Biswal, A. P. Kesarkar, S. Mor, and K. Ravindra. 2020. Diurnal and temporal changes in air pollution during COVID-19 strict lockdown over different regions of India, 115368. Environmental Pollution.
- Sujath, R., J. M. Chatterjee, and A. E. Hassanien. 2020. A machine learning forecasting model for COVID-19 pandemic in India. Stochastic Environmental Research and Risk Assessment 34:959–72.
- Tang, K., J. Gaoshan, and B. Ahonsi. 2020. Sexual and reproductive health (SRH): A key issue in the emergency response to the coronavirus disease (COVID-19) outbreak. Reproductive Health 17:1–3. doi:10.1186/s12978-019-0847-x.
- Thakur, V., and A. Jain. 2020. COVID 2019-suicides: A global psychological pandemic. Brain, behavior, and immunity. https://www.sciencedirect.com/science/article/pii/S0889159120306437?via%3Dihub
- Tison, G. H., R. Avram, P. Kuhar, S. Abreau, G. M. Marcus, M. J. Pletcher, and J. E. Olgin. 2020. Worldwide effect of COVID-19 on physical activity: A descriptive study. Annals of Internal Medicine.
- Tuan, T. A., H. V. Long, R. Kumar, I. Priyadarshini, and N. T. K. Son. 2019. Performance evaluation of Botnet DDoS attack detection using machine learning, 1–12. Evolutionary Intelligence.
- Venter, Z. S., K. Aunan, S. Chowdhury, and J. Lelieveld. 2020. COVID-19 lockdowns cause global air pollution declines. Proceedings of the National Academy of Sciences 117 (32):18984–90. doi:10.1073/pnas.2006853117.
- Vitiuk, I., O. Polishchuk, N. Kovtun, and F. E. D. Volodymyr. 2020. Memes as the phenomenon of modern digital culture. Wisdom 15 (2):45–55. doi:10.24234/wisdom.v15i2.361.
- Vo, T., R. Sharma, R. Kumar, L. H. Son, B. T. Pham, D. Tien Bui, I. Priyadarshini, S. Manash, and T. Le. 2020. Crime rate detection using social media of different crime locations and Twitter part-of-speech tagger with Brown clustering. Journal of Intelligent & Fuzzy Systems. (Preprint), 38(4), 4287-4299.
- Wong, C. W., T. S. A. I. Andrew, J. B. Jonas, K. Ohno-Matsui, C. H. E. N. James, A. N. G. Marcus, and D. S. W. Ting. 2020. Digital Screen Time During COVID-19 Pandemic: Risk for a Further Myopia Boom? American Journal of Ophthalmology.
- Zhong, B., Y. Huang, and Q. Liu. 2020. Mental health toll from the coronavirus: Social media usage reveals Wuhan residents’ depression and secondary trauma in the COVID-19 outbreak, 106524. Computers in human behavior.
- Zhu, F. C., Y. H. Li, X. H. Guan, L. H. Hou, W. J. Wang, J. X. Li, W. Chen, B.-S. Wang, Z. Wang, and L. Wang. 2020. Safety, tolerability, and immunogenicity of a recombinant adenovirus type-5 vectored COVID-19 vaccine: A dose-escalation, open-label, non-randomized, first-in-human trial. The Lancet 395 (10240):1845–54. doi:10.1016/S0140-6736(20)31208-3.