
 ?Mathematical formulae have been encoded as MathML and are displayed in this HTML version using MathJax in order to improve their display. Uncheck the box to turn MathJax off. This feature requires Javascript. Click on a formula to zoom.
ABSTRACT
Cancer is a complex worldwide health concern that resulted in 10 million cancer deaths in 2018; hence, early cancer detection is crucial. Early detection involves developing more precise technology that offers information about the patient’s cancer, allowing clinicians to make better-informed treatment options. This study provides an in-depth analysis of multiple cancers. This study also exhibits a good survey of the machine or deep learning techniques used in cancer research. Also, the study proposed a stacking-based multi-neural ensemble learning method’s prediction performance on eight datasets, including the benchmark datasets like Wisconsin Breast cancer dataset, mesothelioma, cervical cancer, non-small cell lung cancer survival dataset, and prostate cancer dataset. This study also analyzes the three real-time cancer datasets (Lung, Ovarian & Leukemia) of the Jammu and Kashmir region. The simulation findings indicate that the methodology described in our study attained the highest level of prediction accuracy across all types of cancer data sets. Additionally, the proposed approach has been statistically validated. The purpose of this investigation was to develop and evaluate a prediction model that might be used as a biomarker for malignancy based on anthropometric, clinical, imaging, and gene data.
Introduction
Cancer is a deadly issue responsible for most deaths worldwide that rise with an estimate of 18.1 million new cancer cases each year (Ferlay Citation2018). The study’s motivation is the alarming rate at which new cancer cases increase (Islami et al. Citation2018). According to the World Health Organization’s most recent data, 10 million cancer deaths occurred in 2020 alone, and millions of new incidences are recognized each year. summarizes the study’s statistical findings on the tumors examined (Bray, Ferlay, and Soerjomataram Citation2020).
Table 1. Cancer deaths in the world (2018)
Lung malignant growth is the most widely recognized cancer, i.e., 11.6% of the total cases on the planet. Regardless of advances in chemotherapy, the forecast for malignant lung growth stays poor, with 5-year relative endurance fewer than 14% among men and approximately 18% among females in most countries (Bray, Ferlay, and Soerjomataram Citation2020). Tobacco use and impacts of cigarette smoking is the chief risk factor for malignant lung growth (Cruz, Tanoue, and Matthay Citation2011). Breast Cancer is the second most threatening cancer in the world. It has a high incidence and mortality rate (Key, Verkasalo, and Banks Citation2001). According to the latest cancer statistics mentioned in , Breast malignancy alone accounts for the majority of cancer deaths worldwide (Ferlay Citation2018). Ovarian Cancer (OC) is the seventh most generally analyzed malignant growth among ladies on the planet (3% of women died). OC is ordinarily detected at a late stage when the 5-year relative endurance rate is just 29%. Hardly any cases (15%) are determined to have restricted tumors (Stage 1) when the 5-year endurance rate is 92%. Strikingly, the general endurance rate for most cases runs between 30% and 40% over the globe and has seen increments (2%–4%) since 1995 (Allemani et al. Citation2014; Torre et al. Citation2018). OC risk factors incorporate natural and way of life factors, for example, asbestos and powder exposures and cigarette smoking (Reid, De Klerk, and Bill Musk Citation2011).
In 2018, 4.5% of people died of leukemia. As indicated by the review case surveys of leukemia, typical signs and side effects incorporate fever (17% to 77%), dormancy (12% to 39%), and dying (10% to 45%) (B. M. Reid, Permuth, and Sellers Citation2017). Around 33% of youngsters had musculoskeletal manifestations, especially in the spine and long bones, 75% had an expanded liver or spleen, in roughly 7% of kids at finding (Sinigaglia et al. Citation2008). Leukemia survivors require sequential complete blood record checking, just as age-and sex-explicit malignancy screening (Shouval et al. Citation2019). Grown-ups additionally present with protected side effects, for example, fever, tiredness, and weight reduction. They may have experienced shortness of breath, chest irritation, unreasonable wounding, nosebleeds, or abnormal menstrual periods in ladies (Cornell and Palmer Citation2012).
Early discovery of malignancy guarantees a unique possibility of expanding survivability of malignant growth patients (B. M. Reid, Permuth, and Sellers Citation2017). Various models dependent on clinical information are proposed in the prior studies and might be employed in emergency clinics or clinical investigation. These automated systems are noteworthy as these add to the more screening instruments (Breiman Citation2001; Wolpert Citation1992; Yoav and Schapire Citation1996). This study plans to assess how models grounded on the anthropometric, clinical, image, and gene information can help forecast various types of cancer (Wei et al. Citation2022; Coccia Citation2017; Chen et al. Citation2021; Korte et al. Citation2020; Coccia Citation2016). The learning architecture proposed in the current study depends on the predominance of neural systems and emphasizes the importance of automated learning for further development (Cho and Won Citation2003; Coccia Citation2019; Coccia and Bellitto Citation2018; Kourou et al. Citation2015a; Tan and Gilbert Citation2003; Xiao et al. Citation2018) and ensemble methods (Kavakiotis et al. Citation2016) in earlier investigations (Adem, Kiliçarslan, and Cömert Citation2019; Bourlard and Kamp Citation1988; Hu and Zebo Citation2019; Kononenko Citation2001; Lecun, Bengio, and Hinton Citation2015; Levine et al. Citation2019; Masters Citation1993). The study’s purpose is to develop a revolutionary classification algorithm capable of accurately predicting cancer diagnosis. The significant contributions made by the study are as follows:
The study proposed a firsthand approach to the ensemble (stack) multiple deep learning models with a gradient-boosting technique named stacking-based multi-neural ensemble to classify cancer datasets to predict cancer diagnosis, stage, and survival time.
This study has focused on the limitations of previous studies, thereby presenting an improved approach.
Three real-time cancer datasets (Lung, Ovarian & Leukemia) are collected from the Jammu & Kashmir region.
The proposed model is tested on five benchmark datasets: the Wisconsin Breast cancer dataset, Mesothelioma, Cervical cancer dataset, non-small cell lung cancer (NSCLC) survival dataset, and prostate cancer dataset.
The performance of the proposed models is compared with previous studies, and the proposed model, i.e., stacking-based multi-neural ensemble, attained better prediction results than all the previous studies.
All the implementation details of the established Prediction Model are accessible on Github to facilitate the model’s reusability by other researchers.
Medical data can now be found in multiple public and private data repositories, thanks to advances in database technology and the Internet. The healthcare industry is anticipated to create terabytes of data each year. Extracting valuable information for excellent healthcare is a difficult and vital task, and we now have many data in our databases to do so. However, the amount of information gleaned from it is minuscule. As a result, effective data organization, analysis, and interpretation are critical if tangible knowledge extraction is accomplished. In order to identify relevant patterns and hidden knowledge from these enormous datasets of medical data, multiple computational techniques are necessary. We often analyze massive and large observational datasets in the data mining process and then extract important hidden patterns for data classification. The automated learning techniques have now begun to experiment with clinical data.
In this study, we have assessed the proposed strategy on eight datasets. Two datasets are extricated from digitized images, three real-time cancer datasets, two electronic health records databases comprising clinical properties, and datasets dependent on gene expressions and clinical information. From a vast collection of literature in malignancy prediction modeling, deep learning approaches have signified their vastness effectively and accomplished incredible outcomes; however, none of the systems is entirely exact. The conclusive results of our study confirm that the proposed stacking-based multi-neural ensemble learning strategy utilizes the cancer patient’s data and produces more precise expectations than single classifiers. The remaining article is grouped into seven sections. Section 2 describes the review of related research studies and prediction models. Section 3 describes the proposed methodology employed in the current study along with the dataset analysis. Section 5 shows the simulation results and their discussion. Finally, the article is concluded in the last section.
Theoretical Framework
Several research works have been done in the field of cancer detection (Coccia Citation2019; Korbar et al. Citation2021; Deshmukh and Kashyap Citation2022; Zhang et al. Citation2022; Gupta M.; Kumar et al. Citation2021; Kohli et al. Citation2021; Kumar Citation2020; Gupta and Gupta Citation2021). Many researchers have used automated learning techniques for the prediction of cancer (Gupta and Gupta Citation2021; Kumar et al. Citation2020; Kumar and Mahajan Citation2019; Kumar and Single, Citation2021). Few such studies are mentioned in this section.
Lung Cancer: In 2017, Lynch (Lynch et al. Citation2017) led an examination work to anticipate malignant lung growth utilizing unsupervised learning and achieved Root Mean Square Error (RMSE) values (16.193 for k-Means). This study used approximately 10.4k lung cancer records from the Surveillance, Epidemiology, and End Results (SEER) program database. Also, some researchers have assessed the endurance period of lung cancer patients by examining data mining approaches on the lung cancer records from the SEER database, containing collaborative clustering-based techniques (D. Chen et al. Citation2009), Support Vector Machine (SVM), and Logistic Regression (LR) (Fradkin, Muchnik, and Schneider Citation2005), and unsupervised methods in 2017 (Lynch et al. Citation2017). A similar study was proposed in 2017 (Lynch et al. Citation2017) that examined the supervised classification models to predict lung cancer survival. The classification models employed in the study are Decision Trees (DTs), Gradient Boosting Machines (GBM), SVM & Ensemble model. The best results were achieved using the Ensemble model (RMSE = 15.3). This investigation established the superiority of ensemble learning over single classifiers. Yen-Chen (Y. Chen, Ke, and Chiu Citation2014) 2014 utilized Artificial Neural Network (ANN), to foresee the survival of Lung cancer patients with risk classification. The gene expression dataset used in the examination was gathered from different research centers. This examination accomplished a precision of 83%.
Breast Cancer: Another study performed in 2017 Kumar, Sai Nikhil, and Sumangali Citation2017) used the Wisconsin breast cancer dataset and investigated the performance of DTs, K-Nearest Neighbors (KNN), and Neural Networks (NN) for predicting breast cancer. A reexamining study conducted by Xiao in 2018 (Xiao et al. Citation2018) employed an ensemble classifier to predict breast cancer diagnosis. Xiao compared multiple-ensemble techniques and concluded the superior performance of stacking various classifiers. A research study published in 2019 (Saygili Citation2019) employed different machine-learning techniques to diagnose breast cancer. The best classification accurateness was attained by Random Forests (RF), followed by the neural technique. Many of the recent research works have employed deep learning strategies (Gupta and Gupta Citation2021) on big-size breast cancer datasets.
Prostate Cancer: A research article published in 2017 (Liu and Xiaomei Citation2017) employed deep-learning models to classify prostate cancer to predict cancer diagnosis. The accurateness achieved by the Convolutional Neural Networks (CNN) model is 78% (approx.). In another research work carried in 2019 (Yoo et al. Citation2019), a novel model based on CNN was applied for prostate cancer diagnosis. The data used in the study consisted of 427 patients, where 175 were cases, and 252 were controls. The recommended model attained an area under the receiver operating characteristic curve (AUC) of 0.87. A computation model based on deep learning was projected in 2020 (Tolkach et al. Citation2020) to predict prostate cancer. Classification precision of the deep learning architecture reaches 98%. Another research study in 2020 (Gupta and Gupta Citation2020) proposed an automatic diagnosis of prostate cancer. This study evaluated multiple Classification models like KNN, Naïve Bayes (NB), SVM, DT, and the best performance was achieved by neural learning models. Also, computer simulations demonstrate that the data balancing strategy increased predictive performance from 84% to 93% with balanced data. Recent research (Gupta and Gupta Citation2021) proposed multiple-balancing techniques for attaining high accurateness. Many of the research studies done to predict the prostate cancer diagnosis has successfully shown the importance of computer-aided diagnosis.
Cervical cancer: Cervical cancer was diagnosed using automated learning methodologies (Wu and Zhou Citation2017). The technique based on Support Vector Machine (SVM) was used for classification along with Principal Component Analysis (PCA) and Recursive Feature Elimination (RFE) techniques. SVM-PCA, SVM-RFE with different feature sets was proposed in the study, and SVM-PCA displayed the best performances attaining the highest classification score (93%). Another study carried in 2017 (Ceylan and Pekel Citation2017) proposed multiple-classification models to predict the risk of cervical cancer and compared the Bayesian model, DTs, and RF. RF achieved the highest accurateness, i.e., 82% (approx.). Cervical cancer was diagnosed using the proposed strategy of balancing the data with Smote and used PCA for dimension reduction in 2018(Abdoh, Rizka, and Maghraby Citation2018). The technique was compared with the feature set selected by the RFE technique. The proposed design achieved 97.4% accuracy. Cervical cancer diagnosis was done using stacked Autoencoders and softmax classification in 2019 (Fernandes, Chicco, and Cardoso Citation2018) and achieved a top AUC score of 97.25%. Also, recent research by (Gupta and Kumar Gupta, Citation2021b) investigated the performance of stacking ensemble of different classifiers on cervical cancer dataset.
Leukemia: In 2018, a research study (Mei et al. Citation2018) applied neural Learning to predict acute myeloid leukemia (AML). The dataset used in the study was taken from TCGA (The Cancer Genome Atlas) database. The implementation used stacked Autoencoders to formulate a categorized DL model. The model implemented in R language attained exceptional correctness of 83% in forecasting prognosis. A review article published in 2019 (Salah et al. Citation2019) emphasized the utilization of ML models to predict leukemia diagnosis. A total of 58 research studies were revised. A significant factor observed in this study was that none of the articles applied ML models in real‐world scenarios. More than 90% of articles utilized small and homogenous samples. A research study was done in 2019 (Shouval et al. Citation2019) worked on predicting the survival of leukemia patients after the Autologous Stem Cell Transplantation. A recent research study 2020 (Maria, Devi, and Ravi Citation2020) employed ML to predict diagnosis. The respective research presented a comparative study of SVM, KNN, Neural Networks, and NB for the classification of leukemia into its subtypes.
Ovarian Cancer: (Miao et al. Citation2018) used deep CNN for predicting the diagnosis of ovarian cancers. The 10-folder cross-validation validated simulation results. Also, classification accurateness improved from 72.76% to 78.20% by using the strategy proposed in the study. Another study conducted in 2019 (Kawakami et al. Citation2019) used 334 epithelial ovarian cancer (EOC) cases, out of which 101 cases belonged to the benign group, and the rest belonged to the malignant group. ML models comprising Gradient Boosting Machine (GBM), SVM, RF, NB, and Neural Network were used. The ensemble technique (GBM & RF) presented the top prediction performance of 92.4% AUC. A recent study 2020 (Mingyang et al. Citation2020) aimed to access the practical value of ML models in OC detection. The data comprised 349 patients with 49 features. The study established notable features. The learner produced a better forecast and outperformed the prevailing OC prediction approaches.
Mesothelioma: Research work (Mukherjee Citation2018) on the same feature set and attained 99% with SVM. The study made by Ilhan and Celik (Ilhan and Celik Citation2017) deployed Ensemble Learning with 10-fold Cross-validation and successfully achieved 100% accuracy in classification. Also, recent research (Gupta and Kumar Gupta, Citation2021a) explores the performance of multiple classifiers on the dataset. The research work (Kaur and Singh Citation2019) used K-NN and claimed 99.07% accuracy. A retrospective study (Hu and Zebo Citation2019) trained numerous deep learning algorithms and confirmed stacked sparse auto-encoder (SSAE) as the best model for MM diagnosis. Two feature selection methods, i.e., Genetic Algorithm (GA) and ReliefF methods, were used to select the features. Genetic Algorithms (GA) chose a set of 19 highly significant features and confirmed that GA and Stacked Sparse Autoencoder (SSAE) achieved the highest attainable accuracy (100%). All the above-stated studies claimed high accuracies but, after examination, we observed that an input feature (“diagnosis method”) used in the model duplicated the target diagnosis class, confirmed by (Chicco and Rovelli Citation2019). This trivial feature makes the model virtually perfect yielding high estimation accuracy. Hence, we don’t advocate their results as it violates the fundamentals and can’t be considered. Recent work done by (Chicco and Rovelli Citation2019) on the same dataset confirmed that the accuracy stated by (Orhan et al. Citation2012) was trivial, and Probabilistic Neural Network (PNN) could not perform well, obtaining an accuracy of 0.52. Their study made the first move to address the repetitive feature in the dataset. Also, they handled the imbalance problem of the data by using the under-sampling technique. The highest accuracy was 0.82 and was recorded using Random Forest Classifier on the balanced set. Under-sampling established its effectiveness to upgrade the prediction results, even though it imposes the constraint of omitting a portion of valuable data. summarizes the literature review of the cancer research studies.
Table 2. Analysis table
Proposed System
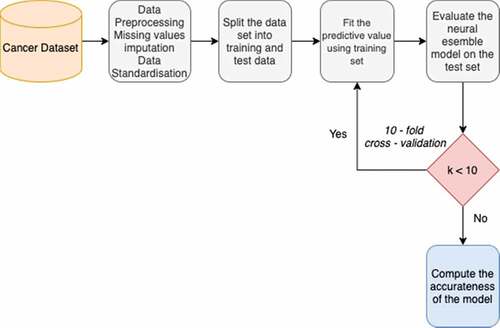
This section holds the flowchart of the cancer prediction procedure, algorithm of the proposed classification model, description of the hyperparameters used, and the proposed architecture. Missing value imputations are done using k-Nearest Neighbors (“An Introduction to Kernel and Nearest Neighbor Nonparametric Regression” Citation1992) (k-NN) imputation methods. Next, data is transformed using data scalar procedures. K-fold (K = 10) Cross-Validation (CV) approach was adopted, wherein MLP models were built on a training set and assessed on a test set. The training set corresponded to 75% of the total amount of data. depicts the proposed workflow.
Figure 1. Proposed workflow.
Data Analysis
This section provides the description of the datasets that have been explored in this research. The eight datasets used in the study fall under the category of clinical databases, real-time databases, gene expression-based databases, and digitized datasets.
Clinical Databases
Cervical cancer and mesothelioma cancer clinical datasets utilized in this study are authentic electronic health records of patients. They are freely available on the UCI Machine Learning Repository (University of California, Irvine).
Cervical Cancer Dataset (Fernandes, Cardoso, and Fernandes Citation2017): An aggregate of eight hundred fifty-eight cases depicting records of patients were diagnosed and tested. There are four target factors, specifically “biopsy,” “schiller,” “Hinselmann,” and “citology.” In the dataset, all occurrences exclusively have 32 features with multivariate factors by the direction provided by clinical experts; these are more viable than other element subsets. A considerable lot of the examples have “obscure” or “missing qualities.” The four target variables are decision-makers.
Mesothelioma (Orhan et al. Citation2012): The dataset utilized right now is a genuine electronic health record of patients. The dataset overseers (Orhan et al. Citation2012) gave the principal examination of this dataset in 2011 and distributed the dataset openly in 2016. An aggregate of Three hundred and twenty-four (324) examples portraying records of patients was analyzed and tested. In the dataset, all cases independently have 35 columns, i.e., features. One of the dataset features named “diagnosis method” is replicating the target variable “class of diagnosis.” Henceforth, we exclude this feature from further analysis to improve the reliability of the study.
Real-Time Datasets
Three real-time cancer datasets, i.e., ovarian cancer, lung cancer, and leukemia dataset, are incorporated in the study. The patients diagnosed with cancer were selected from multiple hospitals and clinics of the Jammu and Kashmir Region. For each patient, the diagnosis results were histologically confirmed. Records of cancer patients and healthy volunteers with the consent of all the participants were included in the present study. In this study, we assembled Clinical, demographic, and anthropometric information for all participants under similar conditions. The predictors identical in all the three datasets are age, weight, height, BMI.
Ovarian Cancer Dataset (Verma et al. Citation2019): Ovarian cancer dataset was used in the study (Verma et al. Citation2019). Later on, we gathered more data and a total record of 697 participants was collected comprising 248 ovarian cancer patients (mean age 58.7 years, range 22–89) and 449 controls (mean age 56.44 years, range 25–89). Collected data includes menopausal status (that determine the pre/post or bleeding after menopause again), Pre/Post Menopause (for each participant, this status expressed whether patient experience menopause earlier or later), age of menarche i.e. age of onset of menses, presence of breast cancer nodules (stating whether the patient is diagnosed with breast nodules also), and use of oral contraceptives. These clinical features have been marked as important risk factors (B. M. Reid, Permuth, and Sellers Citation2017). The target variable is ovarian code that determines whether a person has ovarian cancer or not. The statistical description of the ovarian cancer dataset is provided in . Range and missing values are given for each predictor.
Table 3. Statistical description of ovarian cancer dataset
These clinical features have been marked as important risk factors (B. M. Reid, Permuth, and Sellers Citation2017). The target variable is ovarian code that determines whether a person has ovarian malignant growth or not.
Lung Cancer Dataset (Bhat et al. Citation2019): The lung Cancer dataset was first used in the study (Bhat et al. Citation2019). Then we incorporated new records in the dataset, and the final dataset comprises 225 lung cancer patients. Out of 225, 10 patients belong to Stage 1, 69 to stage II, 96 to stage III, and 50 to Stage IV. Out of 225, there were 187 males and 38 females identified with Lung Cancer. Clinical information about lung cancer patients (mean age 61 years, mean BMI 22 kg/m2) was registered. The age range of onset of cancer is [29, 84]. The risk factors or symptoms of lung cancer included in creating the dataset are weakness or weight loss, hoarseness of voice, pain in the chest, dyspnea, cough, fever, and tobacco intake (Cruz, Tanoue, and Matthay Citation2011). Other factors included in the dataset are the age of onset of cancer, duration of onset of cancer, Gutkha, and alcohol intake (Tumors Citation2008). These clinical features have been marked as significant risk factors in the research studies (Cooley Citation2000; Skaug, Eide Msci, and Gulsvik Citation2007; Monila Citation2008). depicts the statistical description of the dataset. Smoking and age of onset are expressed in terms of years. Duration is defined in terms of months. Cough is recorded in terms of days. The target variable is “Stage,” which determines the cancer stage of the patient. Due to inadequacy in stage-I records, we have excluded stage-I patients from further analysis. As most rows are missing from a few of the predictors like cough, hoarseness of voice, dyspnea, and fever, these features are excluded from the future analysis.
Leukemia Dataset (Bhat et al. Citation2019): An absolute record of 613 members was made containing 207 Leukemia patients (mean age 40.47 years, run 3–93) and 407 healthy people (mean age 49.18 years, extend 14–89). Out of 207, 140 males and 67 females were determined to have leukemia, i.e., More records of male leukemia patients are included in the dataset. The hemoglobin tally differs from 8.6 (mean) in cases to 9.7 (median) in controls. Gathered information incorporates the smoking status, the alcoholic propensities, the proximity of fever, unusual augmentation of spleen or liver (Splenomegaly/Hepatomegaly), and hemoglobin tally of the patient. These clinical highlights have been set apart as significant hazard factors in prior studies (Davis, Viera, and Mead Citation2014). Dataset description is given in .
Table 4. Statistical description lung cancer dataset
Table 5. Statistical description of Leukemia dataset
Variable 7 i.e. “Alcoholic” depicts whether person consumes alcohol (2), does not consume alcohol (2) and sometimes/occasionally drinks (1). Hemoglobin count is a significant factor as it depicts the amount of red blood cells (RBC) in the body and is expressed in terms of gm/dL (grams per deciliter). The objective variable is “case/control” that decides if an individual is a case (leukemia patient) or control (healthy person).
Digitized Image Datasets
The breast cancer Wisconsin dataset and prostate cancer dataset are obtained from the digitized images. Both the datasets are online accessible on the Kaggle data vault.
Breast Cancer Wisconsin Dataset (Publisher, Bennett, and Mangasarian Citation2011): The cancer dataset comprises 569 occasions in which 357 belong to the benign class and 212 belong to the malignant class. Absolute 32 highlights figured from a digitized picture of a breast mass’s fine needle suction (FNA) are available. The highlights/properties utilized in the dataset portray qualities of the cell cores present in the picture, and “diagnosis” is the objective/target variable that determines the status of breast cancer diagnosis outcome.
Prostate Cancer Dataset: This dataset is accessible from the Kaggle database (https://www.kaggle.com/sajidsaifi/prostate-cancer). It comprises record of 100 occasions and ten factors. One variable indicates the distinguishing proof number; the other 8 are numerical factors. The objective variable is “determination result,” which is all out having two classifications to be specific Malignant (M) and Benign (B). Dangerous class contributes to 62% of situations, whereas 38% have a place with benign class. Accordingly, harmful cells cosmetics the dominant part class while generous cells contribute to framing the minority class. There emerges the issue of class imbalance as a class with more data points can overshadow the class with fewer instances
Gene Expression Based Datasets
Various examinations have detailed the utilization of quality articulation information and other high-dimensional genomic information for endurance expectation (Chaddad et al. Citation2017; Skaug, Eide Msci, and Gulsvik Citation2007; Sun et al. Citation2018; Xiao et al. Citation2018; Cho and Won Citation2003; Shedden et al. Citation2008; Størvold et al. Citation2007; Y. Chen, Ke, and Chiu Citation2014). For example, non-small-cell lung carcinoma (NSCLC) patients’ quality articulation crude information (CEL files) and clinical information downloaded from the NCI database, a vault of high-throughput gene expression data microarrays.
Lung Cancer Survival Dataset: We investigated numerous informational indexes to evaluate the prognostic estimation of different parameters in lung disease. We utilized the survival time (< year and a half) as a high-risk group and survival time [18, 48] as the moderate-risk group, and survival time > 4 years as a low-risk group. This NSCLC information was recorded basically from four establishments and constituted of 442 NSCLC patients. Patients’ survival durations, ages, breakdown phases, treatment, and smoking history were all included in the clinical data. All gene expression data profiling was carried out using Affymetrix HG-U133A chips. The treatment response data includes age, race, sex, survival time, adjuvant chemotherapy, adjuvant radiation therapy, and stage statistics. Cases with missing survival time are omitted from further analysis. The summary of the patient’s information and NSCLC patients, along with classified risk groups, is depicted in .
Table 6. Summary of NSCLC patients
Classification Model
Given the accomplishment of neural networks in biomedicine in earlier studies, we resorted to employing deep learning architectures (Gupta and Gupta Citation2021; Gupta and Kumar Citation20212022; Kumar et al. Citation2021). Henceforth, to construct learning models that can learn the unknown relationships among various classifiers, we embrace the Stacking-based ensemble learning of neural classifiers.
Ensemble Learning: Taking into account the way that ensemble learning can integrate various learning techniques. The resultant model that takes pluses of compound learning strategies would prompt superior performance. A few examinations have been portrayed in the writings to incorporate models to raise the exactness of the expectation. For example, Bagging was acquainted by Breiman (Breiman Citation2001) to consolidate outputs from decision trees produced by a few arbitrarily chose sub-sets of the training information and decisions in favor of the ultimate result. Boosting is an improved adaptation of Bagging that was advanced by Freund and Schapire (Vladimir et al. Citation2005). This strategy works by uplifting the weights of training samples in each iteration and finally joins the classification outcomes by weighted votes. Wolpert (Wolpert Citation1992) proposed using linear models to integrate results of the learning structures, otherwise called Stacking or blending. Contrasting the majority voting that takes just the linear connections among classifiers into thought, stacking classifiers can “learn” non-linear structures. Stacking utilizes a learning approach to integrate the models that make it a significantly more remarkable outfit strategy.
Multiple Layer Perceptrons: Rosenblatt constructed a single-layer perceptron that permits the neural systems to demonstrate a shallow neural system, wound up forestalling this network from performing non-linear classification (Rosenblatt Citation1958). Quick forward to 1986, when Hinton, Rumelhart, and Williams distributed a paper ”Learning representations by back-propagating errors,” presenting ideas about Backpropagation and hidden layers – subsequently bringing forth Multilayer Perceptrons (MLPs)(Rumelhart and Hintont Citation1986). In the forward pass, the data stream flows from the information layer through the shrouded (“hidden”) layers to the final (“output”) layer, and the selection of the last layer is estimated against the ground truth labels. Hidden Layers are neuron hubs stacked in the middle of sources of info and outcomes, permitting neural systems to learn intricate features gradually. In Backpropagation, weights are updated repeatedly to minimize the error rate utilizing the chain rule of calculus, partial derivatives of the error function. Such strategy provides us a gradient or a scene of blunder. Also, this may balance the parameters as it can estimate the error in various ways, including by Mean Square Error (MSE).
Measures and Parameters of Variables
Model Hyperparameters are properties that govern the entire training process. They include variables that decide the system structure (for instance, Number of Hidden Units) and the factors which determine how the system is prepared (for example, Learning Rate). Model hyperparameters are set before preparing (before upgrading the loads and predisposition). Hyperparameters are significant since they straightforwardly control the classification performance. Also, it has a substantial effect on the execution of the model under training. Optimization Hyperparameters are connected more to the advancement and preparing process like learning rate and number of epochs. In addition, model Hyperparameters are more associated with the structure of the model, like hidden layers and hidden units.
Learning rate: If the model’s learning rate is significantly below than optimum quality, it will take significantly longer (hundreds or thousands) of epochs to reach optimum state. Then again, on the off chance that the learning rate is a lot bigger than ideal worth, at that point it would overshoot the perfect state and the calculation probably won’t merge. We chose the learning rate = 0.001 in the wake of tuning the neural model.
Epochs: We used 500 epochs for the training phase of each MLP classifier. The intuitive manual method is to train the model for as much iterations as the validation error continues to decrease.
Hidden units: It is one of the more perplexing hyper parameters. The number of the hidden units is proportional to the learning limit of the model. We used units of 50, 150, and 200 in MLP 1, MLP 2, and MLP 3, respectively. Another heuristic regarding the first hidden layer is that empirical observation indicates that increasing the number of hidden units above the number of inputs results in improved performance on a variety of tasks.
Layers: MLP_1 is fabricated using two hidden layers while MLP_2 is prepared using three hidden layers. Consequently, MLP_3 is constructed with four hidden layers.
Optimizer: AdaM represents Adaptive Momentum. It joins the Momentum and RMS prop in a solitary methodology making AdaM an exceptionally incredible and quick streamlining agent. Adaptive Moment Estimation (Adam) computes adaptive learning rates for each parameter and favors flat minima on the error surface. As followed, we calculate the decay average of the previous squared gradients (
and past gradients
and
are approximations of the gradients’ initial moment (the mean) and secondary moment (the un-centered variance). The biases were countered using
i.e. bias-corrected first and second moment estimates respectively. These are mathematically expressed in equation (iii) and (iv).
Finally, the ADAM rule is expressed in eq. (v).
Activation function: For input layer, ReLU activation function is used. We utilized the Sigmoid as the activation function in the hidden and output layer. It is a rather straightforward architecture, yet complex enough to serve as a valuable function.
Rectified Linear Units (ReLU): ReLU function guarantees that if y is more prominent than zero, our yield remains y; else if y is negative, our yield is zero. In short, we select the most extreme among 0 and y. ReLU is expressed mathematically in equation (vi).
Sigmoid activation: The enactment work utilized in the inside layer of ANN is Sigmoid. The arrival estimation of sigmoid capacity is monotonically expanding, lies between 0 and 1 or from −1 to 1. Sigmoid capacity is characterized scientifically in eq. (vii).
A sigmoid function is a statistical function with a characteristic “S”-shaped curve that is called the sigmoid curve.
Friedman Ranking Test
The Friedman Test is a non-parametric variant to ANOVA with Repeated Measures. It is used to detect there is or is not a statistical substantial distinction of three or more groups that contain the same participants. The Friedman test is used to determine the classifiers’ ranks. At the 0.5 and 95% confidence levels, the null hypothesis (H0: there is no significant variation in classifier performance) is discarded. Thus, the alternative hypothesis (H1) is supported, implying a considerable difference exists between the classification results. Bonferroni–Holm adjustments were employed to determine the significance of the multi-neural ensemble above other classifiers.
Working Methodology
The dataset denoted by X is made of x belonging to a set of attributes, and y denotes the target column. Also, z represents the size of the data. The base learners (MLP1, MLP2 & MLP3) are represented by M1, M2 & M3, respectively. The algorithms work by training each base learner applying MLPs on original data (X) and saving it as S1, S2, and S3 (M1, M2, & M3, respectively).Then a new dataset (P1) is generated to hold predictions (p) made by the S1, S2, and S3. Then the prediction dataset (P1) made using base learners is passed as input through meta-model GDC or G and stored in S’. Finally, the desired model is obtained. The algorithm of the stacking-based neural ensemble model is given in .
Figure 2. Algorithm of the stacking-based neural ensemble model.
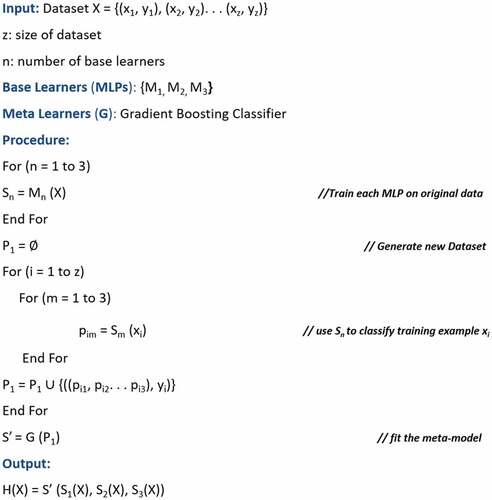
(MLP1, MLP2 & MLP3) are represented by M1, M2 & M3, respectively, predictions (p), prediction dataset (P1)
The approach used in this study attempts to use a Gradient-boosting classifier (GBC) to stack deep neural networks, to construct a multi-model ensemble model to predict cancer in normal and tumor conditions. The selected features in each of the cancer datasets are supplied to the three neural models. After that, the GBC is used to stack the outputs of the three base learners to acquire the last forecast outcome. shows the learning architecture proposed in the study.
Figure 3. Proposed stacking based neural ensemble model.
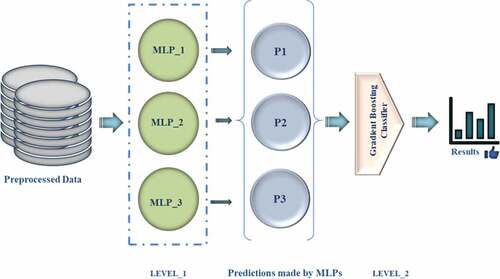
Multilayer Perceptrons_1 (MLP_1), Multilayer Perceptrons_2 (MLP_2), and Multilayer Perceptrons_3 (MLP_3), Prediction (P)
Gradient Boosting Classifier (GBC) basically works by updating the weights of the wrongly classified instances in the subsequent layers. The error (€) is calculated using the Equation (viii), where sm denotes all the instances in the training data and s < S (S = number of weak learners).
Here is the conditional function assessing the hypothesis
,
if the condition
is true else 0 and is calculated in the Equation (ix).
Then the misclassified cases are assigned a weight on the succeeding layer using the equation (x).
The principal behind weight updation approach is to tempt learning where the classification models learn from the mistakes of the models at preceding layers. Further = 0 implies no Updation in the weight of the instance given in Equation (xii).
In case of misclassification, weight updation for the particular instance is given in Equation (xiii).
After the s repetitions, the final output is given in the Equation (xiv).
Thus, Gradient Boosting Classifier (GBC) works on the basis of weighted vote scheme where the working of the classification models depends on the prediction performance of (n-1)th classifiers.
Execution Details
The models were created using a Dell −15JPO9P computer equipped with an Intel Core i7-8550 U processor running at 1.80 GHz and 8 GB of Random-Access Memory (RAM). All machine learning algorithms are implemented in Python 3.7 via Anaconda Navigator.
Results and Discussion
This segment holds the experimental outcomes gathered after applying the proposed classification procedure. The graphs used to display the simulation results are plotted using “matplotlib” library in python.
The evaluation parameters used for the assessment of the prediction models are described in . These evaluation parameters lay the standard for evaluating the advantages and shortcomings of the AI-based learning approaches. In , true positive (P) refers to the correctly recognized cases, false positive rate (Q) refers to the cases that are negative and wrongly identified by the model, true negative rate (R) refers to the outcomes that are correctly predicted as negative by the technique, and false-negative rate (S) refers to the negative cases wrongly predicted by the model. The description of commonly used evaluation parameters for instance accuracy (Acc), Specificity (Spec.), Sensitivity (Sens.), F-measure, Receiving operator characteristic (ROC) curve, and Area under the curve (AUC) is given in (appendix).
Clinical Datasets: The proposed architecture performed best on both the datasets containing clinical data.
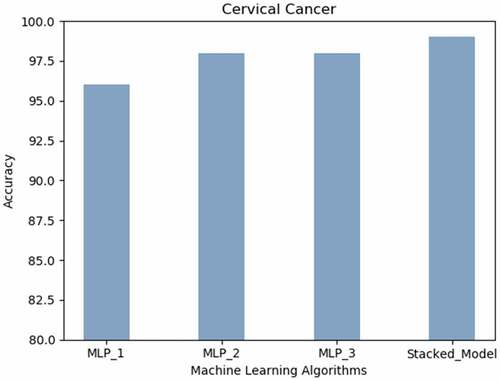
Cervical Cancer: The proposed Stacked_Model achieved 98.9% accurateness. The MLP with a single hidden layer realized the lowest prediction results are revealed in the .
Figure 4. Cervical cancer.
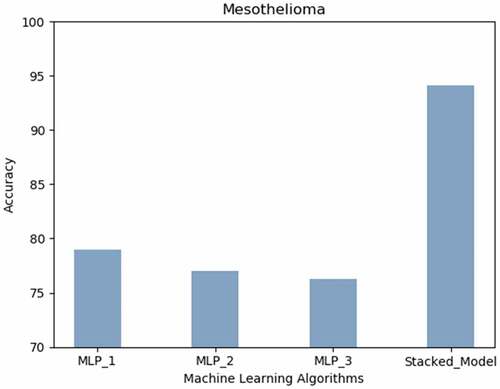
Mesothelioma: The stacked MLP model attained highest prediction accuracy (94%). Neural networks with less hidden layers performed better than those with more layers as presented in the .
Figure 5. Mesothelioma.
Real Time Datasets: The stacked model acquired the best prediction accuracy on all the three real-time datasets of J&K cases.
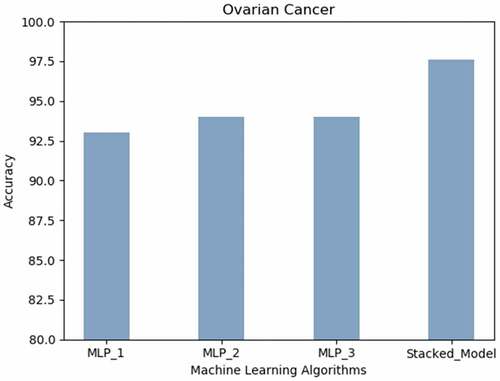
Ovarian Cancer: Inferring from , the best prediction accuracy on the Ovarian Cancer dataset was attained by the proposed stacked model (98% approximately) followed by the neural network built using three or more hidden layers.
Figure 6. Ovarian cancer.
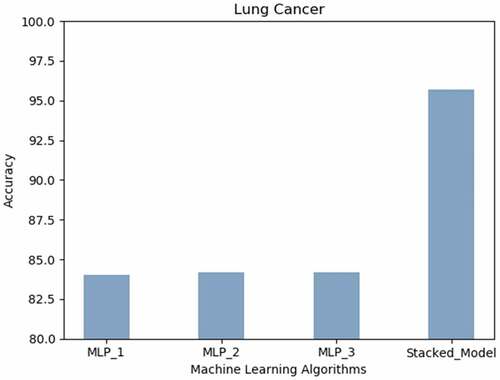
Lung Cancer: shows that the best prediction accuracy on the Lung Cancer dataset was attained by the proposed stacked model (95.7%) followed by the MLPs with two or more hidden layers (84%).
Figure 7. Lung cancer.
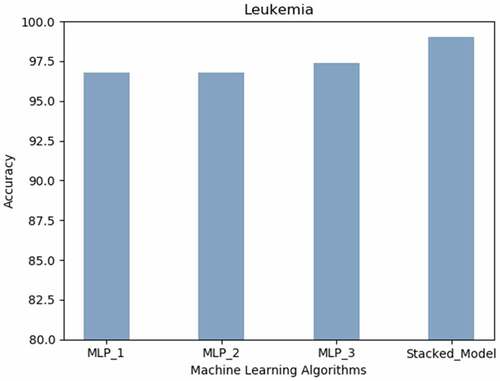
Leukemia: expresses that the most appreciable accurateness of 99% was achieved using Stacked Model can predict leukemia.
Figure 8. Leukemia.
Digitized Image Datasets: The best performance was displayed by the proposed learning technique followed by the MLP_2 on the datasets derived using digitized images.
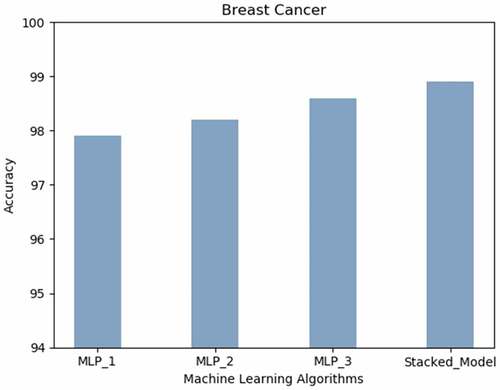
Breast Cancer: Breast Cancer prediction accuracy (99% approx.) is obtained with the proposed technique. The neural architecture with more layers performed better as compared to the MLP with less hidden layers as depicted in .
Figure 9. Breast cancer.
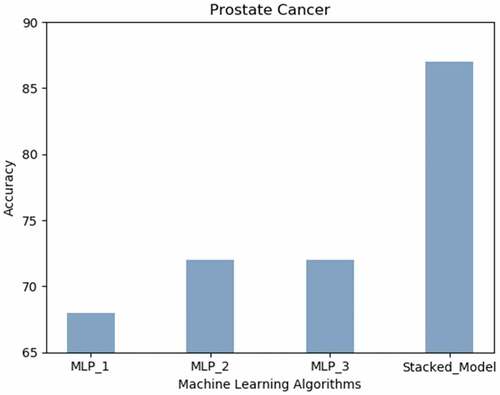
Prostate Cancer: displays the accuracy results achieved using all the neural techniques. The proposed model predicts prostate cancer with the highest accuracy (87%).
Figure 10. Prostate cancer.
Gene Expression Dataset: The proposed machine learning algorithm worked the best on gene expression-based dataset.
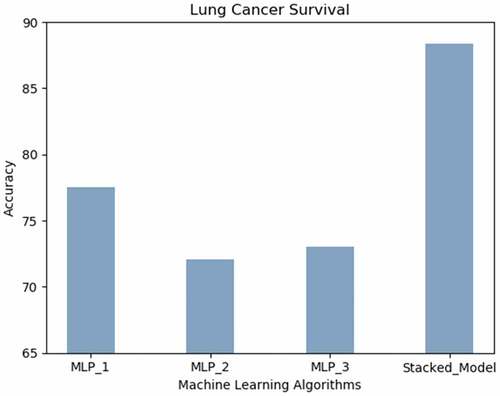
Lung Cancer Survival: illustrates that the accuracy achieved by the proposed model predicts the survival of lung cancer patients with the highest accuracy (88.47%) followed by MLP_1.
Figure 11. Lung cancer survival.
Prediction Results of the Proposed Model Accuracy
The final stacked neural model was assessed on each of the cancer datasets using different performance assessment parameters. The classification model was validated using a 10-Fold Cross-Validation approach. The performance of the model was investigated using evaluation parameters (Powers Citation2020) like Accuracy (Acc), Area under the Curve (AUC), F1_Score (F1), Mathew’s Correlation Coefficients (MCC), Specificity (Spec.), Sensitivity (Sens.). The prediction results thus attained are depicted in . The description of evaluation parameters is given in .
Table 7. Assessment of stacked model
infers that the prediction architecture proposed in the study performs well on all the cancer datasets. Following inferences need to be highlighted:
The Stacked Neural model worked well with both cervical cancer and Mesothelioma dataset attaining a great prediction score.
The prediction model worked well with the three real-time ovarian cancer datasets (binary), lung cancer dataset (multi-class problem) where the target is to predict stage (stage 2, 3 and 4), and leukemia dataset (binary target). The proposed prediction model performed exceptionally well on all the parameters concerning the Wisconsin breast cancer dataset.
The projected model worked well on NSCLC gene-expression dataset achieving appreciable prediction outcomes where the target is to predict the survival time of the lung cancer patients.
Comparison of the Proposed Model
To evaluate the effectiveness of the proposed study, we compared several approaches to predicting cancer or patient survival using the benchmark datasets (Cervical Cancer, Mesothelioma, Breast Cancer, and NSCLC gene expression-based lung cancer survival data. Comparisons based on the prediction accurateness (accuracy score) achieved by several research studies are summarized, and the highest accuracy scores are bold-faced in .
Table 8. Stacked model results
reasons that the proposed classification technique, i.e., stacking-based multi-neural ensemble system, shows an incredible performance on all cancer datasets. Our proposed strategy performed better than the techniques employed in previous research studies.
Statistical Analysis
Using Friedman statistical significance tests (WALs and Kelleher Citation1971) and Holms post-hoc analysis, the proposed stacking-based multi-neural ensemble is statistically compared to three deep learning approaches for each dataset (Holm Citation1979). contains the average Friedman ranks (the higher the rating, the better (Evans Citation2019)) and the adjusted p.
Table 9. Statistical results
Friedman rankings of each classifier demonstrated that the suggested stacked model beat the MLP 1, MLP 2, and MLP 3 algorithms significantly (at 0.05).
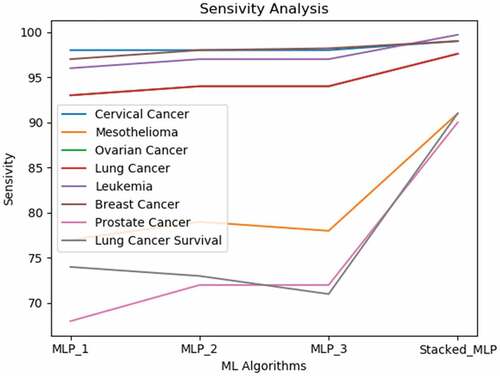
Based on the results, we perceive that the proposed gradient boosting-based multi-neural approach produces noticeable results superior to each of the neural classification models. Due to the complication and high mortality of cancer, diagnosis precision is critical. Consequently, improvement in diagnosis prediction by applying machine learning systems is of great aid to cancer cure. According to the interpretations in an earlier study (Kourou et al. Citation2015a), neural networks have been used in 70% of cancer research studies. This interpretation encouraged us to integrate multiple neural models for attaining a more precise classification model. In the study, we presented an evaluation of the proposed multi-neural technique and the three different MLP models acting solo. Also, Simulation results on the eight data sets express that the proposed strategy yields greater accurateness than all the other learners performing individually. The sensitivity analysis shown in specifies that the single classification model displays uneven performance for different data sets.
Figure 12. Sensitivity analysis.
Conclusion
A gradient boosting-based multi-neural approach is presented to predict cancer diagnosis, stage and survival. Multiple cancer datasets like real-time datasets, clinical, image-driven datasets, and gene expression data have been analyzed. The multi-neural ensemble model based on stacking ensembles the outputs of the three neural classifiers. Employing gradient boost learning at the second level enables the ensemble method to recognize the intricate relationships among the classifiers are automatically to achieve better prediction. This exploratory investigation conveys that the proposed stacking-based deep learning model can be an integral asset for a viable biomarker of various tumors. An ideal classifier must achieve higher sensitivity as diagnosing tumorous patients as nonmalignant would be a significant hazard. For cancer studies, this misclassification can be more hazardous than categorizing a healthy patient as malignant. Proposed gradient boosting used in the ensemble stage spontaneously acquires complicated structures. The instance labels are learned, such that the yield of MLPs and the associations amid them are considered. The gradient boosting learner works in a step-wise fashion by placing more weight on the instances that have been misclassified in the former stage. Subsequently, the appreciable accurateness of cancer prediction is achieved. The classification outcomes achieved by the predictive model in each of the cancer datasets are exceptionally sound to advocate the worth of the proposed model in further studies and medicinal practices. The study has some limitations; for instance, the model has been evaluated on small-size datasets only, and there is a requirement to validate the model on considerably large-sized datasets. Also, the proposed approach has been evaluated on only cancer datasets; for the sake of generalizability, the proposed model needs to be validated on other disease datasets as well. Regarding future directions, we aim to analyze the performance of the proposed model on other disease datasets.
Cervical Cancer (Risk Factors) Data Set
https://archive.ics.uci.edu/ml/datasets/Cervical+cancer+%28Risk+Factors%29
Mesothelioma’S Disease Data Set
https://archive.ics.uci.edu/ml/datasets/Mesothelioma%C3%A2%E2%82%AC%E2%84%A2s+disease+data+set
Breast Cancer Wisconsin (Diagnostic)
https://archive.ics.uci.edu/ml/datasets/Breast+Cancer+Wisconsin+(Diagnostic)
Prostate Cancer Data Set
https://www.kaggle.com/sajidsaifi/prostate-cancer
Code Software: The python code along with all the developed for the cancer diagnosis prediction pronounced in this study made available on Github.com at the following URL: https://github.com/surbhigupta24/Stacking-Based-Multi-Neural-Ensemble-
All the data files used in the study along with python code are uploaded privately on https://github.com/ and can be made public afterwards or can be provided to readers.
Disclosure Statement
No potential conflict of interest was reported by the author(s).
Data Availability Statement
The following are the links of online datasets: https://github.com/surbhigupta24/Stacking-Based-Multi-Neural-Ensemble-
References
- Abdoh, S. F., M. A. B. O. Rizka, and F. A. Maghraby. 2018. Cervical cancer diagnosis using random forest classifier with SMOTE and feature reduction techniques. IEEE Access 6:59475–1456. doi:10.1109/ACCESS.2018.2874063.
- Adem, K., S. Kiliçarslan, and O. Cömert. 2019. Classification and diagnosis of cervical cancer with stacked autoencoder and softmax classification. Expert Systems With Applications 115:557–64. doi:10.1016/j.eswa.2018.08.050.
- Allemani, C., H. K. Weir, H. Carreira, R. Harewood, D. Spika, X.-S. Wang, F. Bannon, Ahn, J.V., Johnson, C.J., Bonaventure, A., Marcos-Gragera, R., et al. 2014. Global surveillance of cancer survival 1995 – 2009 : Analysis of individual data for 25 676 887 patients from 279 population-based registries in 67 countries (concord-2). The Lancet 385 (9972):977-1010. doi:10.1016/S0140-6736(14)62038-9.
- Altman, N.S. An introduction to kernel and nearest neighbor nonparametric regression. 1992 The American Statistician 46 (3):175-185. June.
- Bhat, A., R. Shah, G. Rasool Bhat, S. Verma, V. Sharma, I. Sharma, M. Pandita, et al. 2019a. Association of ARID5B and IKZF1 variants with leukemia from Northern India. Genetic Testing and Molecular Biomarkers 23 (3):176–79.
- Bhat, G. H. R., A. Bhat, S. Verma, I. Sethi, and R. Shah. 2019b. Genetic variant rs10937405 of tp63 and susceptibility to lung cancer risk in north indian population. Journal of Genetics 98 (2):1–6. doi:10.1007/s12041-019-1102-5.
- Bourlard, H., and Y. Kamp. 1988. Auto-Association by multilayer perceptrons and singular value decomposition. Biological Cybernetics 59 (4–5):291–94. doi:10.1007/BF00332918.
- Bray, F., J. Ferlay, and I. Soerjomataram, Siegel, R.L., Torre, L.A., Jemal, A. 2020. “Global cancer statistics 2018 : GLOBOCAN estimates of incidence and mortality worldwide for 36 cancers in 185 countries.” Ca-a Cancer Journal for Clinicians 70 (4): 313-313. doi:10.3322/caac.21492.
- Breiman, L. 2001. Random forests. Otras Caracteristicas 1–33. doi:10.1017/CBO9781107415324.004.
- Ceylan, Z., and E. Pekel. 2017. Comparison of multi-label classification methods for prediagnosis of cervical cancer. Graphical Models 21:22.
- Chaddad, A., C. Desrosiers, M. Toews, and B. Abdulkarim. 2017. Predicting survival time of lung cancer patients using radiomic analysis. Oncotarget 8 (61):104393–407.
- Chen, D., K. Xing, D. Henson, L. Sheng, A. M. Schwartz, and X. Cheng, The George, The George, and Washington Dc. 2009. “Developing prognostic systems of cancer patients by ensemble clustering.” 2009(i). doi:10.1155/2009/632786.
- Chen, H., J. Gao, D. Zhao, H. Song, and Q. Su. 2021. Review of the research progress in deep learning and biomedical image analysis till 2020 |. Journal of Image and Graphics 26 (3).
- Chen, Y.-C., W.-C. Ke, and H.-W. Chiu. 2014. Risk classi fi cation of cancer survival using ANN with gene expression data from multiple laboratories. Computers in Biology and Medicine 48:1–7. doi:10.1016/j.compbiomed.2014.02.006.
- Chicco, D., and C. Rovelli. 2019. Computational prediction of diagnosis and feature selection on mesothelioma patient health records. PLoS ONE 14 (1):1–28. doi:10.1371/journal.pone.0208737.
- Cho, S.-B., and H.-H. Won. 2003. “Machine learning in DNA microarray analysis for cancer classification.” Proceedings of the First Asia-Pacific Bioinformatics Conference on Bioinformatics 2003-Volume, Adelaide, Australia,19, 189–98.
- Coccia, M., and M. Bellitto. 2018. Human progress and its socioeconomic effects in society. Journal of Economic and Social Thought 5 (2):160–78. doi:10.1453/jest.v5i2.1649.
- Coccia, M. 2016. Problem-driven innovations in drug discovery: Co-evolution of the patterns of radical innovation with the evolution of problems. Health Policy and Technology 5 (2):143–55. doi:10.1016/j.hlpt.2016.02.003.
- Coccia, M. 2017. “Sources of disruptive technologies for industrial change.“ L'industria 38(1):97–120. doi:00197416. doi:10.1430/87140.
- Coccia, M. 2019 November. “Why do nations produce science advances and new technology?” Technology in Society. 59(101124):1–9. doi:10.1016/j.techsoc.2019.03.007.
- Coccia, M. 2020, February. “Deep learning technology for improving cancer care in society: New directions in cancer imaging driven by artificial intelligence.” ( art. n. 101198) Technology in Society 60:1–11. doi: 10.1016/j.techsoc.2019.101198.
- Cooley, M. E. 2000. Symptoms in adults with lung cancer : A systematic research review. Journal of Pain and Symptom Management 19 (2):137–53.
- Cornell, R. F., and J. Palmer. 2012. Adult acute leukemia. YMDA 58 (4):219–38. doi:10.1016/j.disamonth.2012.01.011.
- Cruz, C. S. D., L. T. Tanoue, and R. A. Matthay. 2011. Lung cancer: Epidemiology, etiology, and prevention. Clinics in chest medicine 32 (4):605-644. doi:10.1016/j.ccm.2011.09.001.
- Davis, A. S., A. J. Viera, and M. D. Mead. 2014. Leukemia: An overview for primary care. American Family Physician 89 (9):731–38.
- Deshmukh, P. B., and K. L. Kashyap. 2022. Solution Approaches for Breast Cancer Classification Through Medical Imaging Modalities Using Artificial Intelligence. In Smart Trends in Computing and Communications (pp. 639-651). Springer, Singapore.
- Devi, M. A., S. Ravi, J. Vaishnavi, and S. Punitha. 2016. Classification of cervical cancer using artificial neural networks. Procedia - Procedia Computer Science 89:465–72. doi:10.1016/j.procs.2016.06.105.
- Evans, B. P. 2019. Population-based ensemble learning with tree structures for classification. Victoria University of Wellington, Te Herenga Waka.
- Fatlawi, H. K. 2017. Enhanced classification model for cervical cancer dataset based on cost sensitive classifier. International Journal of Computer Techniques 4 (4):115–20.
- Ferlay, J. 2018. “Estimating the global cancer incidence and mortality in 2018 : GLOBOCAN sources and methods.” 1–13. doi:10.1002/ijc.31937.
- Fernandes, K., D. Chicco, and J. S. Cardoso. 2018. “Supervised deep learning embeddings for the prediction of cervical cancer diagnosis.” Cdc 1–20. doi:10.7717/peerj-cs.154.
- Fernandes, K., J. S. Cardoso, and J. Fernandes. 2017. Transfer learning with partial observability applied to cervical cancer screening. In Iberian conference on pattern recognition and image analysis (pp. 243-250). Springer, Cham. doi:10.1007/978-3-319-58838-4.
- Fradkin, D., I. Muchnik, and D. Schneider. 2005. “Machine learning methods in the analysis of lung cancer survival data.” DIMACS Technical Report 2005–35.2014
- Gupta, Surbhi, and Manoj Kumar Gupta. 2021b. “Computational prediction of cervical cancer diagnosis using ensemble-based classification algorithm.” The Computer Journal.
- Gupta, M., C. Das, A. Roy, G. R. Pillai, and K. Patole 2020. Region of interest identification for cervical cancer images, Proceedings - International Symposium on Biomedical Imaging 2020-April,9098587, Iowa City, IA, USA, pp. 1293–96
- Gupta, S., and M. Gupta. 2020. An approach based on neural learning for diagnosis of prostate cancer. Journal of Natural Remedies 21 (3):110–18. https://jnronline.com/ojs/index.php/about/article/view/108.
- Gupta, S., and M. Gupta. “Deep learning for brain tumor segmentation using magnetic resonance images.” In 2021 IEEE Conference on Computational Intelligence in Bioinformatics and Computational Biology (CIBCB), Melbourne, Australia, pp. 1–6. IEEE, 2021.
- Gupta, S., and M. Kumar Gupta. 2021a. Computational model for prediction of malignant mesothelioma diagnosis. The Computer Journal. Doi: 10.1093/comjnl/bxab146
- Gupta, S., and M. Kumar Gupta. 2021b. “A comprehensive data‐level investigation of cancer diagnosis on imbalanced data.” Computational Intelligence. https://doi.org/10.1111/coin.12452
- Gupta, S., and M. Kumar. “Prostate cancer prognosis using multi-layer perceptron and class balancing techniques.” In 2021 Thirteenth International Conference on Contemporary Computing (IC3-2021), Jaypee Institute of Information Technology, Noida, India, pp. 1–6. 2021.
- Gupta, S., and Y. Kumar. 2022. Cancer prognosis using artificial intelligence-based techniques. SN Computer Science 3 (1):1–8.
- Gupta, Surbhi, and Manoj Kumar Gupta. 2021. A comparative analysis of deep learning approaches for predicting breast cancer survivability. Archives of Computational Methods in Engineering 1–17.
- Holm, S. 1979. Board of the Foundation of the Scandinavian Journal of Statistics. 6 (2):65–70.
- Hu, X. U. E., and Y. Zebo. 2019. Diagnosis of mesothelioma with deep learning. Oncology Letters 17 (2):1483–90. doi:10.3892/ol.2018.9761.
- Ilhan, H. O., and E. Celik. 2017. “The mesothelioma disease diagnosis with artificial intelligence methods.” Application of Information and Communication Technologies, AICT 2016 - Conference Proceedings, Baku, Azerbaijan. DOI:10.1109/ICAICT.2016.7991825.
- Islami, F., A. Goding Sauer, K. D. Miller, R. L. Siegel, S. A. Fedewa, E. J. Jacobs, A. Jemal . 2018. Proportion and number of cancer cases and deaths attributable to potentially modifiable risk factors in the United States. CA: A Cancer Journal for Clinicians 68 (1):31–54. doi:10.3322/caac.21440.
- K. P. Bennett, and O. L. Mangasarian. 2011. Optimization methods and software robust linear programming discrimination of two linearly inseparable sets. Optimization Methods and Software 1 (1):23-34. doi:10.1080/10556789208805504.
- Kaur, M., and B. Singh. 2019. Diagnosis of Malignant Pleural Mesothelioma Using KNN. In: Krishna C., Dutta M., Kumar R. (eds) Proceedings of 2nd International Conference on Communication, Computing and Networking. Lecture Notes in Networks and Systems, vol 46., NITTTR Chandigarh, India. DOI:10.1109/icasic.1996.562734.
- Kavakiotis, I., O. Tsave, A. Salifoglou, N. Maglaveras, I. Vlahavas, and I. Chouvarda. 2016. Machine learning and data mining. Computational and Structural Biotechnology Journal. doi:10.1016/j.csbj.2016.12.005.
- Kawakami, E., J. Tabata, N. Yanaihara, T. Ishikawa, K. Koseki, Y. Iida, A. Okamoto . 2019. “Application of arti fi cial intelligence for preoperative diagnostic and prognostic prediction in epithelial ovarian cancer based on blood biomarkers.” Clinical Cancer Research 25 (10):3006-3015. doi:10.1158/1078-0432.CCR-18-3378.
- Key, T. J., P. K. Verkasalo, and E. Banks. 2001. Reviews Epidemiology of Breast Cancer. The Lancet Oncology 2 (3): 133-140.
- Kohli, R., A. Garg, S. Phutela, Y. Kumar, and S. Jain. 2021. an improvised model for securing cloud-based E-healthcare systems. In IoT in healthcare and ambient assisted living, 293–310. Singapore: Springer.
- Kononenko, I. 2001. Machine learning for medical diagnosis: History, state of the art and perspective. Artificial Intelligence in Medicine 23 (1):89–109. doi:10.1016/S0933-3657(01)00077-X.
- Korbar, B., A. Olofson, A. Miraflor, A. Suriawinata, and S. Hassanpour. 2017. Deep learning for classification of colorectal polyps on whole-slide images. Journal of Pathology Informatics 8 (1):A11.
- Kourou, K., T. P. Exarchos, K. P. Exarchos, M. V. Karamouzis, and D. I. Fotiadis. 2015a. Machine learning applications in cancer prognosis and prediction. Computational and Structural Biotechnology Journal 13:8–17. doi:10.1016/j.csbj.2014.11.005.
- Kumar, U. K., M. B. Sai Nikhil, and K. Sumangali. 2017, August. Prediction of breast cancer using voting classifier technique. In 2017 IEEE international conference on smart technologies and management for computing, communication, controls, energy and materials (ICSTM) (pp. 108-114). IEEE.
- Kumar, Y., K. Sood, S. Kaul, and R. Vasuja. 2020. Big data analytics and its benefits in healthcare. In Big data analytics in healthcare, 3–21. Cham: Springer.
- Kumar, Y., and M. Mahajan. 2019. Intelligent behavior of fog computing with IOT for healthcare system. International Journal of Scientific & Technology Research 8 (7):674–79.
- Kumar, Y., and R. Singla. 2021. “Federated learning systems for healthcare: perspective and recent progress.” In Federated learning systems. studies in computational intelligence, R. M.h. and G. M.m. ed., vol. 965, Cham: Springer. doi:10.1007/978-3-030-70604-3_6.
- Kumar, Y., S. Gupta, R. Singla, and Y.-C. Hu. 2021. A systematic review of artificial intelligence techniques in cancer prediction and diagnosis. Archives of Computational Methods in Engineering (2021):1–28.
- Kumar, Y. 2020. Recent advancement of machine learning and deep learning in the field of healthcare system. In R. Srivastava, P. Kumar Mallick, S. Swarup Rautaray & M. Pandey (Ed.), Computational Intelligence for Machine Learning and Healthcare Informatics (pp. 77-98). Berlin, Boston: De Gruyter. https://doi.org/10.1515/9783110648195-005
- Lecun, Y., Y. Bengio, and G. Hinton. 2015. Deep Learning. Nature 521 (7553):436–44. doi:10.1038/nature14539.
- Levine, A. B., C. Schlosser, J. Grewal, R. Coope, S. J. M. Jones, and S. Yip. 2019. Rise of the machines : Advances in deep learning for cancer diagnosis. TRENDS in CANCER xx:1–13. doi:10.1016/j.trecan.2019.02.002.
- Liu, Y., and A. Xiaomei. 2017, October. A classification model for the prostate cancer based on deep learning. In 2017 10th International Congress on Image and Signal Processing, BioMedical Engineering and Informatics (CISP-BMEI) (pp. 1-6). IEEE.
- Lu, M., Fan, Z., Xu, B., Chen, L., Zheng, X., Li, J., … & Jiang, J. (2020). Using machine learning to predict ovarian cancer. International Journal of Medical Informatics, 141, 104195
- Lynch, C. M., B. Abdollahi, J. D. Fuqua, A. R. De Carlo, J. A. Bartholomai, R. N. Balgemann, V. H. Van Berkel, and H. B. Frieboes. 2017. International journal of medical informatics prediction of lung cancer patient survival via supervised machine learning classi fi cation techniques. International Journal of Medical Informatics 108 (September):1–8. doi:10.1016/j.ijmedinf.2017.09.013.
- Lynch, C. M., V. H. Van Berkel, and H. B. Frieboes. 2017. Application of unsupervised analysis techniques to lung cancer patient data. PLoS One 12 (9): e0184370.
- Maria, I. J., T. Devi, and D. Ravi. 2020. Machine learning algorithms for diagnosis of leukemia. IJSTR 9 (1):267–70.
- Masters, T. 1993. Probabilistic neural networks. Practical Neural Network Recipies in C++ 3:201–22. doi:10.1016/b978-0-08-051433-8.50017-3.
- Mei, L., V. Jaitly, I. Wang, H. Zhihong, L. Chen, M. Wahed, Z. Kanaan, A. Rios, and A. N. D. Nguyen. “Application of deep learning on predicting prognosis of acute myeloid leukemia with cytogenetics, age, and mutations.” arXiv preprint arXiv:1810.13247 (2018).
- Miao, W., C. Yan, H. Liu, and Q. Liu. 2018. Automatic classification of ovarian cancer types from cytological images using deep convolutional neural networks. Bioscience Reports 38 (3).
- Mukherjee, S. 2018. Malignant mesothelioma disease diagnosis using data mining techniques. Applied Artificial Intelligence 32 (3):293–308. doi:10.1080/08839514.2018.1451216.
- Nilashi, A. M., and O. Ibrahim. 2017. “An analytical method for diseases prediction using machine learning techniques.” Computers and Chemical Engineering. doi:10.1016/j.compchemeng.2017.06.011.
- Orhan, E., A. Cetin Tanrikulu, A. Abakay, and F. Temurtas. 2012. An approach based on probabilistic neural network for diagnosis of mesothelioma’s disease. Computers and Electrical Engineering 38 (1):75–81. doi:10.1016/j.compeleceng.2011.09.001.
- Parthiban, L, Latchoumi, T.P. 2017. Abnormality detection using weighed particle swarm optimization and smooth support vector machine. Biomedical Research 28 (11):4749–51.
- Piao, Y., M. Piao, and K. Ho Ryu. 2017. Crossmark. Computers in Biology and Medicine 80 (September 2016):39–44. doi:10.1016/j.compbiomed.2016.11.008.
- Powers, D. M. W. “Evaluation: From precision, recall and F-measure to ROC, informedness, markedness and correlation.” arXiv preprint arXiv:2010.16061 (2020).
- Reid, A., N. De Klerk, and A. W. Bill Musk. 2011. “Does exposure to asbestos cause ovarian cancer ? a systematic literature review and meta-analysis.” Cancer Epidemiology and Prevention Biomarkers 20(7): 1287-1295. doi:10.1158/1055-9965.EPI-10-1302.
- Reid, B. M., J. B. Permuth, and T. A. Sellers. 2017. “Epidemiology of ovarian cancer : A review.” Cancer Biology & Medicine 14 (1): 9. doi:10.20892/j.2095-3941.2016.0084.
- Rosenblatt, F. 1958. The perceptron: A probabilistic model for information storage and organization in the brain. Psychological Review 65 (6):386.
- Rumelhart, D. E., and G. E. Hintont, Williams, R.J. 1986. “Learning representations by back-propagating errors.” Nature 323 (6088): 533-536:.
- Salah, H. T., I. N. Muhsen, M. E. Salama, T. Owaidah, and S. K. Hashmi. 2019. “Machine learning applications in the diagnosis of leukemia : Current trends and future directions.” International Journal of Laboratory Hematology 41 (6): 717-725. doi:10.1111/ijlh.13089.
- Sara, F., S. Asadi, and M. W. Kattan. 2019. A comprehensive data level analysis for cancer diagnosis on imbalanced data. Journal of Biomedical Informatics 90. doi:10.1016/j.jbi.2018.12.003.
- Saygili, A. 2019. “Classification and diagnostic prediction of breast cancers via different classification and diagnostic prediction of breast cancers via different classifiers.” International Scientific and Vocational Studies Journal 2 (2): 48-56. no. December 2018
- Seera, M., and C. Peng Lim. 2013. “A hybrid intelligent system for medical data classification.” Expert Systems With Applications. doi:10.1016/j.eswa.2013.09.022.
- Shedden, K., Taylor, J. M., Enkemann, S. A., Tsao, M. S., Yeatman, T. J., Gerald, W. L., … and Sharma, A. 2008. Gene expression-based survival prediction in lung adenocarcinoma: a multi-site, blinded validation study: Director’s Challenge Consortium for the molecular classification of lung adenocarcinoma. Nature medicine, 14(8), 822.
- Shouval, R., M. Labopin, N. C. Gorin, D. Bomze, M. Houhou, D. Blaise, A. Nagler . 2019. Individualized prediction of leukemia‐free survival after autologous stem cell transplantation in acute myeloid leukemia. Cancer 125 (20):3566–73.
- Sinigaglia, R., Þ. G. B. Cosimo Gigante, Þ. Stefania Varotto, L. Zanesco, and S. Turra. 2008. Musculoskeletal manifestations in pediatric acute leukemia. Journal of Pediatric Orthopaedics 28 (1):20–28.
- Skaug, K., G. E. Eide Msci, and A. Gulsvik. 2007. Prevalence and predictors of symptoms in the terminal stage of lung cancer *. CHEST 131 (2):389–94. doi:10.1378/chest.06-1233.
- Størvold, H. L., M. Aldrin, Ø. Borgan, A. Frigessi, H. M. Bøvelstad, S. Nyga, and O. C. Lingjærde. 2007. “Gene expression predicting survival from microarray data — A comparative study.” Bioinformatics 23 (16):2080–87. doi:10.1093/bioinformatics/btm305.
- Sumbaly, R. 2014. Diagnosis of breast cancer using decision tree data mining technique. International Journal of Computer Applications 98 (10):16–24.
- Sun, W., M. Jiang, J. Dang, P. Chang, and F.-F. Yin. 2018. “Effect of machine learning methods on predicting NSCLC overall survival time based on radiomics analysis.” Radiation Oncology 13(1): 1–8.
- Tan, A. C., and D. Gilbert. 2003. “Ensemble machine learning on gene expression data for cancer classification. Proceedings of New Zealand Bioinformatics Conference, Te Papa, Wellington, New Zealand, 13-14 February 2003. University of Glasgow.” 21–10, London.
- Tolkach, Y., T. Dohmgörgen, M. Toma, and G. Kristiansen. 2020. High-accuracy prostate cancer pathology using deep learning. Nature Machine Intelligence 2 (7):411–18. doi:10.1038/s42256-020-0200-7.
- Torre, L. A., B. Trabert, C. E. Desantis, K. D. Miller, G. Samimi, C. D. Runowicz, M. M. Gaudet, and A. Jemal. 2018. “Ovarian cancer statistics, 2018.” CA: A Cancer Journal for Clinicians 284–96. doi:10.3322/caac.21456.
- Tumors, S. 2008. “Non–small cell lung cancer: Epidemiology, risk factors, treatment, and survivorship.” 83 (May):584–94. doi:10.4065/83.5.584.
- Verma, S., V. Sharma, A. Nagpal, G. R. B. Amrita Bhat, R. Shah, R. Kumar . 2019. DNA base excision repair genes variants rs25487 (X-ray repair cross-complementing 1) and rs1052133 (human 8-oxoguanine glycosylase 1) with susceptibility to ovarian cancer in the population of the Jammu region, India. Journal of Cancer Research and Therapeutics 15 (6):1270.
- Vladimir, S., T. Wang, C. Tong, A. Liaw, R. P. Sheridan, and Q. Song. 2005. Boosting: An Ensemble Learning Tool for Compound Classification and QSAR Modeling. Journal of Chemical Information and Modeling 45 (3):786–99. doi:10.1021/ci0500379.
- WALs, J. E., and G. R. A. C. E. J. Kelleher. 1971. lnstitute of Mathematical statistics is collaborating with JSTOR to digitize, preserve, and extend access the annals of mathematical statistics. sil. The Annals of Mathematical Statistics 42 (3):1142–53.
- Wang, L., Y. Wang, and Q. Chang. 2016. Feature selection methods for big data bioinformatics : A survey from the search perspective. Methods (August). doi:10.1016/j.ymeth.2016.08.014.
- Wei, K., T. Li, F. Huang, J. Chen, and Z. He. 2022. Cancer classification with data augmentation based on generative adversarial networks Frontiers of. Computer Science 16 (2):162601.
- Wolpert, D. H. 1992. “Stacked Generalization.” Neural Networks 5:241–59.
- Wu, W. E. N., and H. A. O. Zhou. 2017. “Data-driven diagnosis of cervical cancer with support vector machine-based approaches.” IEEE Access 5:25189–95.
- Xiao, Y., W. Jun, Z. Lin, and X. Zhao. 2018. A deep learning-based multi-model ensemble method for cancer prediction. Computer Methods and Programs in Biomedicine 153:1–9. doi:10.1016/j.cmpb.2017.09.005.
- Yoav, F., and R. E. Schapire. 1996. “Experiments with a new boosting algorithm.” Proceedings of the 13th International Conference on Machine Learning, 148–56. 10.1.1.133.1040.
- Yoo, S., I. Gujrathi, M. A. Haider, and F. Khalvati. 2019. Prostate cancer detection using deep convolutional neural networks. Scientific Reports 1–10. doi:10.1038/s41598-019-55972-4.
- Zahras, D. 2018. “Cervical cancer risk classification based on deep convolutional neural network.” 2018 International Conference on Applied Information Technology and Innovation (ICAITI), Padang, Indonesia, 149–53.
- Zhang, Y., Y. Zall, R. Nissim, and Z. R. Satyam. 2022. “Evaluation of a new dataset for visual detection of cervical precancerous lesions expert systems with applications.” Expert Systems with Applications 190:116048.
Appendix
Table A1. Description of metrices