
 ?Mathematical formulae have been encoded as MathML and are displayed in this HTML version using MathJax in order to improve their display. Uncheck the box to turn MathJax off. This feature requires Javascript. Click on a formula to zoom.
ABSTRACT
In recent years, with the advancement of classical signal processing approaches, numerous works have been performed on the automatic ECG detection schemes for the enhancement of the effectiveness of the identification of the type of ECG heartbeats. One common issue faced by the previous works is the complexity of signal processing. In order to resolve the computational and complexity issues of existing techniques of signal processing, this research work introduces Sparse representation technique for extracting feature. In this study, adaptive thresholding technique combined with Sparse-based Recurrent Neural Network – Long Short Term Memory (RNN-LSTM) model is employed for the classification of ECG signals. P-QRS-T peaks are identified by employing Adaptive thresholding technique. Statistical features are obtained for each signal and are employed in the process of dictionary learning of sparse decomposition. Sparse representations of the incoming ECG signals are used in training the RNN-LSTM network. The trained classifier will give a classified result on giving a test ECG input signal. The performance indices for the process of classification such as accuracy, precision, error rate, sensitivity, and F-score are calculated. The performance of the proposed Sparse based RNN-LSTM classifier is found to be better in comparison with the existing RNN classifier, K-Nearest Neighbor (K-NN) classifier, and Decision Tree (DT) classifier. Furthermore, for validating the performance of the proposed framework, this approach is tested experimentally with real-world raw ECG data acquired using the AD8232 single-lead ECG sensor. The performance of the proposed experimental setup is compared with the existing state-of-the-art approaches.
INTRODUCTION
Electrocardiogram (ECG) signal is the morphological data of the cardiac electrical activity, which gives significant details about the condition of the heart. There are several kinds of heart diseases and each kind corresponds to a pattern of arrhythmia, and it is feasible to detect and differentiate its type. Detection of ECG arrhythmias is thus important for treating the patients diagnosed with heart diseases and for providing the appropriate treatment (Das and Ari Citation2014).
Regardless of the easiness of acquiring the data, there are still challenges ahead of us in order to extract reliable information from biomedical signals. Each and every beat of the heart in the cardiac cycle displays the time evolution of the electrical activity of the heart, which is comprised of distinctive electrical patterns of depolarization–repolarization of the heart (Kiranyaz, Ince, and Gabbouj Citation2015).
The major issue in the diagnosis of heart diseases using ECGs is that an ECG signal obtained for one person can be different from another. Therefore, the ECG recordings for a similar disease can differ from patient to patient. In addition to this, two dissimilar diseases can approximately have similar characteristics on an ECG signal. Extraction of those exact characteristics (features) will result in the accurate classification of the ECG signal (Berkaya et al. Citation2018). The extraction of features plays a vital part in the pattern classification, particularly in the classification of images or signals. Either the transformed or the segmented ECG data or the raw data can be subjected to feature extraction (Li and Zhou Citation2016).
However, because of the huge quantity of data and/or the need for online classification present in these situations, additional requirements arise concerning the complexity of signal processing schemes while incorporating classification algorithms.
Our Contribution
For this work, sparse representation-based feature extraction is being examined. Unsupervised learning is used in this form of data representation to produce appropriate data representations that may be used for classification, detection, and prediction. Sparse representation removes the extraneous properties of the incoming data while maintaining the useful and vital characteristics. The removal of extraneous data reduces both the complexity and the computational challenges of the operation. As a result, for the categorization of ECG signals, a Sparse-based Recurrent Neural Network – Long Short Term Memory (RNN-LSTM) model is presented in this research. The study will focus on five common forms of arrhythmias: Normal Sinus Rhythm (NSR), Atrial Fibrillation (AFIB), Atrial Flutter (AFL), rhythms with Premature Ventricular Contractions (PVC), and Supra Ventricular Tachy Arrhythmia (SVTA) (SVTA). To reduce time consumption and extend memory, RNN and LSTM are combined in the classification of ECG data. This deep learning classification model can analyze massive amounts of data in a short amount of time. The goal of the proposed research project is to lessen the complexity and computational problems that currently exist in ECG categorization systems. The research project’s key goals are as follows..
To perform PQRST peaks detection efficiently using Adaptive Thresholding technique
To perform the Sparse Feature Extraction based on Sparse Decomposition technique
To classify the various types of ECG signals using RNN-LSTM classifier model
To improve the performance metrics such as Accuracy, Precision, Sensitivity, Recall, and F-score of the ECG classifier model
To validate the performance of the proposed framework in a real-time application setup, where ECG data are recorded using the AD8232 single-lead sensor.
The proposed Sparse based RNN-LSTM classifier model eliminates the irrelevant data, avoids loss of information of the signals, reduces the computational complexity, and thereby detects the class of the ECG signal efficiently. Hence, this model can be employed in ECG monitoring systems.
The rest of the research paper discusses the related previous works, working of the proposed method of ECG classification, the results and discussion, the conclusion for the work and the future scope of work.
LITERATURE REVIEW
There have been several methods for generic and fully automatic ECG classification based on signal processing techniques, such as frequency analysis, filter banks and wavelet transform, Artificial Neural Networks (ANNs), statistical and heuristic schemes, support vector machines, Hidden Markov Models, and a mixture of state-of-art methods. Few of the related works proposed previously are surveyed in this section.
Übeyli (Citation2010) proposed RNN classifier for detecting the four types of ECG signals. In this approach, the final classification decision was made based on a two-level approach. Features extraction technique which extracts Lyapunov exponents, followed by training RNN with Levenberg–Marquardt algorithm. Four types of arrhythmias are taken for this study, namely, normal, atrial fibrillation, congestive heart failure, and tachyarrhythmia. This method emphasized the importance of Lyapunov features in ECG signals. Accuracy of classification is found to be low because of the short term dependencies of the RNN classifier model.
In the spectral domain analysis, such as Fourier Transform (FT) as proposed by Gothwal, Kedawat, and Kumar (Citation2011), the frequency components of an input signal are generated . FT and Fast Fourier Transform (FFT) help in the extraction of features from the ECG signals. A total of six types of arrhythmias are considered for the work, they are, Bradycardia, Tachycardia, Incomplete Bundle Branch Block, Supraventricular Tachycardia, Ventricular Tachycardia, and Bundle Branch Block. ANN was employed for classifying the ECG signals based on the FT features extracted. However, it lacks in offering any details associated with the time of occurrence of these components.
Another spectral domain analysis is the Wavelet Transform (WT) as presented by Sahoo et al. (Citation2017), which resolves the issue of the constant size of the window by rendering shorter windows at high frequencies and lengthier windows at low frequencies. This makes the WT appropriate for analyzing non-stationary signals by yielding time–frequency features. The extracted features are used for classifying four types of arrhythmias, namely, right bundle branch blocks (RBBBs), left bundle branch blocks (LBBBs), Paced and normal beats, using Multi-Layer Perceptron (MLP), and Support Vector Machine (SVM). However, the challenge in WT is the optimal choice of sampling frequency and mother wavelet in the processing of signal using WT.
Soorma, Singh, and Tiwari (Citation2014) described the Hilbert Huang Transform (HHT) method of extracting features from the normal and abnormal ECG signals. The features being extracted are duration, amplitude, pre-gradient, and post-gradient. One drawback of HHT is that the processed output is affected very much by the noise associated with the signal.
Martis et al. (Citation2013) proposed principal component analysis (PCA) method for the extraction of Higher-Order Spectral features (HOS features) of the ECG test signals. HOS features are mainly extracted to get the dynamic and non-linear characteristics of the ECG signals. In this work, five types of ECG signals (RBBB, LBBB, ventricular premature contraction, atrial premature contraction, and normal) are classified with the help of two different approaches, three-layer Feed Forward Neural Network (FFNN) and Least Square – SVM (LS-SVM), that use PCA method of feature extraction. For applying PCA on the data, the data must be standardized in a proper manner. Failing to do which, will result in the failure to extract optimal components.
Martis et al. (Citation2014) proposed four different feature extraction schemes for the identification of three classes of ECG beats: AFIB, AFL, and normal. The schemes that are investigated for features extraction are PCs of Discrete Wavelet Transform (DWT) coefficients, PCs of Discrete Cosine Transform (DCT), Independent Components (ICs) of DWT coefficients, and ICs of DCT coefficients. Three types of classifiers were employed for comparative exploration namely, K-Nearest Neighbor (KNN), Decision Tree (DT), and ANN. Discrete Cosine Transform (DCT) combined with Independent Component Analysis (ICA) and KNN exhibited better performance. This method ensures reliability for the automated system of diagnosis, but the KNN classifier does not work effectively for larger datasets.
Shadmand and Mashoufi (Citation2016) employed a Block-based Neural Network for classifying five types of heartbeats. The NN is determined by passing the signals through the blocks of the network. The weights of the NN are optimized by the PSO during the training phase.
Elhaj et al. (Citation2016) classified five types of ECG signals (fusion, non-ectopic, ventricular ectopic, supra-ventricular, unclassifiable, ectopic, and paced) using the combination of linear and non-linear features. Features like higher-order cumulants and statistics were considered. For non-linear features reduction, ICA method was employed; whereas for linear features reduction, the PCA method was employed. The dataset was tested using different neural network classifiers like SVM, and NN with 10-fold cross-validation. The method requires improvements computationally since the extraction of linear and non-linear components needs the data to be pre-processed in a proper way.
Pyakillya, Kazachenko, and Mikhailovsky (Citation2017) presented deep learning architectures for classifying four types of ECG beats, namely, very noisy, another kind of rhythm, arrhythmic, and normal sinus rhythm. The initial layers of the neural network are the 1D convolutional NN with Fully Connected Network (FCN) layers comprising of convolutional neurons acting as feature extractors. The fully connected layers are the last layers, which make the final decision of classification. One main drawback of convolutional networks is that it performs significantly slow.
Zhai and Tin (Citation2018) dealt with the classification of supraventricular ectopic beats (SVEB or S beats) and VEB data taken from MIT-BIH arrhythmia database using Convolutional Neural Network (CNN) model. The ECG signals were initially transformed into 2D inputs i.e., dual beat coupling matrix. The transformed matrices were sent as inputs to the CNN classifier. The one thing that lags in this proposed work is the robustness of the classifier.
Beritelli et al. (Citation2018) proposed a novel algorithm of training to provide an efficient solution for NN training in ECG classification. This work employed a Radial Basis Probabilistic Neural Network (RBPNN) for classification. The work aimed at improving the generalization capability of a neural network by preserving the precision and sensitivity of detection. However, PNN is computationally slower and requires more space of memory to store the NN model.
Sánchez and Cervera (Citation2019) proposed ANN for detecting the variabilities of ECG beats. The data considered for the classification is AF dataset from the PhysioNet/CinC challenge 2017. The proposed ANN is a hybrid of FFNN and CNN. ECG beats were given as images for training the CNN. Convolutional features are extracted and given for training the FFNN classifier. Transformation into images might lose a few important features and resolution of the image could be one of those reasons. Hence, the suggested classifier is found to have low reliability.
Kumar R. and Dhiman G. (Citation2021) proposed linear programming that can be represented as straight line variables. This method will not be employed in real-life scenarios with non-linear parameters or parameter values. Complexity and resources aren’t taken into consideration. Linear Programming System Advantages Linear programming is usually used when the parameters and best solution are both static and can be represented as straight line variables. In real-world scenarios with non-linear parameters or parameter values, this strategy will not be applied.
Emperor Penguin Optimizer (EPO) is a unique optimization technique proposed by Dhiman G. and Kumar V. (Citation2021) that resembles the huddling behavior of emperor penguins (Aptenodytes forsteri). EPO’s major processes are to create the huddle boundary, calculate the temperature around the huddle, calculate the distance, and locate the effective mover. These procedures are represented analytically and implemented on 44 well-known benchmark test functions.
According to Basant et al.(Citation2021) Diagnostic approaches for SARS-CoV-2 with different throughput, batching capacity, infrastructure requirements, analytical performance, and turnaround times ranging from a few minutes to many hours. To aid in making an informed decision and quick public health responses, these characteristics should be addressed when choosing an accurate and rapid diagnostic procedure.
Chatterjee I. (Citation2021) has gone a step farther in evaluating the need for patents in the present, while also underlining the limits that the country would face if patents for CRI and AI were not awarded. In summary, the topic of missed opportunities is extensively covered.
The advent of computational intelligence based metaheuristic optimization algorithms has paved a way for the computers to learn from experiences. These algorithms are applied majorly in solving optimization problems like optimal tuning of system parameters, optimal selection of features, etc. Few such latest algorithms are discussed as follows.
Emperor Penguin Optimizer (EPO) (Dhiman and Kumar Citation2018) provided a mathematical formulation of huddling behavior of emperor penguins to solve optimization problems. The main functions include generation of huddle boundary, huddle temperature computation, distance calculation, and the estimation of effective mover. Seagull Optimization Algorithm (Dhiman and Kumar Citation2019) proposed the mathematical formulation of migration and attacking behavior of seagulls to resolve optimization problems. This algorithm was developed to emphasize exploration and exploitation behavior in the defined search space. Sooty Tern Optimization Algorithm(Gaurav and Kaur Citation2019) mathematically formulated the migration and attacking behavior of sooty tern seabirds to solve the problems of optimization. This algorithm focused to emphasize the exploration and exploitation behavior in the defined search space.
A binary model of Orientation Search Algorithm (OSA) called Binary OSA (BOSA) (Dehghani et al. Citation2019) proposed a behavioral modeling of orientation game played by the players of OSA with highly ability to solve the problems of optimization. Similarly, Tunicate Swarm Algorithm (Satnam, K., et al., Citation2020) modeled the jet propulsion and swarm behaviors of tunicates to resolve the optimization problems effectively. Multi-leader optimizer (Dehghani et al. Citation2020) was proposed with the mathematical modeling of the process of advancing multiple leaders as the memberguides of the population to obtain the optimal answer. A game-based optimization technique called Darts Game Optimizer (Mohammad et al. Citation2020b) was proposed with the modeling of the darts game to solve the optimization problem. The main objective is to get the players secure most possible points in their chances.
A novel spring search algorithm (Mohammad et al. Citation2020a) was proposed to bring optimal answers through Hooke’s law. This method focused on solving the single-objective optimization problems. Rat Swarm Optimizer (Dhiman et al. Citation2021), a bio-inspired optimization technique, was developed by modeling the chasing and attacking behavior of rats to solve the optimization problems. This method was mainly developed to solve the engineering design problems. Binary EPO (Gaurav et al. Citation2021) was proposed as the binary model of EPO, where the algorithm focuses on resolving discrete type optimization problems by considering four transfer features. A hybrid metaheuristic algorithm combining emperor penguin and salp swarm algorithm (ESA) (Dhiman, G., 2021) was proposed to improve the efficiency of the algorithm to attaining optimal results. This algorithm was tested in terms of scalability, convergence, sensitivity, and variance.
These metaheuristic algorithms have several limitations and constraints such as, defined search space, initial values of parameters involved, objective function, etc. All these constraints impose effects on the performance of obtaining optimal results. Furthermore, the research in metaheuristics type of feature selection is still under scope to achieve the best optimal results. On the other hand, the method proposed in this work involves sparse feature learning and RNN-LSTM classification. Estimation of sparse features does not involve constraints and initializations to select the optimal set of features, instead, extracted set of features are modeled in an easily interpretable manner that highlights the relevant and non-redundant feature subset. This makes computations easier and helps the classifier to identify the discriminations precisely.
The techniques applied for classical feature extraction exhibit several drawbacks that limit the development of an efficient scheme for the classification of ECG signals. The statistical methods such as PCA and ICA face computational complexity and do not take into consideration the symmetric and reflective properties. To overcome these disadvantages of classical features extraction techniques, sparse features extraction is employed in this research work. Sparse features extraction technique achieves a very high degree of specificity when compared to the traditional multivariate analysis techniques (Lee and Seung Citation1999). After reviewing the existing methods of deep learning-based ECG classification, it has been found that the work requires a more effective model of classification in terms of computational efficiency and detection efficiency. RNN-LSTM exhibits excellent recalling ability since it is the only neural network with memory, and so the sensitivity of detection is high for RNN-LSTM. Furthermore, RNN-LSTM can handle an arbitrary length of inputs, unlike CNN which require fixed input length. Hence, the sparse feature matrix obtained by sparse learning is sent as input to the RNN-LSTM classifier for developing an efficient ECG classifier model.
PROPOSED METHODOLOGY
Dataset
ECG dataset is taken from PhysioNet services from the MIT-BIH Arrhythmia database (Tosic Citation2020). The dataset is downloaded in.mat format. It contains ECG signals from 45 patients: 26 male (age group: 32–89) and 19 female (age group: 23–89) logged at 360 Hz of sampling frequency and 200 adu/mV of gain. These signals are recorded from a single lead and MLII was employed. The analysis is done for 1000, 10-second segments of ECG signals which are selected randomly. Based on the literature, five often seen types of arrhythmias are considered for this research work, they are Normal Sinus Rhythm (NSR), Atrial FIBrillation (AFIB), Atrial Flutter (AFL), rhythms with Premature Ventricular Contractions (PVC), and Supra Ventricular Tachy Arrhythmia (SVTA). The dataset consisting of 547 ECG signals with five labels are processed for extracting the sparse feature matrix. The feature data of 547 beats are split into train and test data. To avoid overfitting, training and testing datasets are created by splitting the patients. The training dataset consists of feature data of 287 beats (76 AFIB, 14 AFL, 70 PVC, 120 NSR, and 7 SVTA) and the test dataset consists of feature data of 260 beats (50 AFIB, 5 AFL, 50 PVC, 150 NSR, and 5 SVTA).
Proposed Framework
Classification of the morphological ECG signals is essential for the medical field in many aspects. This research study incorporates Sparse feature extraction based on Sparse decomposition technique with a machine learning classifier model called RNN-LSTM. The framework of the proposed classification model is shown in . ECG signal is taken as input initially. This input ECG signal undergoes pre-processing phase, where noise cancellation is handled through a denoising bandpass filter. As the research community recommends (Kligfield and Okin Citation2007; Parola and Garcia-Niebla Citation2017), the noise elimination is performed using a 4th order Butterworth low pass filter (40 Hz) followed by a 4th order Butterworth high pass filter (0.5 Hz). Band-pass Butterworth filter provides high precision filtering by allowing both the essential low-frequency components and high-frequency components within the predefined range. And hence the noise filter employed in this work does lose the information of ECG signals, instead, it removes only the additive noise present.
Figure 1. The framework of the methodology proposed.
The noiseless signal then proceeds with Adaptive thresholding technique for finding the peaks of the ECG signal. After the detection of P-QRS-T peaks of the input ECG signal, the segmented signal is decomposed into the dictionary matrix (features of the ECG signal) and sparse matrix, using Sparse representation technique. Sparse decomposition is performed for each ECG data. A total of 547 sparse matrices for 547 ECG data are split into training (287) and testing (260) inputs for the RNN-LSTM classifier. Five classes of ECG signals are considered, namely, Normal Sinus Rhythm (NSR), Atrial FIBrillation (AFIB), Atrial Flutter (AFL), Premature Ventricular Contractions (PVC), and Supra Ventricular Tachy Arrhythmia (SVTA). The classifier will send the classified result ie., the class under which the test input signal falls.
P-QRS-T Peaks Detection Using Adaptive Thresholding Technique
In the adaptive thresholding technique, different thresholds are considered for different regions to find the P-QRS-T peaks of an ECG signal. This has been presented in our previous work (Sampath and Sumithira Citation2016). The initial step is the estimation of the initial thresholds for each wave segment in the ECG signal. The upper and lower threshold values for each peak detection are estimated and updated using time–frequency analysis. ECG signals suffer from a drift in the baseline caused by respiration, electrodes and other sources. A baseline estimate is found initially by taking mean value. This baseline will be estimated for each cycle of P-QRS-T.
The next step is to find the R peak and determine its location. At every iteration of peaks detection (i.e., the detection of P-QRS-T peaks in one cycle), the ECG data sequence between the lower and the upper thresholds of the R wave is extracted. The local maximum for the extracted R wave data sequence is estimated as the R peak. After estimating the peak value in the data sequence, the x-axis and y-axis coordinates are obtained to locate the R peak in the ECG signal. The similar procedure is followed for the detection and localization of P, Q, S, and T peaks. The only variation for locating Q and S peaks is that local minimum value is found instead of local maximum value. During this process, if the next P-QRS-T cycle has started, a flag is set to initiate the next iteration of peaks detection. With the peaks being detected, the peak intervals of the ECG signals such as RR, PR, RT, and QS are determined for the purpose of extracting essential features. There occurs an irregularity for AFIB and AFL signals, which is, the absence of P-waves. AFIB is distinguished from AFL by its organized electric circuit in the right atrium. Hence, AFL produces saw-toothed “f” waves of constant frequency and amplitude as a replacement of the P-waves, whereas AFIB does not produce “f” waves.
Procedure:
Step1: Estimate upper and lower thresholds for R wave using time-frequency signal analysis.
Step 2: Extract data sequence for the R wave segment.
Step 3: Find the local maximum for the data sequence.
Step 4: Locate the R peak by extracting the x-axis and y-axis coordinates of the local maximum.
Step 5: Repeat the steps 1 to 4 for estimating and locating P and T peaks.
Step6: Estimate upper and lower thresholds for Q wave using time-frequency signal analysis.
Step 7: Extract data sequence for the Q wave segment.
Step 8: Find the local minimum for the data sequence.
Step 9: Locate the Q peak by extracting the x-axis and y-axis coordinates of the local minimum.
Step 10: Repeat the steps 6 to 9 for estimating and locating the S peak.
Sparse Feature Extraction Based on Sparse Decomposition
The ECG signals with peaks and intervals being determined are processed further for the sparse representation. For the purpose of learning linear dictionary, a total of 35 meaningful statistical features are extracted from the peak and interval estimates. The intervals of a normal ECG data are given in for reference.
Table 1. Intervals of a normal ECG
Any change in the intervals or peaks of the ECG signal constitutes to an abnormality in the ECG signal. Such kinds of statistical features which provide the distinct characteristics of different types of arrhythmias are extracted and are given in :
Table 2. Features extracted
An unsupervised feature extractor called Sparse feature extraction is applied for this feature matrix. The sparse coding will decompose the ECG data signal “” into dictionary matrix “
” containing 35 features from the input ECG data and “
” containing the sparse features that are used for the reconstruction of the original data signal.
Performing matrix decomposition solves the following - regularized least square problem (Tosic and Frossard Citation2011)..
Where represents a column of
matrix and
represents a column of
matrix, and
represents a total number of columns. The dictionary D is restrained to C matrix where columns
- norm less than 1. This prevents the matrix D from growing larger. The trade-off parameter between sparsity and fidelity is denoted by
. The feature set extracted using Sparse decomposition is sent as input to the proposed classifier model for classification.
Recurrent Neural Network – Long Short Term Memory (RNN-LSTM)
In machine learning models, RNNs have the ability to solve the purpose of sequence handling. RNNs are the only models having internal memory. The architecture of the RNN is shown in .
Figure 2. The architecture of Recurrent Neural Network.
There are three layers for the classifier model: an input layer, hidden layer, and output layer. The input layer is passive, it accepts the inputs and duplicates it into multiple inputs before forwarding to the hidden layers. On the other hand, an output layer and hidden layer are active. In the hidden layer, the input values are multiplied by weights and are added with bias. All the outputs from the hidden layers are combined in the output layer to produce output according to the activation function given.
An RNN can handle small datasets since it deals with short term dependencies. But when it comes to large context, an extension of memory is required to hold the previous sequences. In that case, LSTM is employed as a memory extension to the RNN. LSTM involves a mechanism known as cell states for the flow of information. LSTMs have long-term dependencies and hence the problem of vanishing gradient in RNN is being resolved. This makes the LSTM more suitable for classification problems where time-series data are used. The architecture of an LSTM memory cell is given in .
Figure 3. The architecture of a memory cell of LSTM.
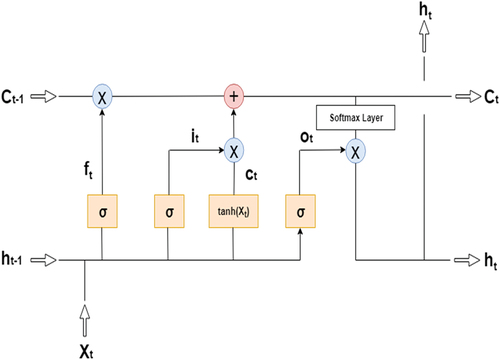
LSTM network undergoes training using the backpropagation algorithm. Each neuron in the neural network contains an LSTM memory cell. A single memory cell of LSTM consists of three gates namely: input gate it, output gate Ot, and forget gate ft. An input gate accepts present input (Xt) and includes it in the present cell state (Ct−1). A forget gate decides whether to keep or forget the previous hidden state (ht−1). At last, the output gate finds the outcome of the current state of the cell. The equations for the LSTM gates are expressed as follows:
where is the sigmoidal activation function used in input, forget, and output gate having a range from 0 to 1, and
is the activation function used in cell gate having a range from −1 to 1. The activation function decides the output of each neuron.The major drawback is diminishing gradients, which make it difficult to learn extended data sequences Gradients convey information that is used in RNN parameter updates, and when the gradient shrinks, the parameter updates become minor, implying that no meaningful learning is taking place. The term “vanishing gradient” refers to the fact that the backpropagated error signal in a feedforward network (FFN) often reduces (or grows) exponentially as the distance from the last layer increases. Predicting problems, translating machine, recognizing speech, summarizing the text are the major application.
Classification of ECG Signals
The sparse feature matrix extracted from the five classes (NSR, AFIB, AFL, PVC, and SVTA) of ECG signals is employed for the training phase of the proposed RNN-LSTM neural network classifier. After training the network with these matrices, the testing phase is initiated. On giving the extracted sparse features of test ECG input signal to the fully trained RNN-LSTM network, the network will identify the class of the given input ECG signal.
In real time execution, the comparison between desktop and server computers, personal wearable devices use small and low-power processors that are substantially slower. As a result, the suggested heartbeat classification method must have a low computing intensity to meet the timing constraints for continuous execution. It’s worth noting that only the inference (test) step is run in real-time and must adhere to strict deadlines. In the beginning, the training phase is just done once.
RESULTS AND DISCUSSION
Simulation Results
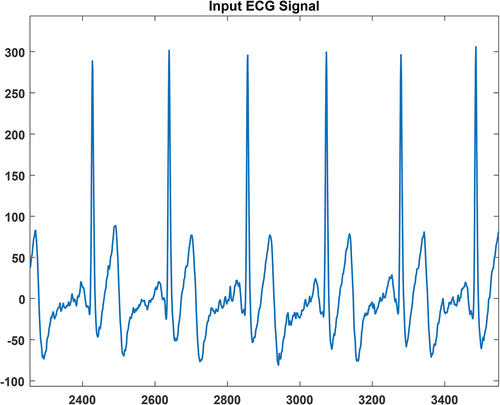
The classification of ECG signals is implemented in the MATLAB environment. The initial step is to determine the peaks of the ECG signal so as to extract significant statistical features from the ECG signal. shows a sample input ECG signal for which the PQRST peaks are to be detected.
Figure 4. ECG Input Signal.
The performance of the popularly known state-of-the-art method called Pan Tompkin’s method of PQRST detection is compared with the performance of the proposed Adaptive Thresholding method in terms of time consumption. show the detection of peaks using Adaptive Thresholding and Pan Tompkin’s respectively, for the sample input ECG signal shown in .
Figure 5. PQRST Peak Detection using Adaptive Thresholding.
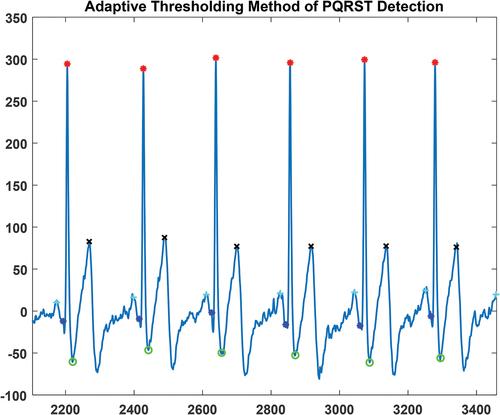
Figure 6. QRS detection using Pan Tompkin’s Method.
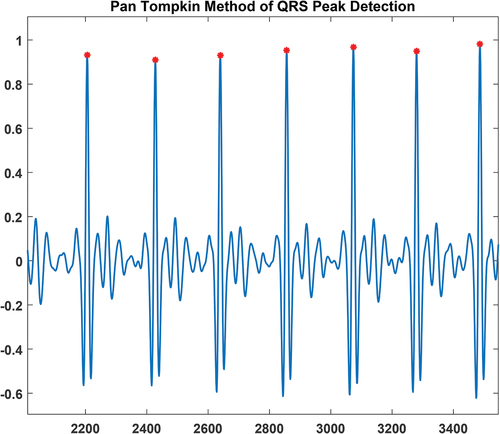
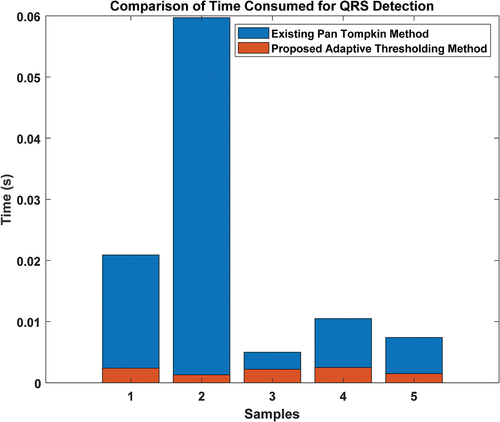
It isobserved that the proposed method of peak detection determines the peaks accurately and also consumes less amount of time in comparison with the existing Pan Tompkin’s method. The bar plot of the comparison of time consumed for detecting the QRS complex of the ECG signal is given in .
Figure 7. Comparison of time consumption.
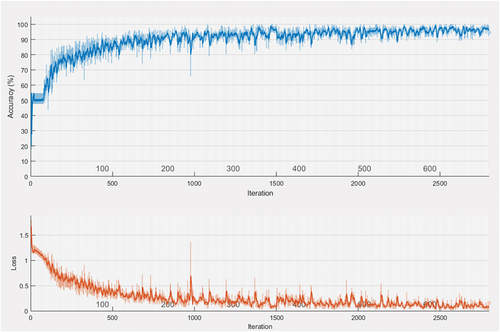
displays the training progress of the proposed Sparse based RNN-LSTM network. The developed RNN-LSTM network is composed of five layers, they are, input layer, LSTM layer, fully connected layer, softmax layer, and a classification layer. The hidden layers consist of a total of 1500 neurons. The learning rate of the network is 0.01. And the learning is carried out for 700 epochs with 4 iterations per epoch; and hence a total of 2800 iterations.
Figure 8. Training progress of RNN-LSTM network.
The 5 labels of the data correspond to the 5 arrhythmia types: NSR, AFIB, AFL, rhythms with PVC, and SVTA. , provides the details of the confusion matrix obtained for the proposed Sparse based RNN-LSTM model of ECG classification for the test dataset. With differentiable features being extracted using the sparse method, the proposed model of classification is able to achieve 100% accuracy for a few classes. The overall accuracy achieved is 97.3% and the error rate is found to be 2.7% for the proposed Sparse based RNN-LSTM classifier.
Figure 9. Confusion matrix of the proposed sparse-based RNN-LSTM Classifier.

The performance of the proposed Sparse based RNN-LSTM classifier is compared with that of the existing RNN, K-NN, and Decision Tree (DT) classifier models. The confusion matrix of the existing RNN classifier for test dataset is shown in .
Figure 10. Confusion matrix of the RNN Classifier.

The overall accuracy achieved is 91.2% and the error rate is found to be 8.8% for the existing RNN classifier.
The confusion matrix of the existing K-NN classifier for test dataset is shown in .
Figure 11. Confusion matrix of the K-NN Classifier.

The overall accuracy achieved is 90.8% and the error rate is found to be 9.2% for the existing K-NN classifier.
The confusion matrix of the existing DT classifier for test dataset is shown in .
Figure 12. Confusion matrix of the DT Classifier.
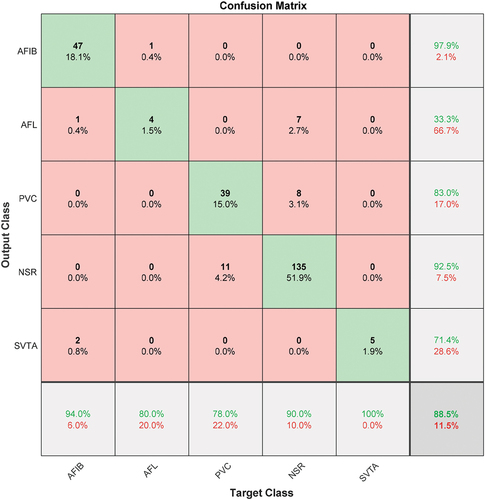
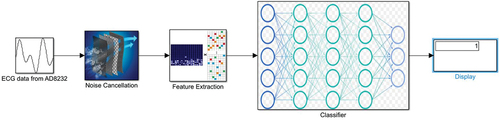
Figure 13. Integration of Experimental Setup with MATLAB/SIMULINK.
The overall accuracy achieved is 88.5% and the error rate is found to be 11.5% for the existing DT classifier.
The performance parameters such as Accuracy, Error rate, Sensitivity, Precision, and F-score are calculated using False Positive (FP), True Positive (TP), False Negative (FN), and True Negative (TN) obtained from the confusion matrices.
Accuracy indicates the ratio of the cases detected correctly to the total count of cases.
Where is the summation of TP and FP; and
is the summation of TN and FN.
Error rate refers to the misclassification rate. It is the ratio of the summation of FP and FN to the total count of observations.
Sensitivity (or Recall) is the ratio of correctly selected classes to the sum of correctly selected and mistakenly rejected classes
Precision is defined as the ratio of the positive observations detected correctly to all the positive outcomes.
F-score refers to the weighted average of Recall and Precision. This parameter score considers both FN and FP. The F-score for the classifier is calculated by the following expression.
provides the accuracy obtained for each type of arrhythmia using different classifier models.
Table 3. Comparison of accuracies
provides the comparison of the performance parameters calculated for the proposed Sparse based RNN-LSTM classifier and the existing RNN (Singh et al. Citation2018), K-NN (Thomas and Mathew Citation2016), and DT (Shao et al. Citation2018) classifiers.
Table 4. Comparison of performance parameters
From the comparison table, it is evident that the accuracy of classification for the proposed Sparse based RNN-LSTM classifier is 6.2% more than the RNN classifier, 6.68% more than the K-NN classifier, and 9.04% more than the DT classifier. The performance of the proposed classifier shows supremacy over the existing RNN, K-NN, and DT classifiers in terms of accuracy, error rate, sensitivity, precision, and F-score.
In , the accuracy of the proposed classification model is compared with the recent research work. The comparison shows that the proposed classifier model performs better classification of ECG signals when compared to the above-mentioned techniques (Chen and Maharatna Citation2020; Bae and Kwon Citation2021).
Table 5. Comparison of classification methods
Furthermore, the performance of the proposed PQRST peak detection using Adaptive thresholding is compared with other proposed approaches of peak detection, and the results are displayed in .
Table 6. Comparison of accuracies of PQRST peak detection techniques
The three parameters considered are, accuracy of R peak detection, positive predictivity of R peak, and the sensitivity of R peak prediction. Accuracy of R Peak is detected using the formula given in equation 3. Positive Predictivity of R Peak is detected using the formula given in Equation (6). Sensitivity of R Peak Prediction is detected using the formula given in Equation (5).
Experimental Results
The proposed Sparse based RNN-LSTM classifier is employed in the real-world application of classifying ECG signal using a single-lead ECG sensorto check its validity with raw data taken directly from the patients. The experimental setup of capturing ECG data is integrated with MATLAB/SIMULINK for further processing and the schematic is given in .
A single-lead ECG sensor is employed for the acquisition of ECG signals from the patient under study. The analog device used for sensing the ECG of the patients is ADI 8232 (Niu Citation2019). This AD8232 is a signal conditioning unit for ECG as well as other bio-potential sensing applications. This device extract amplifies, and filters small-signal even in a noisy environment. The data from the sensor is acquired at 360 Hz sampling frequency as recommended by MIT-BIH dataset (Tosic Citation2020). These samples are digitized using an ultralow-power ADC (Analog to Digital Converter) and are sent to MATLAB/SIMULINK, where the processing is done. The single-lead ECG sensor data are noisier, because of the external bio-electric interferences. As the proposed framework suggests, the acquired data is passed through a bandpass filter designed using a 4th order Butterworth low pass filter followed by a 4th order Butterworth high pass filter for noise cancellation. Then the peaks of the noiseless signal are detected, features are extracted using sparse decomposition and the input data is classified using the proposed RNN-LSTM model. The results obtained for the data collected using single-lead are tabulated in .
Table 7. Comparison of results obtained using experimental setup
The performance of the proposed classifier in the real-world application is compared with that of the state-of-the-art classifiers such as RNN, K-NN, and DT. The accuracy of the proposed Sparse based RNN-LSTM classifier is7.06% better than the accuracy achieved by RNN classifier. It is evident from the table that the proposed framework produces improved accuracy rate, error rate, sensitivity rate, precision, and F-measure.
Furthermore, the results of the proposed experimental setup are compared with existing state-of-the-art approaches (Yao et al. Citation2020; Niu et al. Citation2019,; Niu Citation2019). Different performance parameters such as accuracy rate, sensitivity rate, specificity rate, power, and frequency were compared and recorded in .
Table 8. Comparison of the performances of different experimental setups
CONCLUSION
The classification of ECG data is done in this research utilizing a Sparse based RNN-LSTM classifier. After the phase of PQRST peaks detection using the Adaptive Thresholding technique, the ECG signals are subjected to Sparse Feature Extraction based on Sparse Decomposition. A total of 35 characteristics are extracted and used in the Sparse Decomposition’s Dictionary learning process. The ECG signal is divided into two matrices: Sparse and Dictionary. The RNN-LSTM network is trained using the two matrices that resulted, as well as their accompanying class labels. ECG signals are delivered as test inputs to the trained RNN-LSTM network after the training phase. A confusion matrix is created using the actual observations and predicted values, and performance measures like as accuracy, error rate, sensitivity, F-score, and precision are determined. The proposed Sparse-based RNN-LSTM classification model is compared to the existing RNN, K-NN, and DT classifiers in terms of performance. The suggested Sparse-based RNN-LSTM classifier outperformed the others in a comparison analysis.The proposed classifier was also tested in a real-time experimental setup using single-lead ECG sensor AD8232, and the results proved that the proposed framework was well suited for real-world application as well. In the future, more enhancements to the algorithm can be provided to improve the performance.
Authors’ contributions
1. Sampath A. – Conceptualization, Methodology, and Drafting the manuscript.
2.Dr. Sumithira. T. R. – Literature review and supervision.
Availability of Data and Material
The data that support the findings of this study are available depends upon reasonable request.
Code availability
This study codes are available depends upon reasonable request.
Consent to participate
Both authors give their approval and consent to participate.
Consent for publication
The authors consent for publication.
Disclosure statement
No potential conflict of interest was reported by the author(s).
Additional information
Funding
References
- Abubakar, S. M., M. R. Khan, W. Saadeh, and M. A. B. Altaf, et al. 2018, November. A wearable auto-patient adaptive ECG processor for shockable cardiac arrhythmia. In 2018 IEEE Asian Solid-State Circuits Conference (A-SSCC) Tainan, Taiwan, 267–1484. IEEE.
- Abubakar, S. M., W. Saadeh, and M. A. B. Altaf. 2018, March. A wearable long-term single-lead ECG processor for early detection of cardiac arrhythmia. In 2018 Design, Automation & Test in Europe Conference & Exhibition (DATE) Dresden, Germany, 961–66. IEEE.
- Bae, T. W., and K. K. Kwon. 2021. ECG PQRST complex detector and heart rate variability analysis using temporal characteristics of fiducial points. Biomedical Signal Processing and Control 66:102291. doi:10.1016/j.bspc.2020.102291.
- Basant, G., S. Pandey, R. Shrestha, K. Pokharel, F. S. Ligler, and B. B. Neupane, et al. 2021. Review of analytical performance of COVID-19 detection methods. Analytical and Bioanalytical Chemistry 413 (1):35–48. doi:10.1007/s00216-020-02889-x.
- Bayasi, N., T. Tekeste, H. Saleh, B. Mohammad, A. Khandoker, and M. Ismail, et al. 2015. Low-power ECG-based processor for predicting ventricular arrhythmia. IEEE Transactions on Very Large Scale Integration (VLSI) Systems 24 (5):1962–74. doi:10.1109/TVLSI.2015.2475119.
- Beritelli, F., G. Capizzi, G. L. Sciuto, C. Napoli, and M. Woźniak, et al. 2018. A novel training method to preserve generalization of RBPNN classifiers applied to ECG signals diagnosis. Neural Networks 108:331–38. doi:10.1016/j.neunet.2018.08.023.
- Berkaya, S. K., A. K. Uysal, E. S. Gunal, S. Ergin, S. Gunal, and M. B. Gulmezoglu, et al. 2018. A survey on ECG analysis. Biomedical Signal Processing and Control 43:216–35. doi:10.1016/j.bspc.2018.03.003.
- Chatterjee, I. 2021. Artificial intelligence and patentability: review and discussions. International Journal of Modern Research 1 (1):15–21.
- Chen, H., and K. Maharatna. 2020. An automatic R and T peak detection method based on the combination of hierarchical clustering and discrete wavelet transform. IEEE Journal of Biomedical and Health Informatics 24 (10):2825–32. doi:10.1109/JBHI.2020.2973982.
- Das, M. K., and S. Ari. 2014. ECG beats classification using a mixture of features. International Scholarly Research Notices. 2014, 178436.
- Dehghani, M., Z. Montazeri, A. Dehghani, R. A. Ramirez-Mendoza, H. Samet, J. Guerrero, and G. Dhiman, et al. 2020. MLO: multi leader optimizer. International Journal of Intelligent Engineering and Systems 13 (6):364–73. doi:10.22266/ijies2020.1231.32.
- Dehghani, M., Z. Montazeri, O. Parkash Malik, G. Dhiman, and V. Kumar, et al. 2019. BOSA: binary orientation search algorithm. Int J Innov Technol Explor Eng(IJITEE) 9:5306–10.
- Dhiman, G., M. Garg, A. Nagar, V. Kumar, and M. Dehghani, et al. 2021. A novel algorithm for global optimization: rat swarm optimizer. Journal of Ambient Intelligence and Humanized Computing 12 (8):8457–82. doi:10.1007/s12652-020-02580-0.
- Dhiman, G., and V. Kumar. 2018. Emperor penguin optimizer: A bio-inspired algorithm for engineering problems. Knowledge-Based Systems 159:20–50. doi:10.1016/j.knosys.2018.06.001.
- Dhiman, G., and V. Kumar. 2019. Seagull optimization algorithm: theory and its applications for large-scale industrial engineering problems. Knowledge-Based Systems 165:169–96. doi:10.1016/j.knosys.2018.11.024.
- Dhiman, G. 2021. ESA: A hybrid bio-inspired metaheuristic optimization approach for engineering problems. Engineering with Computers 37 (1):323–53. doi:10.1007/s00366-019-00826-w.
- Elhaj, F. A., N. Salim, A. R. Harris, T. T. Swee, and T. Ahmed, et al. 2016. Arrhythmia recognition and classification using combined linear and nonlinear features of ECG signals. Computer Methods and Programs in Biomedicine 127:52–63. doi:10.1016/j.cmpb.2015.12.024.
- Gaurav, D., and A. Kaur. 2019. STOA: A bio-inspired based optimization algorithm for industrial engineering problems. Engineering Applications of Artificial Intelligence 82:148–74. doi:10.1016/j.engappai.2019.03.021.
- Gaurav, D., D. Oliva, A. Kaur, S. V. Krishna Kant Singh, A. Sharma, and K. Cengiz, et al. 2021. BEPO: A novel binary emperor penguin optimizer for automatic feature selection. Knowledge-Based Systems 211:106560. doi:10.1016/j.knosys.2020.106560.
- Gothwal, H., S. Kedawat, and R. Kumar. 2011. Cardiac arrhythmias detection in an ECG beat signal using fast fourier transform and artificial neural network Journal of Biomedical Science and Engineering . 4 (4):289.
- Kiranyaz, S., T. Ince, and M. Gabbouj. 2015. Real-time patient-specific ECG classification by 1-D convolutional neural networks IEEE Transactions on Biomedical Engineering . 63(3):664–75. doi:10.1109/TBME.2015.2468589.
- Kligfield, P., and P. M. Okin. 2007. Prevalence and clinical implications of improper filter settings in routine electrocardiography. The American Journal of Cardiology 99 (5):711–13. doi:10.1016/j.amjcard.2006.09.123.
- Kumar, R., and G. Dhiman. 2021. A comparative study of fuzzy optimization through fuzzy number. International Journal of Modern Research 1 (1):1–14.
- Lee, D. D., and H. S. Seung. 1999. Learning the parts of objects by non-negative matrix factorization. Nature 401 (6755):788–91. doi:10.1038/44565.
- Li, T., and M. Zhou. 2016. ECG classification using wavelet packet entropy and random forests. Entropy 18 (8):285. doi:10.3390/e18080285.
- Martis, R. J., U. R. Acharya, C. M. Lim, K. M. Mandana, A. K. Ray, and C. Chakraborty, et al. 2013. Application of higher-order cumulant features for cardiac health diagnosis using ECG signals. International Journal of Neural Systems 23 (4):1350014. doi:10.1142/S0129065713500147.
- Martis, R. J., U. R. Acharya, H. Adeli, H. Prasad, J. H. Tan, K. C. Chua, C. L. Too, S. W. J. Yeo, and L. Tong, et al. 2014. Computer-aided diagnosis of atrial arrhythmia using dimensionality reduction methods to transform domain representation. Biomedical Signal Processing and Control 13:295–305. doi:10.1016/j.bspc.2014.04.001.
- Mohammad, D., Z. Montazeri, H. Givi, J. M. Guerrero, and G. Dhiman, et al. 2020b. Darts game optimizer: A new optimization technique based on darts game. Int J Intell Eng Syst 13 (5):286–94.
- Mohammad, D., Z. Montazeri, O. P. M. Gaurav Dhiman, R. Morales-Menendez, R. A. Ramirez-Mendoza, A. Dehghani, J. M. Guerrero, and L. Parra-Arroyo, et al. 2020a. A spring search algorithm applied to engineering optimization problems. Applied Sciences 10 (18):6173. doi:10.3390/app10186173.
- Niu, J. 2019. Data sheet. Available at https://www.analog.com/media/en/technical-documentation/data-sheets/ad8232.pdf
- Niu, J., Y. Tang, Z. Sun, and W. Zhang. 2019. Inter-patient ECG classification with symbolic representations and multi-perspective convolutional neural networks. IEEE Journal of Biomedical and Health Informatics 24 (5):1321–32. doi:10.1109/JBHI.2019.2942938.
- Pan, J., and W. J. Tompkins. 1985. A real time QRS detection algorithm. IEEE Transactions on Biomedical Engineering 32 (3):230–36. doi:10.1109/TBME.1985.325532.
- Parola, F., and J. Garcia-Niebla. 2017. Use of high-pass and low-pass electrocardiographic filters in an international cardiological community and possible clinical effects. Adv J Vasc Med 2 (1):034–038.
- Pyakillya, B., N. Kazachenko, and N. Mikhailovsky 2017, October. Deep learning for ECG classification. In Journal of physics: conference series Moscow, Russian Federation, 913. 1.
- Sahoo, S., B. Kanungo, S. Behera, and S. Sabut, et al. 2017. Multiresolution wavelet transform based feature extraction and ECG classification to detect cardiac abnormalities. Measurement 108:55–66. doi:10.1016/j.measurement.2017.05.022.
- Sampath, A., and T. R. Sumithira. 2016. ECG morphological marking using discrete wavelet transform. Intelligent Decision Technologies 10 (4):373–83. doi:10.3233/IDT-160264.
- Sánchez, F. R., and J. G. Cervera. 2019. ECG classification using artificial neural networks. In Journal of Physics: Conference Series El Calafate, Santa Cruz, 1221, 012062. IOP Publishing. 1.
- Satnam, K., K. A. Lalit, A. L. Sangal, and D. Gaurav, et al. 2020. Tunicate swarm algorithm: A new bio-inspired based metaheuristic paradigm for global optimization. Engineering Applications of Artificial Intelligence 90:103541. doi:10.1016/j.engappai.2020.103541.
- Shadmand, S., and B. Mashoufi. 2016. A new personalized ECG signal classification algorithm using block-based neural network and particle swarm optimization. Biomedical Signal Processing and Control 25:12–23. doi:10.1016/j.bspc.2015.10.008.
- Shao, M., G. Bin, S. Wu, G. Bin, J. Huang, and Z. Zhou, et al. 2018. Detection of atrial fibrillation from ECG recordings using decision tree ensemble with multi-level features. Physiological Measurement 39 (9):094008. doi:10.1088/1361-6579/aadf48.
- Singh, S., S. K. Pandey, U. Pawar, and R. R. Janghel, et al. 2018. Classification of ECG arrhythmia using recurrent neural networks. Procedia Computer Science 132:1290–97. doi:10.1016/j.procs.2018.05.045.
- Soorma, N., J. Singh, and M. Tiwari. 2014. Feature extraction of ECG signal using HHT algorithm International Journal of Engineering Trends and Technology (IJETT), 8:454–460 . arXiv preprint arXiv:1403.1660.
- Thomas, N., and D. Mathew. 2016. KNN based ECG pattern analysis and classification. Int J Sci Eng Technol 5 (5):1630–34.
- Tosic, I. 2020. ECG dataset. Available at: http://www.physionet.org
- Tosic, I., and P. Frossard. 2011. Dictionary learning. IEEE Signal Processing Magazine 28 (2):27–38. doi:10.1109/MSP.2010.939537.
- Übeyli, E. D. 2010. Recurrent neural networks employing lyapunov exponents for analysis of ECG signals. Expert Systems with Applications 37 (2):1192–99. doi:10.1016/j.eswa.2009.06.022.
- Yao, Q., R. Wang, X. Fan, J. Liu, and Y. Li, et al. 2020. Multi-class arrhythmia detection from 12-lead varied-length ECG using attention-based time-incremental convolutional neural network. Information Fusion 53:174–82. doi:10.1016/j.inffus.2019.06.024.
- Zhai, X., and C. Tin. 2018. Automated ECG classification using dual heartbeat coupling based on convolutional neural network. IEEE Access 6:27465–72. doi:10.1109/ACCESS.2018.2833841.