
 ?Mathematical formulae have been encoded as MathML and are displayed in this HTML version using MathJax in order to improve their display. Uncheck the box to turn MathJax off. This feature requires Javascript. Click on a formula to zoom.
ABSTRACT
Upper limb movement disorders significantly hamper the ability of impaired to perform basic activities of daily living (ADL). Eating, without doubt, is one of the essential ADLs necessary for human survival. To develop a rehabilitation system meant specifically to assist the hand during eating, an in-depth knowledge of hand motion and the forces/torques produced, during eating is vital. Since, Human Upper Limb (HUL) motion is highly dexterous, its dynamic model can be beneficial for predicting the torques during different eating activities. Four degrees of freedom (DOF), dynamic model of HUL including wrist and elbow joints, focusing on elbow and wrist flexion/extension, forearm pronation/supination, wrist flexion/extension and wrist adduction/abduction is formulated, using Nonlinear AutoRegressive network with eXogenous input Neural Network (NARX-NN), during different eating activities. We conducted an experimental validation involving five different food types and using two types of cutleries. Torque prediction accuracy of the model is determined by comparing predicted values to that of measured load cell torques, for all eating activities and using Root mean square error (RMSE) as a statistical measure, to test the model performance. Torques predicted by the model track the measured torque efficiently.
Introduction
Dysphagia and other eating complications are common among post-stroke patients, leading to complications, such as malnutrition, dehydration, suffocation, and eventually death (Jacobsson et al. Citation2000; Westergren Citation2006; Westergren, Hallberg, and Ohlsson Citation1999; Westergren et al. Citation2002). Albert Westergren et al. (2008,) in their research conducted in an urban hospital in Sweden, considered 162 stroke patients over one year and found that eating difficulties were found in 80%, while 52.5% of patients could not eat without any assistance. The most prominent eating difficulties encountered in the total sample included: ‘eats three-quarters or less of served food’ (60.1%), ‘manipulating food on the plate’ (56.2%), and ‘transport of food to the mouth’ (46.4%).
Hand motion plays a crucial role in eating (feeding). With roughly 30 degrees of freedom (DOFs), this complex structure can perform intricate tasks requiring varying amounts of forces/torques and dexterity. An in-depth knowledge of hand motion and the forces/torques produced during eating is vital to develop a robotic rehabilitation system explicitly meant to assist the hand function during eating. Without sufficient knowledge of the motion of the hand and the forces/torques applied by the hand during eating activity, it is not easy to effectively develop rehabilitation robots for eating activities. Modeling hand motion (i.e., motion and force/torque producing the motion) during eating can be complicated since it is subjected to the type of food (solid, liquid) to be ingested and the type of cutlery (fork or spoon) to be used. A dynamic model of the HUL for estimating the torques produced during different eating activities is pivotal. Dynamic modeling can be beneficial to study the interactions between humans and rehabilitation systems to ensure human safety and enhance human performance. This quantification of the subjects’ effort (torques) can serve as a guideline (or reference torque input) for developing assisted robotic rehabilitation systems meant for eating activities.
Numerous dynamic models have been formulated using mathematical methods like Newton-Euler, Lagrange (Buondonno and De Luca Citation2015; Massa and Vignolo Citation2016; McGrath, Howard, and Baker Citation2017) and Kane’s method (Hirza, Ariff, and Rambely Citation2009; Rambely and Fazrolrozi Citation2012; Rosen et al. Citation2005; Tumit et al. Citation2015), and also Artificial Neural Networks (ANNs). Multi-body mathematical modeling is one of the popular noninvasive methods biomechanists employ to study various human motions and the corresponding torques and forces produced during multiple ADLs. However, the mathematical models can be cumbersome if the system involved has many DOFs and is 3-dimensional, making the inverse dynamics calculation process lengthy and not real-time. This drawback is one of the primary reasons for developing a dynamic model of the limb using the Nonlinear AutoRegressive network with eXogenous input Neural Network (NARX-NN) for instantaneous torque prediction.
Nonlinear Auto-Regressive eXogenous-NN (NARX-NN) models are increasingly used to estimate joint dynamics. The NARX model is based on the linear Auto-Regressive eXogenous (ARX) model, commonly used in time-series modeling. It is a recurrent dynamic network, with feedback connections enclosing several network layers.
A NARX model to effectively decode the shoulder, elbow, and wrist movement based on the EMG signals was developed by (Liu et al. Citation2017). The input training data to the model consisted of the EMG signals from six muscles of the arm, and the angular motion of the shoulder, elbow, and wrist joints measured by an exoskeleton robot called IntelliArm acted as the output training data was recorded, while the subject moved their arm voluntarily only in the horizontal phase. The estimation performance of the model was about 98% for the shoulder, elbow, and wrist joints for both the control group and the impaired group of subjects.
In a similar study by (Raj and Sivanandan Citation2016), a NARX structure-based multiple-layer perceptron neural network (MLPNN) model was proposed for the estimation of elbow joint angle and elbow angular velocity from the Surface Electromyography (SEMG) signals. The training data included the SEMG from the biceps brachii muscle of the human hand as input and the elbow angular displacement and elbow angular velocity during extension and flexion of the elbow as the outputs. For feature extraction from the SEMG, two time-domain parameters, Integrated EMG (IEMG) and Zero Crossing (ZC), were extracted. The NARX MLPNN model was trained using Levenberg-Marquart algorithm. The average regression coefficient value (R) obtained for elbow angular displacement prediction was 0.9641, and the elbow angular velocity prediction was 0.9347. Hence, the proposed model could estimate the elbow joint angle and elbow angular velocity with considerable accuracy.
Several similar studies have successfully been conducted to estimate human dynamics using NARX models and EMG signals (Ayati et al., Citation2015; Akbari and Talasaz Citation2014; Jali et al. Citation2014a, Citation2014b). EMG signal is a commonly used biological signal for human motor intention prediction, which is an essential element in human-robot interaction systems. They have been extensively used for muscle force estimation for the past few decades. Several torque prediction models using EMG as input have also been developed. (Jali et al. Citation2014a) in their study used a two-layer feed-forward network trained using Back Propagation Neural Network (BPNN) to model the EMG signal to elbow torque value. The EMG signal of the biceps brachii muscle act as the input of the ANN, while the elbow torque is the desired output. The ANN model with 20 hidden neurons had an MSE of 0.13807 and average regression of 0.999.
A Hill-type EMG-driven model for ankle-joint estimation was developed by (de Oliveira and Luporini Menegaldo Citation2010). This paper proposed to find individual-specific muscle maximum force Fom by estimating muscle physiological cross-sectional area (PCSA) using ultrasound, which is then multiplied by a reasonable value of maximum muscle-specific tension to obtain the output ankle torque. Three EMGs-Soleus, gastrocnemius medialis, and gastrocnemius lateralis acted as inputs acquired in a series of experiments involving eight adult male subjects, performing an isometric contraction protocol consisting of 10 s step contractions at 20% and 60% of the maximum voluntary contraction level. Isometric torque was simultaneously collected using a dynamometer which acted as the output. A statistically significant reduction in the root means square error was observed when ultrasound obtained Fom was used compared to Fom from the literature.
EMG signals are extensively used in human-robot systems to foresee the purpose of the user’s motion. Acquisition (electrode placement) of these signals is the most critical step as the subsequent processes primarily depend on the quality of the signal (Bi, Feleke, and Guan Citation2019). Electrodes may shift away from the selected part of the muscle (because of dynamic changes in the human body) or may lose contact with the skin’s surface. This reduces the amplitude of the quantified signal and thereby affects prediction precision (Ghapanchizadeh, Ahmad, and Ishak Citation2016; Mesin, Merletti, and Rainoldi Citation2009). Apart from complex pre-processing of EMG signals to extract human motion intentions, EMG signals may not necessarily contain the complete information produced by the motor system, specifically, when a preplanned motion is canceled to avoid any catastrophic results (Mirabella Citation2014; Mirabella and Lebedev Citation2017). Moreover, an EMG signal collected from part of the muscle does not represent the muscle as a whole (Staudenmann et al. Citation2010).
From the previous works discussed, it can be concluded that abundant research has been done to predict human motion dynamics using various methods. However, the novelty of this study, is to utilize user’s wrist and elbow angular motion to estimate the corresponding joint torques, which has not been explored yet. NARX-NN is used to map the dynamic relationship between the arm motion (elbow and wrist motion) and the torques generated. The network is trained using the Levenberg-Marquardt algorithm.
The modeling of HUL during different eating activities, considering different food characteristics and different cutleries, has not been studied in detail yet. Although (Perry and Rosen Citation2006), in their quest to develop a 7-DOF exoskeleton, along with 24 other basic ADLs, included an eating task using fork and spoon, however, the focus of this activity was mainly on analyzing the grasping action of the spoon by a healthy and impaired patient, rather than analyzing the dynamics of HUL, considering various food characteristics and cutleries involved. The proposed NARX model in this study aims to estimate the torques produced in HUL (elbow and wrist joint), focusing on the elbow flexion/extension, forearm pronation/supination, wrist adduction/abduction, and wrist flexion/extension motions, using the user’s wrist and elbow angular motion, while performing different eating activities in a fraction of a second, which has not been studied extensively in the previous works. An experiment is then performed to validate the formulated model by comparing its predicted torques to those measured by the load cells of a robotic system while performing different eating activities using different cutleries. The focus of this study is the torques produced at the wrist and elbow joint only. The torques produced at the shoulder joint will be considered in a future study.
This paper is organized as follows: Section 2 describes the experimental design employed in this study. Section 3 presents the experimental results of the NARX-NN model developed. Section 4 presents the discussion of the results, and lastly, the conclusion is drawn in Section 5.
Materials & Methods
Experimental Setup
An experiment has been performed using a 4-DOF mechanical HUL robotic system (coupled with the human arm) as shown in . All the DOFs possess a revolute configuration. The four joints correspond to the elbow flexion/extension , forearm pronation/supination
, wrist abduction/adduction
and wrist flexion/extension
. All four joints have load cells attached, which are used for the corresponding torque measurement. The electrical unit comprises of NI USB-6211 Data acquisition (DAQ) system, which acts as an interface between the sensors and the MATLAB/Simulink software.
Figure 1. Isometric view of the 4-DOF robotic system (a) CAD drawing (b) during the system.
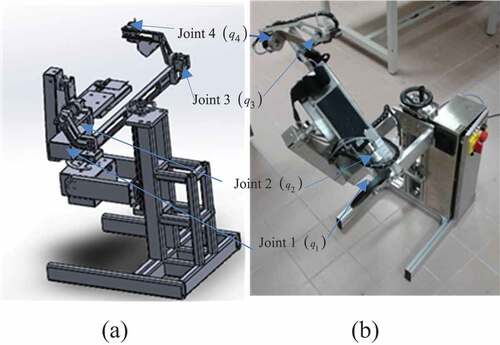
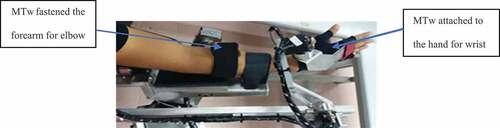
Xsens Motion Tracker (MTw) has been used for capturing the motion of the wrist and elbow joints during various eating activities as shown in . The orientation data obtained in the form of Roll, Pitch & Yaw, corresponds to the elbow flexion/extension , forearm pronation/supination
, wrist radial/ulnar flexion (abduction/adduction)
and wrist extension/flexion
.
Specialized Dynamixel XH430-W350-R servo motors were used for the wrist joint to allow easy movements, resulting in near-zero stiffness and frictional torques. Thus, these parameters were ignored in the model.
Meanwhile, for the elbow joint, the stiffness and frictional torque of the exoskeleton was previously estimated by another researcher (Mounis, Azlan, and Sado Citation2020). The torque measurement calibration accounted for the stiffness and frictional torques for each of the load cells attached at these joints. Thus, the measured torques for our motion study were only due to the human input torque, while the exoskeleton’s inertia, centripetal, Coriolis, and gravitational torques have all been accounted for in our current Kane’s model (Hussain and Azlan Citation2019).
This research received ethical approval from IIUM Research Ethics Committee (IREC) 2019–019.
Experimental Procedure
Five healthy, right-handed subjects, including three males and two females, with an average age of 30 years and an average weight of 70 Kg, volunteered for the experiment. The experiment comprised subjects performing five different eating activities as in our previous HUL motion analysis study (Hussain, Zainul Azlan, and Bin Yusof Citation2018) while wearing the robotic system and Xsens Motion Tracker (MTw) on the upper limb. The experiment was performed without the actuation of the robotic system as it ensured that the torque measured by the load cell is the torque produced by the human effort only. Using the actuated system implied that the machine assists the upper limb during eating; as such, the torque recorded by the sensors would not represent the accurate measure of the torque generated by the HUL while eating. The system with the load cells attached at the four joints measured the torques produced simultaneously, as the subject performed the eating activity, while the Xsens Motion Tracker (MTw) at wrist and elbow joints measured the angles of HUL. Five eating activities, with varied food characteristics, were performed using two different eating tools (fork/spoon) are:
Eating rice (solid) with a spoon.
Eating vegetable salad (solid) with a fork.
Eating noodles (solid) with a fork.
Eating soup broth (viscous liquid) with a spoon.
Eating thick cereal (not viscous) with a spoon.
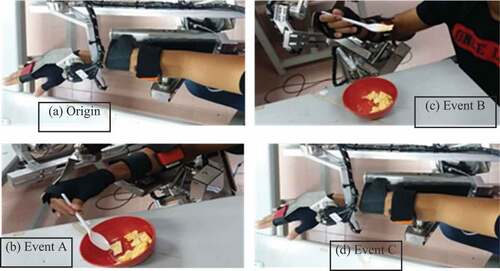
Before the experiment, the subjects were trained to perform eating activities while wearing the robotic system. Each activity consisted of three trials by each participant using either fork or spoon while sitting comfortably on a chair with food on the table. Each trial lasted for around 20 seconds. The average of the three trials has been used for the analysis. Each eating trial is divided into three events, as shown in . All the eating activities begin and conclude with the origin, where the subject’s right upper limb is stationary and rested on the robotic system. The hand and the wrist are in the neutral position, while the elbow joint was extended approximately 100°. Event A occurs when the participant moves their arm from origin to grasp the cutlery. During event B, the participant grasps the cutlery, digs into the food, and, while holding the cutlery, brings the food into the mouth to eat, and event. Event C shows the point when after eating, the participant releases the grip of the cutlery and brings their hand back to the origin.
Figure 2. Three main events were identified during each eating activity: (a) Origin (b) Event A (c) Event B (d) Event D.
Narx Neural Network
The defining equation for the NARX model is
where an
are the input and output of the model at discrete time step t (Billings Citation2013; Design Time Series NARX Feedback Neural Networks – MATLAB & Simulink Citationn.d.). The next value of the dependent output signal
is regressed on previous values of the output signal and previous values of an independent (exogenous) input signal. That is, in this study, the future torque values of the wrist and elbow joints depend on both the previous torque and the previous joint angle values. This network also uses tapped delay lines to store previous values of the
and
sequences. Due to this reason, NARX neural network models can learn more effectively, converge faster, and display better generalizations than other recurrent networks. Numerous studies have proven that NARX neural network successfully uses its output feedback loop to improve its predictive performance in complex time series prediction tasks and consistently outperforms standard neural network-based predictors, such as the Time Delay Neural Networks (TDNN) and Elman architectures (Menezes and Barreto Citation2008). In (Lin, Horne, and Giles Citation1998; Lin et al. Citation1996), authors reported that learning long-term temporal dependencies with gradient-descent techniques is more effective in NARX than in simple multilayer perceptron (MLP) based recurrent models. This happens due to the NARX model’s input vector skillfully built through two tapped-delay lines where one is sliding over the input signal together and the other sliding over the network’s output hence, adding to the network’s stability and performance
In this study, the NARX model was developed using the Neural Network Time Series Toolbox in MATLAB 2019a. The orientation data obtained using Xsens MTw (input training dataset) is used to calculate the corresponding torques produced during elbow flexion/extension , forearm pronation/supination
, wrist flexion/extension
and wrist adduction/abduction
, while performing various eating activities, by performing inverse dynamics of a 3D Kane’s mathematical model of the upper limb formulated in our previous study (Hussain and Azlan Citation2016) and used as output training dataset (target).
Four individual networks were trained corresponding to the torques predicted during elbow flexion/extension , forearm pronation
, wrist adduction/abduction
and wrist flexion/extension
respectively, instead of training a single network for predicting all the four together, which lead to better training results (Section 3.1). Each network consisted of a single input layer consisting of an angle and the output The training, validation, and test data sets in all four networks are 70%, 15%, and 15%, respectively. The total training dataset consisted of an average of 3799 target timesteps, with 2659 timesteps used in training (70%), 570 timesteps for validation (15%) and 570 for testing (15%) for each eating activity. Torques
,
,
and
for each eating activity consisted of an average of 120 input
and output
steps. The number of hidden neurons in the hidden layers and the number of delays in the inputs and outputs are determined by trial-and-error procedure. Here, better training results were obtained by selecting the number of hidden neurons as 10. The delay is 2 s, except for the training of the network for elbow flexion/extension
, the hidden neurons are taken as 2 for cereal, rice and noodle eating activities and 5 for soup and vegetable eating activities. shows the flowchart of input and target training datasets of 4 individual NARX models used for torque estimation during various eating activities.
Unlike, inverse dynamics approach where for each eating activity, the corresponding input angles have to be adjusted, with every change in the input motion activities, the four NARX individual networks have been trained once, for predicting torques of the elbow flexion/extension , forearm pronation/supination
, wrist flexion/extension
and wrist adduction/abduction
, respectively and then, these four networks were used to estimate the torques for all other eating activities.
NARX-NN Training Performance Validation
The performance of the network is assessed based on the Mean Squared Error (MSE) of the training data and Regression (R) between the target outputs and the network outputs. MSE is the average squared difference between outputs and targets. Lower values are better. Zero refers to no error. R values measure the correlation between outputs and targets. An R-value of 1 means a close relationship and 0 is a random relationship. The training stops when the validation error ceases to decrease after specific iterations. The training performance of all four networks is summarized in .
Table 1. Training validation performance of NARX-NNs.
Elbow Flexion/extension Network Training Performance
This network is trained using the soup eating activity data of a subject, where the training dataset includes the angle of elbow flexion/extension as the input (from MTw) and the output target
is the corresponding torque (calculated from Kane’s math model (Hussain and Azlan Citation2019)). The network was generalizable for all eating activities, with a RMSE of 0.009 Nm.
The best validation performance of the network is obtained at 2.0875e-06 at epoch 153. As shown in , the MSE decreased continuously until it achieved the best validation performance.
Regression values of the training, validation and test data are all very close to 1, hence, showing a good correlation between the outputs and targets, as shown in .
The network performance is further validated by checking the error autocorrelation function and input-error cross-correlation function of the network, shown in –. Error autocorrelation function depicts how the prediction errors are related in time. There should only be a single non-zero value of the autocorrelation function for a perfect prediction model on occurring at zero lag. That is, the prediction errors are completely uncorrelated with each other. In this network, some correlations fall within the 95% confidence limit around 0, which is acceptable for a model to be adequate. Similarly, the input-error cross-correlation function illustrates how the errors are correlated with the input sequence . For a perfect prediction model, all the correlations should be zero. All the correlations fall within the confidence limits around zero in this network, as shown in .
shows the time series response of the network. It displays the inputs, targets, and errors versus time. It also specifies which time points were selected for training, testing and validation. Hence, as seen from , the red-colored parts show the time points used as test targets and test outputs, while the yellow fluctuation in error shows the data points where the error occurs.
The network performance of the rest three networks for the prediction of forearm pronation/supination , wrist flexion/extension
and wrist adduction/abduction
is included in the supplementary data.
Experimental Results
The experiment performed using the 4-DOFs prototype robotic system coupled with the human upper limb, was to validate and determine the accuracy of the torques predicted by the formulated NARX-NN in real-time, by comparing to those measured by the loadcells, corresponding to the motions elbow flexion/extension , forearm pronation/supination
, wrist abduction/adduction
and wrist flexion/extension
, during various eating activities.
Cereal activity
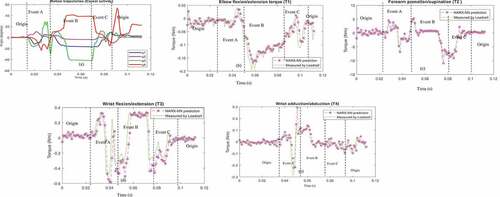
Figure 3. (a) Motion trajectories, (b) Elbow flexion/extension , (c) forearm pronation/supination
, (d) wrist adduction/abduction
, and (e) wrist flexion/extension
comparison plots, during cereal eating activity of Subject 1.
) shows the motion angles of subject 1, during cereal eating activity. The torque validation graphs comparing the NARX-NN model prediction to that of the load cell readings, during cereal eating activity of subject 1 are shown in )-(e). Three main events–event A, event B and event C have been highlighted in the graphs. The experimental results of the other four eating activities are in the supplementary section.
As demonstrated in , during event A as the arm moves to grasp the cutlery, all the joint torques, and the joint angles start fluctuating. During event B, while the subject is eating, the joint torques increase and attain a stable state. During event C, as the subject drops the cutlery and moves his/her hand back to the origin the joint torques, and corresponding angles start fluctuating again and eventually decrease, the torques reach a minimum value as predicted by the NARX-NN model. It was observed from the torque graphs, that the maximum torque was generated, during event B in both wrist and elbow joints, for the majority of the eating activities. Also, the torques produced during forearm supination , torque produced during wrist abduction
and wrist flexion
have opposite direction to that of elbow flexion
. This indicates that the net torque produced by the wrist joint acts in the opposite direction to the torque generated by the elbow joint. Hence, the torques predicted by the NARX-NN model are consistent with the measured torques by the load cells.
It can also be observed that motion trajectories and the torque prediction graph of the other four subjects have shown results. It can be observed that the torque trajectories for all eating activities show similar trends, this can be attributed to the similar basic eating action involved.
Result Validation
Root mean square error (RMSE) is used as a validation means for the performance of the NARX-NN model. It is a standard statistical metric used to measure model performance in various fields. It can be defined as the square root of the mean of the squared differences between the corresponding elements of the forecasts (f) and observations (o). The smaller an RMSE value, the closer forecasted and observed values are (CitationBarnston ((1992)); Chai and Draxler Citation2014)
where is the number of elements.
The average RMSE results of all the subjects are shown in .
Table 2. Average RMSE of torque predictions by NARX-NN for all subjects.
The RMSE results of all torques, which consists of elbow flexion/extension, forearm pronation/supination, wrist adduction/abduction and flexion/extension, indicate that the NARX-NN model formulated fits all the torques well, with an average RMSE of 0.09 Nm, for all eating activities. The estimation performance of the NARX-NN model is appropriate to be used for torque prediction. This result shows that the formulated method successfully modeled the wrist and elbow joints of the HUL, while eating different food types and using various cutlery. It provides an alternative way of predicting joint dynamics using motion data instead of commonly used EMG signals which can be complicated to acquire and process.
The experimental validation results of this study are better in comparison to the ANN model developed by (Jali et al. Citation2014a) with an MSE of 0.13807. NARX-NN model developed by (Jali et al. Citation2014b) to predict EMG-based elbow joint torque has not been validated externally; only network training validation performance is included. Moreover, in (Akbari and Talasaz Citation2014; Jali et al. Citation2014a, Citation2014b), only 1 DOF (elbow flexion) has been considered, while in this study, 4 DOFs have been included while performing five different eating activities, which to our knowledge, has not been done before.
The torques predicted by the NARX-NN model can be helpful to study the dynamics of the wrist and elbow joints while performing various eating activities using different cutleries. This quantification of torques can serve as a guideline in designing and improving the assistive robotic and rehabilitation systems meant for eating activities of post-stroke patients and other patients with upper limb disabilities, where the user’s muscular efforts need to be considered.
The model developed can determine the torques for 4-DOFs of the human upper limb for various eating activities, using two kinds of cutlery, which have not been studied extensively in detail yet. Unlike the present state-of-the-art studies, which have developed NARX-NN models using EMG signals, the user’s wrist and elbow angular motion has been used to estimate the corresponding joint torques in this study. The torques predicted by this model are instantaneous, unlike the inverse dynamic mathematical model, which can be complicated and consumes high computational time and effort.
Conclusion
In this study, a dynamic model of the human upper limb, focusing on the elbow flexion/extension motion, forearm pronation/supination, wrist adduction/abduction, and wrist flexion/extension, has been formulated using NARX-NN, during different eating activities and using various cutlery. This study has certain limitations which can be addressed in future work. 1) For the modeling of the HUL, only wrist and elbow joints have been included, while the fingers have been neglected. 2) Significant improvements are required in the design of the prototype robotic platform used for the model validation. The system should be redesigned as an HUL exoskeleton with the machine joints precisely in line with the axis of human joints to provide more accurate torque results. 3) The load cells can be replaced by the actual torque sensors, which provide more reliable and consistent data.
Figure 4. HUL and robotic system setup showing the placement of MTWs on the forearm & hand.
Figure 5. Flowchart showing input and target training datasets of 4 individual NARX models used for torque estimation during various eating activities.
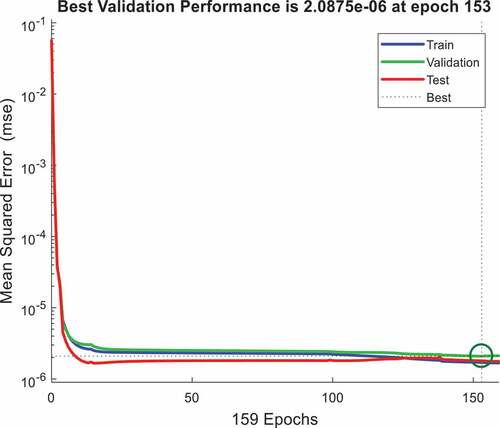
Figure 6. Validation performance of NARX model.
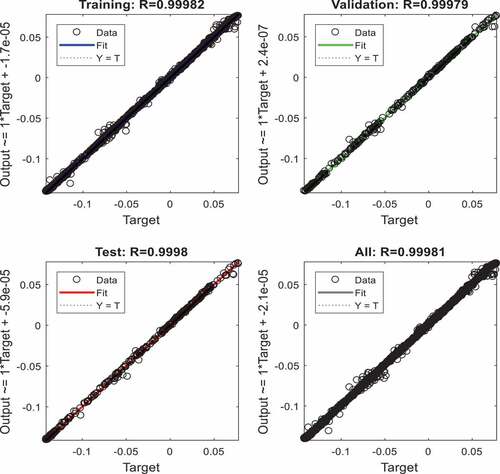
Figure 7. Regression values of NARX model.
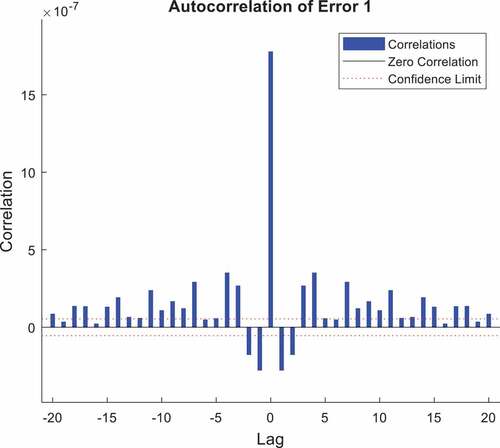
Figure 8. Error autocorrelation function of NARX model.
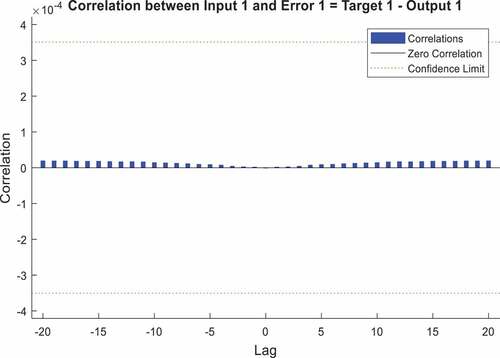
Figure 9. Input-error cross-correlation function of NARX model.
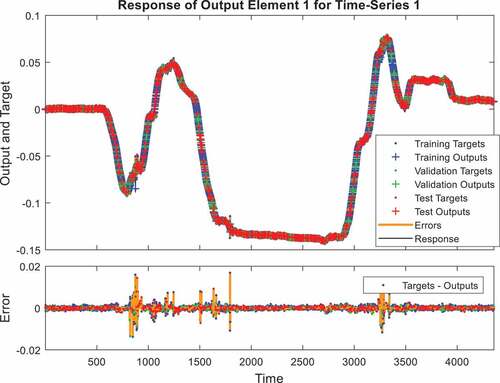
Figure 10. Time series response of NARX model.
Author biographies
ZAKIA HUSSAIN received the B.E degree (Hons.) in Mechatronics engineering from the International Islamic University of Malaysia (IIUM) in 2015 and Master of Science in Mechatronics engineering from IIUM in 2019. She is currently pursuing her Ph. D. in School of Engineering at Monash University Malaysia.
N. Z. Azlan received her bachelor’s degree (Hons.) in Mechatronics Engineering from International Islamic University Malaysia (IIUM) in 2003. She pursued her Masters’s and Ph.D. studies in Mechanical and Control Engineering at Tokyo Institute of Technology, Japan. She is currently a lecturer at IIUM.
Acknowledgments
The authors would like to thank the Ministry of Education, Malaysia, for supporting this research under the Fundamental Research Grant Scheme [FRGS/1/2014/TK03/UIAM/02/8].
Disclosure statement
No potential conflict of interest was reported by the author(s).
Additional information
Funding
References
- Akbari, A. A., and M. Talasaz. 2014. Prediction of above-elbow motions in amputees, based on electromyographic(EMG) signals, using nonlinear autoregressive exogenous (NARX) model, Iran. Journal of Medical Physics. 11:233–2234. accessed January 5, 2018. http://ijmp.mums.ac.ir/article_3095_39c3f7ba3f5ed8d87f5ebdb635a5f1f1.pdf.
- Ayati, M., A. Ehrampoosh, and A. Yousefi-koma. 2015. Estimation of elbow joint angle by NARX model using EMG data, in: 2015 3rd RSI Int. Conf. Robot. Mechatronics, Tehran, Iran, IEEE, pp. 444–49. doi:10.1109/ICRoM.2015.7367825.
- Barnston, A. G. (1992). Correspondence among the correlation, RMSE, and heidke forecast verification measures; refinement of the heidke score. Weather and Forecasting 7:699–709. doi:10.1175/1520-0434(1992)007<0699:CATCRA>2.0.CO;2.
- Bi, L., A. Feleke, and C. Guan. 2019. A review on EMG-based motor intention prediction of continuous human upper limb motion for human-robot collaboration. Biomedical Signal Processing and Control 51:113–27. doi:10.1016/j.bspc.2019.02.011.
- Billings, S. A. 2013. Models for Linear and Nonlinear Systems. In Nonlinear Syst. Identif, 17–59. Chichester, UK: John Wiley & Sons, Ltd. doi:10.1002/9781118535561.ch2.
- Buondonno, G., and A. De Luca. 2015. A recursive Newton-Euler algorithm for robots with elastic joints and its application to control, in: 2015 IEEE/RSJ Int. Conf. Intell. Robot. Syst., Hamburg, Germany, IEEE, pp. 5526–32. doi:10.1109/IROS.2015.7354160.
- Chai, T., and R. R. Draxler. 2014. Root mean square error (RMSE) or mean absolute error (MAE)? -Arguments against avoiding RMSE in the literature. Geoscientific Model Development 7 (3):1247–50. doi:10.5194/gmd-7-1247-2014.
- de Oliveira, L. F., and L. Luporini Menegaldo. 2010. Individual-specific muscle maximum force estimation using ultrasound for ankle joint torque prediction using an EMG-driven Hill-type model. Journal of Biomechanics 43 (14):2816–21. doi:10.1016/j.jbiomech.2010.05.035.
- Design Time Series NARX Feedback Neural Networks - MATLAB & Simulink, (n.d.). accessed January 4, 2018. https://www.mathworks.com/help/nnet/ug/design-time-series-narx-feedback-neural-networks.html
- Ghapanchizadeh, H., S. A. Ahmad, and A. J. Ishak. 2016. Recommended surface EMG electrode position for wrist extension and flexion, in: ISSBES 2015 - IEEE Student Symp. Biomed. Eng. Sci. By Student Student, Shah Alam, Malaysia, pp. 108–12. doi:10.1109/ISSBES.2015.7435877.
- Hirza, F., M. Ariff, and A. S. Rambely. 2009. Modeling of an arm via Kane ’ s Method : an inverse dynamic approach. European Journal of Scientific Research 33:358–64.
- Hussain, Z., and N. Z. Azlan. 2016. KANE’s method for dynamic modeling, in: 2016 IEEE Int. Conf. Autom. Control Intell. Syst., Selangor, Malaysia, IEEE, pp. 174–79. doi:10.1109/I2CACIS.2016.7885310.
- Hussain, Z., and N. Z. Azlan. 2019. 3-D dynamic modeling and validation of human arm for torque determination during eating activity using Kane’s Method, Iran. Journal of Science and Technology, Transaction of Mechanical Engineering. doi:10.1007/s40997-019-00299-8.
- Hussain, Z., N. Zainul Azlan, and A. Z. Bin Yusof. 2018. Human Hand Motion Analysis during Different Eating Activities., Appl. Bionics and Biomechanics 2018:8567648. doi:10.1155/2018/8567648.
- Jacobsson, C., K. Axelsson, P. O. Osterlind, and A. Norberg. 2000. How people with stroke and healthy older people experience the eating process. Journal of Clinical Nursing 9 (2):255–64. doi:10.1046/j.1365-2702.2000.00355.x.
- Jali, M. H., T. A. Izzuddin, Z. H. Bohari, H. Sarkawi, M. F. Sulaima, M. F. Baharom, and W. M. Bukhari. 2014a. Joint torque estimation model of sEMG signal for arm rehabilitation device using artificial neural network techniques. ARPN Journal of Engineering and Applied Sciences 9:1170–76. accessed October 4, 2017. www.arpnjournals.com
- Jali, M. H., T. A. Izzuddin, Z. H. Bohari, M. F. Sulaima, and H. Sarkawi. 2014b. Predicting EMG based elbow joint torque model using multiple input ANN neurons for arm rehabilitation, in: Proc. - UKSim-AMSS 16th Int. Conf. Comput. Model. Simulation, UKSim 2014, Cambridge, UK, IEEE, pp. 189–94. doi:10.1109/UKSim.2014.78.
- Lin, T., B. G. Horne, and C. L. Giles. 1998. How embedded memory in recurrent neural network architectures helps learning long-term temporal dependencies. Neural Networks 11:861–68. doi:10.1016/S0893-6080(98)00018-5.
- Lin, T., B. G. Horne, P. Tiňo, and C. L. Giles. 1996. Learning long-term dependencies in NARX recurrent neural networks. IEEE Transactions on Neural Networks 7 (6):1329–38. doi:10.1109/72.548162.
- Liu, J., S. H. Kang, D. Xu, Y. Ren, S. J. Lee, and L. Q. Zhang. 2017. EMG-Based continuous and simultaneous estimation of arm kinematics in able-bodied individuals and stroke survivors. Frontiers in Neuroscience 11:480. doi:10.3389/fnins.2017.00480.
- Massa, E., and S. Vignolo. 2016. Newton-Euler, Lagrange and Kirchhoff formulations of rigid body dynamics: A unified approach. Meccanica 51 (8):2019–23. doi:10.1007/s11012-015-0333-7.
- McGrath, M., D. Howard, and R. Baker. 2017. A Lagrange-based generalised formulation for the equations of motion of simple walking models. Journal of Biomechanics 55:139–43. doi:10.1016/J.JBIOMECH.2017.02.013.
- Menezes, J. M. P., and G. A. Barreto. 2008. Long-term time series prediction with the NARX network: An empirical evaluation, 3335–43. in: Neurocomputing, Elsevier. doi:10.1016/j.neucom.2008.01.030.
- Mesin, L., R. Merletti, and A. Rainoldi. 2009. Surface EMG: The issue of electrode location. Journal of Electromyography and Kinesiology 19 (5):719–26. doi:10.1016/j.jelekin.2008.07.006.
- Mirabella, G. 2014. Should I stay or should I go? Conceptual underpinnings of goal-directed actions. Frontiers in Systems Neuroscience 8:206. doi:10.3389/fnsys.2014.00206.
- Mirabella, G., and M. А. Lebedev. 2017. Interfacing to the brain’s motor decisions. Journal of Neurophysiology 117 (3):1305–19. doi:10.1152/jn.00051.2016.
- Mounis, S. Y. A., N. Z. Azlan, and F. Sado. 2020. Assist-as-needed robotic rehabilitation strategy based on z-spline estimated functional ability. IEEE Access 8:157557–71. doi:10.1109/ACCESS.2020.3019450.
- Perry, J. C., and J. Rosen, Design of a 7 degree-of-freedom upper-limb powered exoskeleton. (2006). accessed August 27, 2018. http://brl.ee.washington.edu/eprints/176/
- Raj, R., and K. S. Sivanandan. 2016. Elbow joint angle and elbow movement velocity estimation using NARX-multiple layer perceptron neural network model with surface EMG time domain parameters. The Journal of Back and Musculoskeletal Rehabilitation 1:1–11. doi:10.3233/BMR-160525.
- Rambely, A. S., and Fazrolrozi. 2012. A six-link kinematic chain model of human body using Kane’s Method. International Journal of Modern Physics: Conference Series 09:59–67. doi:10.1142/S2010194512005107.
- Rosen, J., J. C. Perry, N. Manning, S. Burns, and B. Hannaford. 2005. The human arm kinematics and dynamics during daily activities - Toward a 7 DOF upper limb powered exoskeleton, 2005 Int. Conf. Adv. Robot. ICAR ’05, Proc. 2005, Seattle, WA, USA, 532–39. doi:10.1109/ICAR.2005.1507460.
- Staudenmann, D., K. Roeleveld, D. F. Stegeman, and J. H. van Dieen. 2010. Methodological aspects of SEMG recordings for force estimation - A tutorial and review. Journal of Electromyography and Kinesiology 20 (3):375–87. doi:10.1016/j.jelekin.2009.08.005.
- Tumit, N. P., A. S. Rambely, S. Bmt, B. M. Deros, and M. A. Arumugam, A full body mathematical model of an oil palm harvester, in: 2015: p. 060019. doi:10.1063/1.4931346.
- Westergren, A. 2006. Detection of eating difficulties after stroke: A systematic review. International Nursing Review 53 (2):143–49. doi:10.1111/j.1466-7657.2006.00460.x.
- Westergren, A., I. R. Hallberg, and O. Ohlsson. 1999. Nursing assessment of dysphagia among patients with stroke. Scandinavian Journal of Caring Sciences 13 (4):274–82. accessed October 31, 2017. http://www.ncbi.nlm.nih.gov/pubmed/12032925.
- Westergren, A., M. Unosson, O. Ohlsson, B. Lorefält, and I. R. Hallberg. 2002. Eating difficulties, assisted eating and nutritional status in elderly (≥65 years) patients in hospital rehabilitation. International Journal of Nursing Studies 39:341–51. doi:10.1016/S0020-7489(01)00025-6.