
 ?Mathematical formulae have been encoded as MathML and are displayed in this HTML version using MathJax in order to improve their display. Uncheck the box to turn MathJax off. This feature requires Javascript. Click on a formula to zoom.
ABSTRACT
Prostate cancer (PCa) is a complicated cancer with high level of unexplained variability that might affect the patient’s health-related quality of life (HRQoL). Using 2670 patients’ information with 433 measures per patient, our objective is to identify the minimal set of important variables which can predict 1-year follow-up HRQoL for PCa patients while adding interpretability to the proposed model. We address three problems of dimension reduction, prediction, and interpretability by first developing deep neural networks on top of a clustering algorithm to extract minimal set of important variables of baseline visit. Second, we build a model to predict a 1-year follow-up of HRQoL for PCa patients using the extracted important baseline variables. Third, we utilize Bayesian networks method to provide insights into the proposed model results to discover the relationship between patients’ baseline variables and their 1-year follow-up satisfaction. The results support the use of the proposed machine-learning technique as an essential tool in identifying potential baseline variables for predicting 1-year HRQoL. Furthermore, our approach to interpret the findings will help to establish guidelines for a better shared decision-making platform for PCa patients.
Introduction
According to the World Health Organization (CitationWHO), prostate cancer (PCa) is the second most prevalent cancer in men, with 1.3 million cases per year worldwide (Wild et al. Citation2020). There are a variety of modalities for treating PCa, including surgery, radiotherapy, chemotherapy, hormone therapy, and active surveillance. All of these treatments are associated with risks of potential side effects (Luszczak et al. Citation2020) that can have negative consequences on patients’ health-related quality of life (HRQoL). HRQoL outcomes have emerged as a major consideration when making treatment decisions for PCa given that the 5-year survival rate for most men with local or regional PCa is nearly 100% (McLean*, Cunningham, and Ricke Citation2019). Thus, being able to predict (we use both predict and estimate terms interchangeably, although predict is often equated only with classification prediction not regression) patients’ HRQoL prior to treatment would presumably help patients make an informed decision. For example, problems with urinary function that occur in men with localized PCa are likely the result of treatment. This is supported by evidence from comparison group and cross-sectional studies (Eton and Lepore Citation2002) across different groups in which men treated with radical prostatectomy (RP) had almost twice as often as men treated with external beam radiotherapy (EBR). However, RP is generally associated with decreased risk of overall and cancer-specific mortality in high-risk patients (Chen et al. Citation2017). Given said that, we need accurate prognostic information about patients’ future HRQoL prior to treatment. To achieve this goal, we either need clinician judges or predictive models. According to several studies (Kattan et al. Citation2013; Walz et al. Citation2007), clinicians are often poor judges of future patient outcomes while predictive models perform significantly better.
Developing predictive models for post-PCa treatment (henceforth post-treatment) HRQoL poses several challenges. For one, the causes of HRQoL dysfunction (e.g. UI (UI) and erectile dysfunction) are multifactorial (Eastham, Scardino, and Kattan Citation2008; Michl et al. Citation2006), which complicates the development of predictive models. Being multifactorial typically includes four broad categories: physical, functional, social, and emotional well-being. Therefore, HRQoL refers to when a medical condition or its treatment affects one’s usual or expected physical, social, and emotional well-being (Cella Citation1995). As a result, an appropriate measurement of HRQoL should incorporate the patient’s perspective while capturing physical, social, and mental well-being. Besides being multifactorial, modeling HRQoL outcomes is also challenging because of the longitudinal data sets. While cross-sectional data can provide a snapshot of a patient’s behavior and perceptions, longitudinal studies help to clarify the trajectory of HRQoL in men treated for PCa. The key problems are long-term patient engagement/recruitment and attrition rate. High occurrence of attrition rates across longitudinal data is the concern as it can rapidly deplete the longitudinal data validity. From prediction point of view, the analysis is complicated by complex correlation structures, irregularly spaced visits of the patients and missing data. Confusion on these points can lead to non-comprehensive and inaccurate analysis. Among the numerous techniques that are used to create predictive (O’Callaghan et al. Citation2017), regression-based methods are the most popular because of their commonality in many statistical software packages and being relatively fast to perform. However, when it comes to big data analysis, the regression-based methods may not have enough appropriate validation in terms of accuracy and speed. Therefore, having a variable extraction/selection method that can identify the influential variables out of big data set is necessary. Furthermore, most of the research studies, to-date, predicting HRQoL do so at the population level (Delobel et al. Citation2017; Kim et al. Citation2020; Schaake et al. Citation2018), and present results based on the entire observation group. However, patients require individual-level prediction models in order to make treatment decisions. In other words, variables marked with high global importance may not be relevant to predict an individual’s risk of negative side effects.
Despite the fact that such complex (black-box) prediction models are able to achieve high validation results (R-squared in our study), they lack an explanation of the prediction outcome. In May 2018, General Data Protection Regulation requested industries to have a meaningful way to explain any automated decision and after that the interpretability of machine-learning models has been receiving huge attention. Noteworthy is that when using predictive analytics in critical domains such as predicting HRQoL outcomes in PCa patients, the explanation power is noticeably more important than the model predictive power.
Despite a variety of clinical interpretation approaches having been explored (Wheat et al. Citation2009), no work has yet explored the potential of Bayesian Networks (BNs) as an explanation framework to be used on top of Black-box prediction. BNs (Pearl Citation1988), which typically reflect the problem structure, can be used to generate explanations of the predictions we already have.
To the best of our knowledge, this is the first study to use variable extraction on cluster-based population that can predict the 1-year HRQoL outcomes prior to treatment as a regression prediction not only classification prediction and the first to create the insight into prediction method using BNs for PCa patients.
Related Work
Complex predictive models were used intensively in different areas including health care sector. Despite the fact that such complex (black-box) models are able to achieve high accuracy, they lack an explanation of the predicted outcome. Thus, there is still an enormous potential to discover new patterns from massive amount of data and transform those new black-box models into human-understandable knowledge.
The following literature successfully applied machine-learning techniques to make predictions on HRQoL, in the context of PCa, from various domains ranging from UI (Grivas et al. Citation2018; Rossi et al. Citation2018; Sadahira et al. Citation2019; Schaake et al. Citation2018; Tienza et al. Citation2018), sexual (Kim et al. Citation2020), fecal incontinence (Carrara et al. Citation2018; Delobel et al. Citation2017; Rossi et al. Citation2018), rectal bleeding (Delobel et al. Citation2017; Rossi et al. Citation2018), etc., and methodologies from different regression-based models (Multivariate logistic regression (Rossi et al. Citation2018; Sadahira et al. Citation2019), Binary logistic regression (Grivas et al. Citation2018; Kim et al. Citation2020)), artificial neural network (ANN) (Carrara et al. Citation2018), etc. Summary of papers describing predicting tools relating to patient-reported outcomes (PROs) (September 2016 – July 2019) is shown in . lists the models for predictive tools in PROs and their explanations. The literature explained here is the extension of two main surveys that introduce the existing approaches in the literature in more detail. The first one (O’Callaghan et al. Citation2017) covers July 2007 to September 2016 and the second one (Shariat et al. Citation2008) explores papers prior to July 2007. Most of the existing research have had three main limitations: 1) Using population-level data set for training the model and presenting the results based on the entire observation group. However, the model should consider patients in minority group as well. Otherwise, it might underestimate the variables that affect similar patients which are in a relatively small group but with similar output. 2) Developing black-box machine-learning models which are not interpretable that contribute negatively toward establishing trust and confidence in their predictions for stakeholders. 3) They usually only consider two domains of HRQoL, mostly UI and sexual dysfunction. To the best of our knowledge, there are no previous studies that address the problem of estimating a more comprehensive set of side effects, such as bowel and hormonal domains. Therefore, the objective of this study is to present a computational mechanism that fills the gap in research on predicting post-treatment HRQoL for patients with PCa while maintaining the interpretability of the model so that patients and physicians can understand the decisions made by the proposed prediction model.
Table 1. Summary of papers describing predicting tools relating to pros (September 2016 – July 2019). ng (not given), pros (patient-reported outcomes).
Table 2. Explanations of the models for predictive tools in pros. ng (not given), pros (patient-reported outcomes).
Given our objective, in this paper, we present a framework to predict and interpret post-treatment (1-year follow-up) HRQoL outcomes for PCa patients out of high dimensional data set. We utilized the k-means algorithm (Jain Citation2010; MacQueen et al. Citation1967) to put similar patients in the same clusters and avoid fitting the model on the entire training data. In the next step, we used deep neural networks (DNNs) (Rosenblatt Citation1961) to fit each cluster separately and identify the most influential variables in each cluster. This will prevent underestimation of any small group of similar patients, which might have same influential variables. Furthermore, we develop a combined BN method to provide interpretation of prediction model for a variety of HRQoL domains. After aggregating the top results for the patient groups, our results provide insightful recommendations for improving patient experiences. The rest of the work is organized as follows. We present the data set and Expanded Prostate Cancer Index Composite-26 (EPIC-26) measurement method first. Then the proposed methods for prediction and explanation are demonstrated. After that we show the results and insights. Finally, we present remarks and discussions, conclusions, and an outlook for future research.
Quality of Life in PCa Patients and Data
To demonstrate our approach to predicting post-treatment HRQoL for patients with PCa based on their pre-treatment prognostic factors, we are using data collected as part of the Alberta PCa Research Initiative (APCaRI). The APCaRI is enrolling the population of men undergoing diagnosis for PCa in Calgary and Edmonton, Canada. These men were referred for a diagnostic biopsy based on conventional clinical guidelines (e.g., elevated PSA and/or abnormal digital rectal examination) with average age 64.75 years at baseline visit. We filtered the data to include only those patients without a prior PCa diagnosis (i.e. excluding recurrence), which resulted in 2,670 patients and involving 433 unique variables collected prior to treatment (i.e. a study “baseline”). The variables include demographic characteristics were collected during the in-person interview prior to biopsy, clinical data from laboratory, pathology, or pre-treatment reports. Given that we want to predict 1-year HRQoL, we further excluded those patients who did not have 1-year data completed. This process resulted in a data set of 1,214 patients.
Desired output,
We used the EPIC-26 to measure HRQoL. The EPIC-26 is a common and valid PRO measure of HRQoL for men with PCa (Szymanski et al. Citation2010). The items of EPIC-26 are responded to using either a 4- or 5-item Likert scale. Responses are transformed to a 0–100 scale, higher scores measured represent better HRQoL (Szymanski et al. Citation2010). Items are grouped into one of five domains by using the available scoring instructions: urinary incontinence (UI) (4 items), urinary irritative/obstructive (UIO) (4 items), bowel (B) (6 items), sexual (S) (6 items), and hormonal (H) (5 items) (Wei et al. Citation2000). As in (Sharifi et al. Citation2019) presented, there are 26 items in which one item (i.e. “Overall, how big a problem has your urinary function been for you during the last 4 weeks?”) is not included in any domain. For each domain, item scores are averaged to calculate the domain summary score (Szymanski et al. Citation2010). In this study, independent variables are the unique 433 variables, and dependent variables or desired outcomes are EPIC-26 variables which are UI, UIO, bowel (B), sexual (S), and hormonal (H).
Cluster-based DNN (CB-DNN) Prediction Model
Patients’ severity for each of the EPIC-26 domains is a temporal continuous score between 0 and 100, with 0 indicating the highest severity and 100 indicating the least. All of the dependent variables and most of the independent variables are temporal whose states change with time (i.e. the variable values are different in baseline and 1-year follow-up). CB-DNN aims at predicting the EPIC-26 values for next year (1-year follow-up) for the patients at their baseline visit in which the independent variables at baseline visit should be used. Considering that the dimension of the data set is large, the CB-DNN algorithm starts by finding the most important variables which can have adequate description of the data by having an acceptable prediction of the quality of life for 1-year follow-up. The method’s steps are detailed below.
Firstly, a K-means (Jain Citation2010; MacQueen et al. Citation1967) is used to group the data points into K clusters according to the distance measure. The Euclidean distance is calculated as where
is the number of dimensions (433 in our study),
and
are two patients in a d-dimensional Euclidean space. The main idea is to define
centroids, one for each cluster. These centroids should be placed as much as possible far away from each other. The Elbow method (Ng Citation2012) is used to find the best number of the clusters,
. It is a visual method to determine approximately the best number of clusters. The EPIC-26 values in 1-year follow-up is a highly imbalanced data. demonstrates that there are 7.4%, 12.19%, 3.62%, 37.56%, and 3.79% in first three quartiles (i.e. less than 75) in 1-year follow-up for UI, UIO, B, S, and H, respectively. Therefore, we prevent the classification model to overlook these more severe responses which are minority by using clustering. Patients which are similar (i.e. less satisfied patients) would probably end up in the same cluster. Then considering these clusters separately for variable extraction will help to find the influential variables on minority responses as well as on majority responses in which include the patients in the less severe quartile (i.e. there EPIC-26 values are more than 75).
Table 3. Statistical characteristics of patients for all the epic-26 domains score quartiles in 1-year follow-up. epic-26 domains are UI, UIO, b (bowel), s (sexual) and h (hormonal).
Second, for each resulting cluster from the previous step, a DNN is trained to extract the important variables per cluster. Deep learning aims at learning variable hierarchies with variables from higher levels formed by the composition of lower level variables. In this paper, we use the DNN as a conventional multi-layer perceptron (MLP) (Rosenblatt Citation1961). Variable importance in DNN is calculated using the Gedeon (Gedeon Citation1997) method. It is a modification of Garson method (David Garson Citation1991) which the hidden layer weights are partitioned into components associated with each input node. After that, the percentage of all hidden node weights assigned to a particular input node is used to measure the importance of that input variable. Mainly it is based on using the weight matrix of the trained neural network itself to determine which inputs are significant. In our study, the top important variables which are considered are those with importance more than 0.85 (it is selected by try and error to get the most efficient threshold which the extracted variables does not exceed 10 variables) in at least one of the clusters.
DNN is well suited for APCaRI data set of this study. There are two main reasons for this. In the first place, DNN can help to provide abstract representations which are generally invariant to most local changes of the input which is helpful if other hospitals want to reproduce our results based on their data set. Moreover, In the context of categorical concepts, given that most of the independent variables in this study are either binary or ordinal, DNN is helpful as it can detect categories that cover different kinds of concepts. In DNN, the tanh (hyperbolic tangent) activation function, ADADELTA optimizer (Zeiler Citation2012), and five hidden layers with 100 neurons each were used. For improving generalization I specify the input layer dropout ratio as 0.2.
Thirdly, The important variables extracted from previous step which is for patients in baseline visit are fed as input to an ANNs for each domain separately. The 1-year follow-up EPIC-26 variables are considered as the output of the ANN. The data were divided into 70%, 15%, and 15% for training, validation, and testing, respectively. The ANN used for prediction is a simple MLP with 3 layers containing 10 neurons in the hidden layer. The network has 10 inputs which are the minimal set of important variables extracted by each of the methods, and one output is a continuous number for EPIC-26 domain value. We used the logistic function as the activation function inside the neurons with backpropagation as the learning mechanism. The ANN model is used as nonlinear prediction model in the last step of the proposed model. That is because unlike traditional machine-learning models such as linear or logistic regression which has been used widely in the literature for predicting quality of life (Delobel et al. Citation2017; Dess et al. Citation2018; Kim et al. Citation2020), ANN models can learn more complex nonlinear data representation.
Note that, as we are facing a big data problem, in order to use all processing power of the system, fast and distributed, both clustering and DNN implementation are on H2O 2018c. H2O is a framework in the machine learning for predictive and descriptive analytic that can be stand alone or executed on top of the Hadoop (Borthakur Citation2007) or spark (Zaharia et al. Citation2010) frameworks. H2O handles billions of data rows in-memory by using in-memory compression (Landry and Angela Citation2018), it also enables the connection between R, an open source statistical programming environment, with a big data infrastructure which is Hadoop Distributed file System.
A. Evaluation Metric
As we are predicting a continuous value for each of the 5 domains in EPIC-26, the performance of the proposed techniques is evaluated using the coefficient of determination (). It gives a quantitative assessment of the ability of the model to explain the variance in unseen data by measuring how well the model is compared to the average model. This is a well-established measure of the strength of the relationship between the predicted outcome and actual outcome in regression problem. This coefficient is defined as:
where denotes the value of the outcome variable predicted by the proposed method for the
data point.
and
are the actual value of the outcome variable and its mean respectively. The coefficient of determination can have the value from 0 to 100%, higher coefficient values suggest that the predicted values and the actual values are more the same. In this study, the minimally important differences (MID) reported in (Skolarus et al. Citation2015) is applied before calculating the
values. MID provides a measure of the smallest change in the EPIC-26 values that patients perceive as important. All errors less than the MID value of the EPIC-26 domain are considered as zero for calculating coefficient of determination.
BN-based Explanation Model
A BN (Pearl Citation1988) represents a class of graphical models as a Directed Acyclic Graph (DAG) over (a set of random variables). Such that random variables are associated with the nodes in DAG. In this section, we develop our method for learning the structure of a BN. It is important to note that we adhere to the standard assumption behind the Naïve Bayes rule which mentions that there is no interaction between the input variables given the outcome (Barik and Honorio Citation2019; Kocaoglu, Shanmugam, and Bareinboim Citation2017; Spirtes et al. Citation2000; Yang-Bo and Geng Citation2008).
EPIC-26 may be modeled using one BN for each of the five domains. The structure of the BN prediction model is for two time slices: baseline visit and 1-year follow-up visit. All the nodes included in the model are temporal except in_002 (How would you classify your race?) whose state does not change with time. It is also noteworthy to mention that some of the temporal nodes such as UI, UIO, bowel, sexual and hormonal variables are included with their 1-year follow-up values, while others extracted from CB-DNN are considered with their baseline values. The reason behind utilizing the BN as the base for the proposed explanation model is to find the relationship between the baseline variables proposed by CB-DNN as important variables that can predict the 1-year EPIC-26 values, and 1-year EPIC-26 output values. Therefore, time lags in each BN model include a 1-year lag in the effect of variables extracted by CB-DNN on 1-year EPIC-26 output values. Baseline variables extracted by CB-DNN are reported in , for UI, UIO, B, S, and H, respectively. As we only need the arcs which end up to 1-year EPIC-26 value, we do not need the latent variables to reduce the conditional probability tables for the BN. However, we applied some minor changes on BN learning process to get the best explanation results for our model.
Algorithm 1: Greedy BN Algorithm
Input: a data set from
, an initial DAG
(usually the empty DAG),
Schwarz Information Criterion as score function
Output: the DAG that maximizes
Compute the score of
,
Set
Hill climbing: repeat while
for every possible arc addition, deletion, or reversal in
compute the score of the modified DAG
if
if
Tabu search: for up to Tabu list size:
repeat step 3 but choose the DAG
if
Max-min hill climbing (MMHC): First add an arc from the most important variable extracted by CB-DNN to its correspondence EPIC-26 domain to the DAG
repeat step 3 but for arc addition only add
Table 4. Top 10 important variables from baseline visit selected by CB-DNN for predicting 1-year follow-up UI along with their definitions. .
Table 5. Top 10 important variables from baseline visit selected by CB-DNN for predicting 1-year follow-up UIO along with their definitions. .
Table 6. Top 10 important variables from baseline visit selected by CB-DNN for predicting 1-year follow-up bowel along with their definitions.
Table 7. Top 10 important variables from baseline visit selected by CB-DNN for predicting 1-year follow-up sexual along with their definitions.
Table 8. Top 10 important variables from baseline visit selected by CB-DNN for predicting 1-year follow-up hormonal along with their definitions.
The implementation of BN learning which is proposed in this study for explaining the results of the CB-DNN is shown in Algorithm 1. Steps 1 and 2 are initialization phases followed by a hill-climbing search (step 3), which is then refined with Tabu search (Glover Citation1997; Russell Stuart and Norvig Citation2009) in step 4 and MMHC (Tsamardinos, Brown, and Aliferis Citation2006) in step 5. The variations of each algorithm have been used in large parts of the literature on score-based BN structure learning (Friedman Citation1997; Tsamardinos, Brown, and Aliferis Citation2006). Arc additions and deletions is being used in hill climbing to explore the neighborhood of the current candidate to find if there is any DAG that increases the score over . Being an optimization heuristic, hill climbing cannot guarantee theoretically that
is a global maximum. In order to escape from local maximum, tabu search is applied. This greedy search tries to move away from
by allowing additional local moves (up to tabu list size). If a new DAG with a score larger than
is found in the process, that DAG is taken as the new
and it reverts to hill climbing in step 3. There is a possibility that no such DAG is found by tabu search. MMHC then tries again to escape the local maximum by first adding a mandatory arc from the most important variable extracted in CB-DNN part to the outcome of interest and then updating as follows. MMHC algorithm can be categorized as a hybrid method (Tsamardinos, Brown, and Aliferis Citation2006). It combines two main approaches that exist for learning BNs, search-and-score approach (Cooper and Herskovits Citation1992) and constraint-based approach (Spirtes et al. Citation2000). It first uses a local discovery algorithm to learn the skeleton of BNs and then a greedy Bayesian-scoring hill-climbing search. If the DAG that was resulted with tabu search, if any, was indeed the global maximum, the assumption is that MMHC will also identify it as the optimal DAG, in which case the algorithm terminates. For sake of complexity and considering the objective of this study, we treat the proposed model in a way that keeps only arc for
in which
is any of the baseline variables extracted from CB-DNN and
is the EPIC-26 domain which the current BN is trained for. In some cases, those that end up in the final structure might have dependency between themselves.
Results
CB-DNN determines important variables at the global level (i.e. per patient group), while BN can provide reasons at individual patient level. By combining the global and local method, we achieve the objective of the research: to make good HRQoL prediction for 1-year follow-up with high score while maintaining decent degree of interpretability. In the following sections, we show a comparative analysis of the proposed methods, which helps both physicians and patients to understand the results and get the right insights toward better treatment options and outcomes. In this section, we first show the variable importance results and model fitting obtained from CB-DNN; then, we evaluate the performance of BN method by presenting individual explanations for the patients by extracting the relationship between variables; finally, we summarize the top explanations/reasons for both approaches.
A. CB-DNN Results
Initially, we have 2,670 patients which have a prior PCa diagnosis data in the data set, after filtering pre-treatment factors with other required pre-processing, as explained in section 3 the data set becomes 1214 patients with 433 variables. The final neural network model includes a total of 1214 patients who have both baseline visit data and 1-year follow-up data. The predictive model, in which we use baseline visit data extracted by CB-DNN to predict 1-year follow-up data, has good performance which the average R-squared () value of 0.74 on the test data. The performance metrics of predictive model (i.e. R-squared value) on the testing data are shown in . Given the proposed solution which is regression prediction (i.e. predicting the continuous value of the output variable) not only classification prediction, and given that only pre-treatment variables are used to predict post-treatment HRQoL values, and furthermore managing to improve data reduction (in the variable extraction step), maintaining the accuracy level with average
value of 0.74 would be acceptable.
Figure 1. R-squared between predicted and actual values in EPIC-26 domains. EPIC-26 Domains are a) UI b) UIO c) Bowel d) sexual and e) Hormonal.
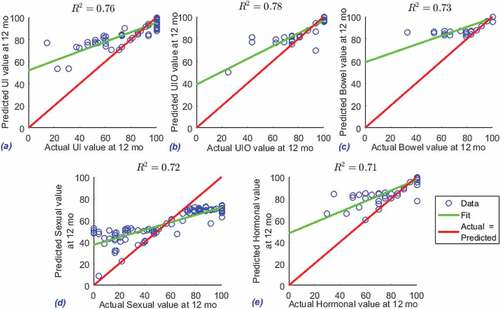
The top 10 important variables selected by CB-DNN for EPIC-26 domains are reported in , for UI, UIO, B, S, and H, respectively. The top variables from baseline which are predictable for 1-year follow-up for each of the EPIC-26 domains are the following questions: a) UI: Usual activities? (Answer is one of the following options: 1, I have no problems doing my usual activities | 2, I have slight problems doing my usual activities | 3, I have moderate problems doing my usual activities | 4, I have severe problems doing my usual activities | 5, I am unable to do my usual activities); b) UIO: %of first RMZ core involved? (Answer is a numerical value); c) Bowel: Number of positive cores biopsied from LMZ? (Answer is one of the following options: 1, 1 | 2, 2 | 3, Fragmented core tissue); d) Sexual: How would you describe your ability to reach orgasm (climax)? (Answer is one of the following options: 1, Very poor to none | 2, Poor | 3, Fair | 4, Good | 5, Very good; e) Hormonal: How much is your Gland volume (cc)? (Answer is a numerical value).
These variables reflected by these questions point to the most important variable extracted by CB-DNN out of 400 variables which is predictable for each of the EPIC-26 domain. For example, the model discovered that the ability to reach orgasm in baseline visit is the most predictable variable for 1-year follow-up in terms of Sexual quality of life. The results which are presented may vary in a different hospital and with different variables saved in patients databases. Hospital administrators may use their own database to obtain insights from the proposed method.
The following sections are presenting the evaluation of a) the reliability of the CB-DNN model, b) the result in prediction section.
Evaluation Results for CB-DNN, extracting important variables: As per expert guide, there is no list of variables in baseline pre-treatment visit that are confirmed to be influential in 1-year follow-up EPIC-26 values. However, we do have the non-temporal influential variables for calculating EPIC-26 domain. Such that, for each EPIC-26 domain in current (baseline or follow-up) visit, the scores of variables listed in (Sharifi et al. Citation2019) are averaged to calculate the domain summary score. Thus, we evaluate the performance of the CB-DNN in following two experiments:
Extracting important variables from baseline data which are influential in baseline EPIC-26 domain values;
Extracting important variables from 1-year follow-up data which are influential in 1-year follow-up EPIC-26 domain values.
Table 9. The items related to each EPIC-26 domain. EPIC-26 Domains are UI, UIO, B (Bowel) and S (sexual).
Evaluation Results for CB-DNN, 1-year follow-up prediction:
B. BN-based Explanation Model Results
In personalized healthcare, keeping track of patient medical history or even extracting important variables which can predict the outcome of interest is not the only objective for medical practitioners to maintain, but also they need to know the interaction between the important variables and the outcome of interest. Using the idea behind BN, practitioners can analyze the results from previous step and record patient’s important variable for enhancing patient’s quality of life. In addition, through necessary corrective actions, practitioners can get insights from the interaction between the variables in the past and provide better service for future patients. We applied the proposed hybrid BN model to all the patients but now only considering the top 10 variables from baseline visit extracted by CB-DNN and the 1-year follow-up EPIC-26 outcome variables to provide causal explanations for the relationship between the extracted variables and outcome of interest. Given that EPIC-26 outcome is a continuous value between 0 and 100, we need to quantify it before applying the BN model. So we have divided the patients into happy and unhappy groups based on their EPIC-26 outcome values. We call them unhappy because they are the ones with EPIC-26 value less than the mean value of the patients EPIC-26 values excluding those with the value of 100. Looking at test data in , which the distribution of the data is the same as whole data set, we see that the data set is imbalanced in terms of the number of patients with their EPIC-26 value is 100. Therefore, to calculate the mean value for each of the domains in EPIC-26, we have excluded those whose number of their EPIC-26 is 100. The happy group is defined as the ones whose EPIC-26 value is more than mean of the patients EPIC-26 values excluding those with the value of 100. For each of the 5 domains in EPIC-26, we build a BN to capture the relationship of most important variables which impact patients’ quality of life/EPIC-26 value after 1 year. The BN models produce two outcomes which impact the patient’s EPIC-26 value. The results are shown in ), for UI, UIO, B, S, and H, respectively. The BNs in these figures only show the interaction between two extracted variables and the outcome of interest, the rest of the interactions that do not affect the EPIC-26 analysis are excluded. The BN results help both medical practitioners and patients to understand the relationship between the predicted outcome in baseline visit and quality of the life for the patients after 1 year. It is worth mentioning that when the BN model is ready, we can start inferring to have answers in terms of probability for our questions or concerns. Now we are taking hormonal domain as an example. From the CB-DNN model, the R-squared value that 10 extracted variables from baseline visit can predict the patients hormonal severity value after 1 year is 0.71. In , the BN identified 2 locally important variables which can explain how these variables in baseline visit can affect their 1-year follow-up severity.
Figure 2. BNs explanation for UI. eq_004 (Usual activities?) has the following options:1, I have no problems doing my usual activities | 2, I have slight problems doing my usual activities | 3, I have moderate problems doing my usual activities | 4, I have severe problems doing my usual activities | 5, I am unable to doing my usual activities. im_001 (Bone scan?) has the following options: 1, yes | 2, No.
Figure 3. BNs explanation for UIO. ep_015 (Abdominal/Pelvic/Rectal pain?) has the following options: 1, No problem | 2, Very small problem | 3, Small problem | 4, Moderate problem | 5, Big problem. ib_064 (% of first RMZ core involved?) is a numerical variable which those less than the mean and greater than the mean are labeled with 0 and 1 respectively.

Figure 4. BNs explanation for Bowel (B). ib_042 (Number of positive cores biopsied from LMZ?) has the following options: 1, 1 | 2, 2 | 3, Fragmented core tissue. ep_012 (Increased frequency of bowel movements?) has the following options: 1, No problem | 2, Very small problem | 3, Small problem | 4, Moderate problem | 5, Big problem.
Figure 5. BNs explanation for Sexual (S). ep_017 (How would you describe your ability to have an erection during the last 4 weeks?) has the following options: 1, Very poor to none | 2, Poor | 3, Fair | 4, Good | 5, Very good. ep_018 (How would you describe your ability to reach orgasm (climax) during the last 4 weeks?) has the following options: 1, Very poor to none | 2, Poor | 3, Fair | 4, Good | 5, Very good.
Figure 6. BNs explanation for Hormonal (H). eq_002 (Mobility?) has the following options: 1, I have no problems in walking about | 2, I have slight problems in walking about | 3, I have moderate problems in walking about | 4, I have severe problems in walking about | 5, I am unable to walk about. ib_008 (Gland volume?) is a numerical variable which those less than the mean and greater than the mean are labeled with 0 and 1 respectively.
After inferring the BN learned for Hormonal, of these 2 variables (i.e. eq_002 (Mobility?) and ib_008 (Gland volume?)), we can see that those whose mobility (eq_002) is better have less probability to be unhappy for their hormonal dysfunction after one year. As such, if they have no problems in walking about (option 1 for eq_002) the probability to be unhappy after 1 year is only 0.1, while the probability for those who have moderate problems in walking about (option 3 for eq_002) is 0.38.
Note that although the Hormonal variable is conditioned on 2 variables, we perform the query based on the evidence which is available on only one variable (eq_002). It is straightforward to make our evidence richer by asking more specific question about individual patients. depicts the results for what-if analysis to build scenarios on 5 randomly selected patients which are unhappy after 1 year in UI, UIO, B, S, and Hormonal. For example, considering patient V (the fifth patient), the proposed BN method identified two locally important variables in baseline visit which can explain why patient V is unhappy in terms of hormonal quality of life after 1 year. After inspecting the current values of these 2 variables, we can see that this patient has a gland volume greater than mean (option 1 for ib_008) and have moderate problems in walking about (option 3 for eq_002). After performing What-If analysis, the BN shows that if patient V answered 1 (i.e. I have no problems in walking about) instead of 3 for question eq_002, the chances that he would be happy after 1 year for his hormonal quality of life would increase by 30%. We can better explain the impact of the extracted baseline visit variables with CB-DNN on patient’s unhappiness by using this scenario-based what-if analysis that BN provides. As mentioned earlier, in this study, we are using baseline variables which are pre-treatment. However, the use of such a tool is not only useful for pre-treatment suggestion but can also be directly transferred to explain treatment-related variables in a way to predict which treatment might help to improve HRQoL outcomes. The practitioners and patients can use these guidelines for future corrective measures and actions.
Table 10. What-If Analysis Scenarios for Five Patients.
By comparing the top variables between two methods in , we figured that BN has changed the ranking among those 10 variables extracted by CB-DNN. This suggests us that although some variables might be important in terms of predictability power they have, it cannot be guaranteed that they will have the same rank in terms of explainability power which is suggested by BN. Our finding provides solutions to peek inside the proposed black box and not only extracting the variable importance in a novel way for longitudinal data but also making the results interpretable.
Table 11. Variable importance ranking comparisons between global algorithm CB-DNN and local BNs.
Remarks, Limitations, and Ongoing Work
Longitudinal data provides an excellent opportunity to study PCa patient’s treatment satisfaction and HRQoL-related outcomes over time. However, the analysis of such data (i.e. pre-processing and designing of predictive and interpretable models) is a challenging task due to the complex and hidden data structures, unevenly spread out visits (i.e. not all patients are evaluated at exactly the same time), missing data, and mixtures of time-varying and static measures that may affect the outcome in a nonlinear complex relationships. Most of the literature focused on increasing the predictive power of the prediction models without investigating the ability of the model to explain the prediction. The contribution of this study is designing a model to predict the 1-year follow-up outcomes for the PCa patients with the highest degree of predictive power and with a decent ability to describe the predicted outcomes in terms of the most important influential input collected in the data set. This description will help practitioners and patients to share decisions about patient treatments that might affect certain aspects of their daily life routine and eventually their quality of life. Popular predictive models interpretation methods such as local interpretable model-agnostic explanations (LIME) technique, do not provide explanations of the predicted outcome based on nonlinear relationship. For example, LIME explains the predictions of a given classifier by learning a linear model locally around the prediction. The output of LIME is a list of explanations, describing the effect of each variable on the prediction of a data sample. This provides linear local interpretability, and it also allows to determine which variable changes will have the most impact on the prediction. The LIME is trained on small perturbations of the original instance and should only provide a local approximation. This presents a severe limitation of this method as it holds itself to the quality of the very nearby data points form a linear relationship.
However, in reality, the linear relationship is seldom found especially in the case of longitudinal data with such a complex structure of the data set under test (APCaRI data set). In this paper, we adopt the BN algorithm to learn the hierarchical prediction explanation based on the most influential factors extracted by the CB-DNN algorithm. The CB-DNN algorithm provides a better classification per group as it performs stratified prediction that focuses on each group of the patients and thus reduces the problem of highly imbalanced data.
The limitation of this study is that we adhere to the assumption behind the Naïve Bayes rule which is there is no interaction between the input variables given the outcome. We assume that to be able to interpret the prediction results in the variable domains. This limitation is the special focus of our future work as we believe that the nature of the interaction between the input variables toward the outcome is not linear and also may not be independent given the output. To address this limitation, we may adapt several orthonormal transformations of the variables and study the effect of these transformations on the predictive and interpretability power of the model.
Conclusion
In this paper, we construct a framework to extract important influential variables for PCa EPIC-26 prediction, learn, and interpret PCa patient data in a novel way. We demonstrated how to fit the patient data with the proposed CB-DNN algorithm and make accurate predictions of patients’ HRQoL outcomes. Furthermore, our framework uses a hybrid BN to provide explanations for CB-DNN, which is a black-box algorithm, resulting to represent the probability that the patient will feel a particular outcome in 1-year follow-up based on the baseline visit variables. To the best of our knowledge, this work is the first one to combine machine-learning model and explanation method for analyzing PCa data regarding their HRQoL measure and considering all of the EPIC-26 domains outcomes. The CB-DNN allows stakeholders to extract important variables out of the big data set that might affect the outcome of interest in longitudinal data. The implementation of our methods helps identify the key drivers of patient 1-year follow-up severity, in baseline visit, which the patient is newly diagnosed with PCa. Besides that, the proposed method is also the first that is predicting the continuous value for 1-year follow-up EPIC-26 outcomes, not only general classifications. Therefore, the framework generally can provide guidance for medical practitioners to navigate through the baseline variables to complex future outcomes. Despite the aforementioned strengths of this study and the successful implementation with real-world data, it has its own limitations which can be improved as new directions of future work. To start with, the proposed method is validated in a real-world big data set, but it can be externally validated as well to improve the trust of the end users. Second, the choice of the proposed hybrid model for the BN needs theoretical evidences and needs more investigation. Third, we want to use this framework for improvement in the feedback for their HRQoL outcome even considering their treatment choice. With considering the treatment-related variables, we can advice the future patients on which treatment they should select regarding their HRQoL preferences, this part is still under investigation. Overall, Despite these limitations, this work can contribute to ongoing effort to adopt good predictability and interpretability practices when considering HRQoL outcomes in patients with PCa.
Disclosure Statement
No potential conflict of interest was reported by the author(s).
Additional information
Funding
References
- Barik, A., and J. Honorio. 2019. Learning bayesian networks with low rank conditional probability tables. Advances in Neural Information Processing Systems 32.
- Borthakur, D. 2007. The Hadoop distributed file system: architecture and design. Hadoop Project Website 110 (2007):0 21.
- Carrara, M., E. Massari, A. Cicchetti, T. Giandini, B. Avuzzi, F. Palorini, C. Stucchi, G. Fellin, P. Gabriele, V. Vavassori, et al. 2018. Development of a ready-to-use graphical tool based on artificial neural network classification: Application for the prediction of late fecal incontinence after prostate cancer radiation therapy. International Journal of Radiation Oncology* Biology* Physics 102(5):0 1533–2583. doi:10.1016/j.ijrobp.2018.07.2014.
- Cella, D. F. 1995. Measuring quality of life in palliative care. Seminars in Oncology 22:73–81.
- Chen, L., L. Qingfang, Y. Wang, Y. Zhang, and M. Xuelei. 2017. Comparison on efficacy of radical prostatectomy versus external beam radiotherapy for the treatment of localized prostate cancer. Oncotarget 8 (45):0 79854. doi:10.18632/oncotarget.20078.
- Cooper, G. F., and E. Herskovits. 1992. A Bayesian method for the induction of probabilistic networks from data. Machine Learning 9 (4):0 309–347. doi:10.1007/BF00994110.
- David Garson, G. 1991. Interpreting neural-network connection weights. AI Expert 60 (4):0 46–51.
- Delobel, J.-B., K. Gnep, J. David Ospina, V. Beckendorf, C. Chira, J. Zhu, A. Bossi, T. Messai, O. Acosta, J. Castelli, et al. 2017. Nomogram to predict rectal toxicity following prostate cancer radiotherapy. PloS one 12(6):0 e0179845. doi:10.1371/journal.pone.0179845.
- Dess, R. T., H. E. Hartman, N. Aghdam, W. C. Jackson, P. D. Soni, A. E. Abugharib, S. Suy, N. B. Desai, Z. S. Zumsteg, R. Mehra, et al. 2018. Erectile function after stereotactic body radiotherapy for localized prostate cancer. BJU International 121(1):0 61–68. doi:10.1111/bju.13962.
- Eastham, J. A., P. T. Scardino, and M. W. Kattan. 2008. Predicting an optimal outcome after radical prostatectomy: The trifecta nomogram. The Journal of Urology 179 (6):0 2207–2211. doi:10.1016/j.juro.2008.01.106.
- Eton, D. T., and S. J. Lepore. 2002. Prostate cancer and health-related quality of life: A review of the literature. Psycho-Oncology: Journal of the Psychological, Social and Behavioral Dimensions of Cancer 11 (4):0 307–326. doi:10.1002/pon.572.
- Friedman, N. 1997. Learning belief networks in the presence of missing values and hidden variables. Icml 97:125–133.
- Gedeon, T. D. 1997. Data mining of inputs: Analysing magnitude and functional measures. International Journal of Neural Systems 08 (2):0 209–218. doi:10.1142/S0129065797000227.
- Glover, F. 1997. Tabu search and adaptive memory programming—advances, applications and challenges. In Interfaces in computer science and operations research, 1–75. : Springer, Boston, MA.
- Grivas, N., R. van der Roest, D. Schouten, F. Cavicchioli, C. Tillier, A. Bex, I. Schoots, W. Artibani, S. Heijmink, and H. Van Der Poel. 2018. Quantitative assessment of fascia preservation improves the prediction of membranous urethral length and inner levator distance on continence outcome after robot-assisted radical prostatectomy. Neurourology and Urodynamics 37 (1):0 417–425. doi:10.1002/nau.23318.
- Jain, A. K. 2010. Data clustering: 50 years beyond k-means. Pattern Recognition Letters 31 (8):0 651–666. doi:10.1016/j.patrec.2009.09.011.
- Kattan, M. W., Y. Changhong, A. J. Stephenson, O. Sartor, and B. Tombal. 2013. Clinicians versus nomogram: Predicting future technetium-99m bone scan positivity in patients with rising prostate-specific antigen after radical prostatectomy for prostate cancer. Urology 81 (5):0 956–961. doi:10.1016/j.urology.2012.12.010.
- Kim, L. H. C., A. Patel, N. Kinsella, M. T. A. Sharabiani, Ap Dafydd, D., and Cahill, D. 2020. Derfel Ap Dafydd, and Declan Cahill. Association between preoperative magnetic resonance imaging–based urethral parameters and continence recovery following robot-assisted radical prostatectomy. European Urology Focus 6 (5):1013–1020.
- Kocaoglu, M., K. Shanmugam, and E. Bareinboim. 2017. Experimental design for learning causal graphs with latent variables. Advances in Neural Information Processing Systems 30: 7018–7028.
- Landry, M., and B. Angela. 2018. Machine learning with r and h2o. Mountain View, CA https://h2o-release.s3.amazonaws.com/h2o/rel-zeno/2/docs-website/h2o-docs/booklets/RBooklet.pdf.
- Luszczak, S., C. Kumar, V. Krishna Sathyadevan, B. S. Simpson, K. A. Gately, H. C. Whitaker, and S. Heavey. 2020. Pim kinase inhibition: Co-targeted therapeutic approaches in prostate cancer. Signal Transduction and Targeted Therapy 50 (1):0 1–10.
- MacQueen, J. Some methods for classification and analysis of multivariate observations. In Proceedings of the fifth Berkeley symposium on mathematical statistics and probability, 1, 281–297. Oakland, CA, USA, 1967.
- McLean*, D., K. Cunningham, and W. Ricke. 2019. Mp68-20 establishing a negative feedback loop between fibroblast growth factor 5 and androgen receptor in prostate cancer. The Journal of Urology 2010 (4):0 e983–e983.
- Michl, U. H. G., M. G. Friedrich, M. Graefen, A. Haese, H. Heinzer, and H. Huland. 2006. Prediction of postoperative sexual function after nerve sparing radical retropubic prostatectomy. The Journal of Urology 176 (1):0 227–231. doi:10.1016/S0022-5347(06)00632-X.
- Mylona, E., O. Acosta, T. Lizee, C. Lafond, G. Crehange, N. Magné, S. Chiavassa, S. Supiot, J. David Ospina Arango, B. Campillo-Gimenez, et al. 2019. Voxel-based analysis for identification of urethrovesical subregions predicting urinary toxicity after prostate cancer radiation therapy. International Journal of Radiation Oncology* Biology* Physics 104(2):343–354. doi:10.1016/j.ijrobp.2019.01.088.
- Ng, Andrew. 2012. Clustering with the k-means algorithm. Machine Learning.
- O’Callaghan, M. E., J. C. Elspeth Raymond, A. D. Vincent, D. R. Kerri Beckmann, M. J, J. Zalcberg, J. Millar, J. Zalcberg, J. Millar, J. Zalcberg, et al. 2017. Tools for predicting patient-reported outcomes in prostate cancer patients undergoing radical prostatectomy: A systematic review of prognostic accuracy and validity. Prostate Cancer and Prostatic Diseases 20(4):0 378–388. doi:10.1038/pcan.2017.28.
- Pearl, J. 1988. Morgan Kaufmann series in representation and reasoning. Probabilistic reasoning in intelligent systems: networks of plausible inference. San Mateo, CA, US: Morgan Kaufmann.
- Rosenblatt, F. Principles of neurodynamics. perceptrons and the theory of brain mechanisms. Technical report, CORNELL AERONAUTICAL LAB INC BUFFALO NY, 1961.
- Rossi, L., R. Bijman, W. Schillemans, S. Aluwini, C. Cavedon, M. Witte, L. Incrocci, and B. Heijmen. 2018. Texture analysis of 3d dose distributions for predictive modelling of toxicity rates in radiotherapy. Radiotherapy and Oncology 129 (3):0 548–553. doi:10.1016/j.radonc.2018.07.027.
- Russell Stuart, J., and P. Norvig. 2009. Artificial intelligence: A modern approach. NJ: Prentice Hall.
- Sadahira, T., Y. Mitsui, M. Araki, Y. Maruyama, K. Wada, K. Edamura, Y. Kobayashi, M. Watanabe, T. Watanabe, and Y. Nasu. 2019. Pelvic magnetic resonance imaging parameters predict urinary incontinence after robot-assisted radical prostatectomy. LUTS: Lower Urinary Tract Symptoms 11 (3):0 122–126. doi:10.1111/luts.12245.
- Schaake, W., A. van der Schaaf, L. V. van Dijk, A. C. M. van den Bergh, J. A. Langendijk, and R. Hurst. 2018. Development of a prediction model for late urinary incontinence, hematuria, pain and voiding frequency among irradiated prostate cancer patients. PloS one 13 (7):0 e0197757. doi:10.1371/journal.pone.0197757.
- Shariat, S. F., P. I. Karakiewicz, C. G. Roehrborn, and M. W. Kattan. 2008. An updated catalog of prostate cancer predictive tools. Cancer: Interdisciplinary International Journal of the American Cancer Society 113 (11):0 3075–3099. doi:10.1002/cncr.23908.
- Sharifi, F., E. Mohammed, T. Crump, and B. Far. A cluster-based machine learning model for large healthcare data analysis. In International Conference on Big Data Innovations and Applications, Istanbul, Turkey, 92–106. Springer, 2019.
- Skolarus, T. A., R. L. Dunn, M. G. Sanda, P. Chang, T. K. Greenfield, M. S. Litwin, H. Dan, M. Regan, L. Hembroff, D. Hamstra, et al. 2015. Minimally important difference for the expanded prostate cancer index composite short form. Urology 85(1):0 101–106. doi:10.1016/j.urology.2014.08.044.
- Spirtes, P., C. N. Glymour, R. Scheines, and D. Heckerman. 2000. Causation, prediction, and search. Cambridge, MA: MIT press.
- Szymanski, K. M., J. T. Wei, R. L. Dunn, and M. G. Sanda. 2010. Development and validation of an abbreviated version of the expanded prostate cancer index composite instrument for measuring health-related quality of life among prostate cancer survivors. Urology 76 (5):0 1245–1250. doi:10.1016/j.urology.2010.01.027.
- Tienza, A., J. E. Robles, M. Hevia, R. Algarra, F. Diez-Caballero, and J. I. Pascual. 2018. Prevalence analysis of urinary incontinence after radical prostatectomy and influential preoperative factors in a single institution. The Aging Male 21 (1):0 24–30. doi:10.1080/13685538.2017.1369944.
- Tsamardinos, I., L. E. Brown, and C. F. Aliferis. 2006. The max-min hill-climbing Bayesian network structure learning algorithm. Machine Learning 65 (1):0 31–78. doi:10.1007/s10994-006-6889-7.
- Walz, J., A. Gallina, P. Perrotte, C. Jeldres, Q.-D. Trinh, G. C. Hutterer, M. Traumann, A. Ramirez, S. F. Shariat, M. McCormack, et al. 2007. Clinicians are poor raters of life-expectancy before radical prostatectomy or definitive radiotherapy for localized prostate cancer. BJU International 100(6):0 1254–1258. doi:10.1111/j.1464-410X.2007.07130.x.
- Webpage: APCARI. Home - apcari. https://apcari.ca/
- Webpage: H2O.ai. Home - h2o.ai. URL https://www.h2o.ai/
- Wei, J. T., R. L. Dunn, M. S. Litwin, H. M. Sandler, and M. G. Sanda. 2000. Development and validation of the expanded prostate cancer index composite (epic) for comprehensive assessment of health-related quality of life in men with prostate cancer. Urology 56 (6):0 899–905. doi:10.1016/S0090-4295(00)00858-X.
- Wheat, J. C., R. C. Hedgepeth, H. Chang, L. Zhang, and D. P. Wood Jr. 2009. Clinical interpretation of the expanded prostate cancer index composite-short form sexual summary score. The Journal of Urology 182 (6):0 2844–2849. doi:10.1016/j.juro.2009.08.088.
- Wild C, E Weiderpass, Stewart, B.W. 2020 . World cancer report: cancer research for cancer prevention. (IARC Press), 978-92-832-0447-3. http://publications.iarc.fr/Non-Series-Publications/World-Cancer-Reports/World-Cancer-Report-Cancer-Research-For-Cancer-Prevention-2020
- World Health Organization. Cancer. URL https://www.who.int/health-topics/cancer#tab=tab_1.
- Yang-Bo, H., and Z. Geng. (2008 Nov). Active learning of causal networks with intervention experiments and optimal designs. Journal of Machine Learning Research 90:2523–2547.
- Zaharia, M., M. Chowdhury, M. J. Franklin, S. Shenker, and I. Stoica. 2010. Spark: Cluster computing with working sets. HotCloud 100 (10–10):0 95.
- Zeiler, M. D. 2012. Adadelta: An adaptive learning rate method. arXiv preprint arXiv:1212.5701.