
 ?Mathematical formulae have been encoded as MathML and are displayed in this HTML version using MathJax in order to improve their display. Uncheck the box to turn MathJax off. This feature requires Javascript. Click on a formula to zoom.
ABSTRACT
The liver tumor is one of the most foremost critical causes of death in the world. Nowadays, Medical Imaging (MI) is one of the prominent Computer Vision fields (CV), which helps physicians and radiologists to detect and diagnose liver tumors at an early stage. Radiologists and physicians use manual or semi-automated systems to read hundreds of images, such as Computed Tomography (CT) for the diagnosis. Therefore, there is a need for a fully-automated method to diagnose and detect the tumor early using the most popular and widely used imaging modality, CT images. The proposed work focuses on the Machine Learning (ML) methods: Random Forest (RF), J48, Logistic Model Tree (LMT), and Random Tree (RT) with multiple automated Region of Interest (ROI) for multiclass liver tumor classification. The dataset comprises four tumor classes: hemangioma, cyst, hepatocellular carcinoma, and metastasis. Converted the images into gray-scale, and the contrast of images was improved by applying histogram equalization. The noise was reduced using the Gabor filter, and image quality was improved by applying an image sharpening algorithm. Furthermore, 55 features were acquired for each ROI of different pixel dimensions using texture, binary, histogram and rotational, scalability, and translational (RST) techniques. The correlation-based feature selection (CFS) technique was deployed to obtain 20 optimized features from these 55 features for classification. The results showed that RF and RT performed better than J48 and LMT, with an accuracy of 97.48% and 97.08%, respectively. The proposed novel framework will help radiologists and physicians better diagnose liver tumors.
Introduction
The liver is an important human body organ to perform basic functions. World Health Organization (WHO) reported that the liver is an organ with a high tumor rate, which is the cause of death (Meng, Tian, and Bu Citation2020; Seo et al. Citation2019). It is very challenging to diagnose tumors at an early stage of the disease. Early tumors detection can help physicians to plan early treatment accurately and timely (Almotairi et al. Citation2020; Nasiri, Foruzan, and Chen Citation2018).
The tumor is the most significant cause of death in most countries. According to the American Cancer Society, more than 1.8 million tumor cases were diagnosed in 2020 (Siegel et al. Citation2020). It has been stated that liver tumor is the most common form of tumor that causes death in men, while women are the sixth (A et al. Citation2011). According to the WHO, nearly 1.45 million people died due to these tumors in a year. This ratio increased by a rate of 2% per annum (A et al. 2011; Almotairi et al. Citation2020; Siegel et al. Citation2020). There are two types of liver tumors, one of which is malignant and the other is benign. Liver tumors are also referred to as hepatic tumors (Ntomi, Paspala, and Schizas Citation2018).
Medical imaging tools are available to support radiologists using imaging modalities such as CT, MRI, mammography, ultrasound and Positron Emission Tomography (PET). The liver CT scan, which involves hundreds of slices, is manually examined by radiologist, which is time-consuming and requires concentration (Shuang and Wang Citation2020). Mostly manual diagnosis causes inaccurate evaluation. (Kavur, Kuncheva, and Selver Citation2020; Zhou et al. Citation2019).
Conventional techniques are not providing efficient results to diagnose tumors. Most of the CT images contained same intensities of organs connected with liver CT scan (Z. Z. Wang Citation2018). Therefore, deploying the latest state-of-the-art techniques in this domain is necessary. CV techniques have become popular in recent decades. Early diagnosis and treatment of various diseases become easy using CV algorithms. (Pang et al. Citation2019; Rajalakshmi, Snekhalatha, and Baby Citation2019; Zhou et al. Citation2019).
The CV-based techniques allow efficient and effective detection of multiple tumors in the human body. However, they face many limitations (Kavur, Kuncheva, and Selver Citation2020). There is a need for an automated system to improve early diagnosis of liver tumor (Bi et al. Citation2017; Gruber et al. Citation2019), (Almotairi et al. Citation2020; Gruber et al. Citation2019; Jinglu and Zhang Citation2008). Although tumor classification is a difficult task, it helps physicians to detect tumors accurately and timely. Therefore, an automated system is required to diagnose the liver tumor early.
Literature Review
This section describes the detailed methods and approaches employed by identifying different researchers for liver tumor segmentation and classification. It covers detail of different algorithms, techniques deployed using CV approaches.
A Machine Learning-based classification model was proposed to classify liver tumors into benign and malignant tumor classes. The proposed model employed the Otsu threshold segmentation approach on ten optimized features were extracted from 256 hybrid features to deploy ML classifiers along with 10-fold cross-validation. Multilayer Perception (MLP) classifier produces 99% results among SVM, RF, and J.48 (Naeem et al. Citation2020). A CNN-based segmentation model was proposed to segment hepatocellular carcinoma and metastasis. Dataset was preprocessed using Gaussian filter noise removal, standardization, and down sampling. The model produced promising results with dice value of 0.689, based on three quantitative indicators: Dice, Hausdorff distance, and an average distance for validation. (Meng, Tian, and Bu Citation2020). Furthermore, a hybrid hash-based CNN model proposed using hash function to extract features from images. The model produced promising results to classify tumors into benign and malignant classes (Özyurt et al. Citation2019). A CNN based multi-organ classification model was proposed. It is useful tool for diagnosis of cancer. It helps for early detection of liver cancer and avoid unnecessary biopsies process (Kaur, Chauhan, and Aggarwal Citation2021). A semantic image segmentation model based was introduced to classify hepatic tumors using the 3D-IRCADb-01 CT images dataset. Segnet based deep convolutional encode-decoder model used VGG-16 to classify tumor (Almotairi et al. Citation2020). Similarly, Segnet-based deep learning model was used to classify liver lesions into benign and malignant classes. For lesion segmentation, the model used (SEGNET – UNET – ABC Algorithm), and (LENET-5/ABC Algorithm) used for lesion classification. The Dice index, correlation coefficient, and Jacquard index for the Radiopaedia dataset were 0.96, 0.968, and 0.962, respectively. (Ghoniem Citation2020). A fully automated CAD system was proposed to diagnose heptacecullar carcinoma. ANN produced 98.4% accuracy, while SVM produced 98.7% accuracy (Li and Zhu Citation2020). A Computer Aided Diagnosis System proposed to classify benign & malignant tumors using adaptive threshold liver segmentation. Texture features extracted using Curvelet Transform. Tumor region Segmented using Fuzzy C-mean clustering which produces 94.3% accuracy (Kumar and Moni Citation2010). Different approaches for image retrieval based on color, shape and texture features. Another important method is Content based Image Retrieval (CBIR) (Arora and Aggarwal Citation2018).A modified fully connected Neural Network was used to diagnose tumors using variable pooling kernel scheme for segmentation (Pang et al. Citation2019). Furthermore, a watershed based segmentation approach was adopted to diagnose liver tumor. Unsupervised Fuzzy C-Mean algorithm using adaptive threshold and morphological operations produces promising results (Anter and Hassenian Citation2019). Similarly, a multichannel & multiscale CNN model proposed to diagnose liver lesion into lesion and non-lesion classes with three fold cross validation the model produced 82% accuracy (Todoroki et al. Citation2017). Furthermore, a novel level-set unsupervised fuzzy C-Mean Clustering method was adopted to diagnose hepatocellular carcinoma tumors using the LiTS CT images dataset. A 2D-UNET model used for Liver Segmentation (Zheng et al. Citation2018). Similarly, a liver tumor segmentation and classification model proposed using level-set segmentation and adaptive threshold. Fuzzy centroid region growing algorithm used for tumor segmentation. The model extract normal and abnormal regions (Rela, Nagaraja Rao, and Ramana Reddy Citation2021). Furthermore, an automatic liver tumor segmentation model proposed with region based level set techniques. The model produced promising results (Alirr Citation2020). A Watershed Segmentation-based model was adopted to diagnose Cyst liver tumor using statistical features. The model produces 89% accuracy. (Naeemah Citation2019). Furthermore, a feed forward neural network based classification model was proposed using Watershed algorithm for segmentation. The model produced promising results (Hemalatha and Sundar Citation2021). A semi-automated model was introduced to extract liver tumors from CT images. Entropy-based fuzzy region growing technique produced promising results (Baâzaoui et al. Citation2017). A texture features based classification model proposed to extract liver tumor without using any segmentation technique. The model produced promising results using Support Vector Machine Classifier as compare to K-Nearest Neighbor and Ensemble classifier (Siddiqi, Khawaja, and Hashmi Citation2020). A Computer-Aided diagnosis system was proposed to extract liver tumor from CT images. The model produced 81.2% accuracy using Binary Logistic Regression Analysis with Leave – one – out cross validation approach (Chang et al. Citation2017). A classification model proposed using Deep Lab V-3 and pix2pix generation adaptive modules to diagnose liver tumors. The model classified tumors with better accuracy (Xia et al. Citation2018). Similarly, a hybrid cascading segmentation network was adopted to diagnose liver tumors using the LiTS CT images dataset, based on 2D and 3D neural network models. Histogram segmentation was applied to 130 CT images. The model produces promising results (Dey and Hong Citation2019).
As discussed above literature, it was observed that there is a need for an efficient and reliable system to identify liver tumors at an early stage. This will help physicians to diagnose liver tumors timely and accurately.
Materials and Methods
As mentioned above, the focus of this study is to introduce a system that will identify liver tumors at an early stage. We proposed a novel multi-class liver tumor identification (MLTI) framework. The MLTI framework uniquely identifies the four liver tumor classes using the CT dataset. It comprises four steps. In the first step, the dataset was preprocessed. Secondly, multi-features were extracted. In the third step, these features were optimized. Finally, for classification, ML algorithms were employed to acquire better accuracy. To validate the ground truth of dataset, expert radiologists of different hospitals manually examined all liver tumor CT images.
The MLTI framework is described in given section below.
Proposed Methodology
The proposed MLTI algorithm is presented in detail, including all steps.
Data Acquisition
The primary task of the MLTI framework was the collection of a liver plain CT images dataset. The dataset had two categories of liver tumor CT images: benign and malignant. The benign liver tumor further included two types (hemangioma and cyst). The malignant liver tumor also had two types (hepatocellular carcinoma and metastasis). Liver tumor CT dataset are shown in .
Figure 1. Liver tumor CT Dataset images.
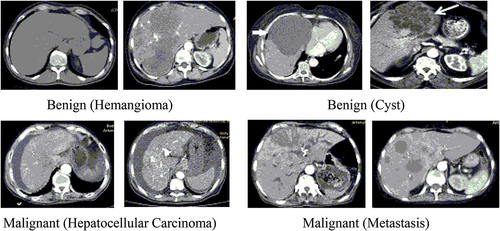
Hundred patient’s CT images were selected for experiments. We included 10 scans of each patient’s liver tumor CT image of size (512 × 512). Therefore, the dataset contains (100 × 10 = 1000 images) converted into a 24-bit JPEG format to obtain quality results. The image data acquisition was performed at the radiology department of Nishter Medical University, Multan, Pakistan Nishtar Medical University – Multan (nmu.edu.pk). These images were captured using the Toshiba Aquilion Prime TSX-303A machine with a 0.39–0.45 mm resolution. These images were manually examined by experienced radiologists and all results were shared and verified by the radiology department.
CT images are widely used as a diagnostic tool for making decisions on tumor detection in lungs, kidney, liver, and other organs instead of other imaging techniques. (Czipczer and Manno-Kovacs Citation2019; Li and Zhu Citation2020; Pang et al. Citation2019).
The contrast enhanced computed tomography (CECT) images using invasive approach while unenhanced CT images involved noninvasive approach (Balagourouchetty et al. Citation2018).
Image Preprocessing
After collecting the dataset, the second step is pre-processing of images. In this step, firstly, all images were converted into grayscale. Grayscale conversion is significant because it reduces the computational cost of the algorithm and simplifies the algorithm due to its single-dimensional representation as compared to the three-dimensional representation of color images (Kanan, Cottrell, and Ben-Jacob Citation2012; Macêdo, Melo, and Kelner Citation2015). EquationEquation (1)(1)
(1) shows the grayscale conversion.
Where I is an image in grayscale obtained by calculating the mean of R, G, and B (red, green, and blue) layers (Dwipayana, Arnia, and Musliyana Citation2018).
The visual quality of an image is essential to acquire promising results. Normally, images may be captured in various lighting conditions, including bright, dark, or uncontrolled environments and sometimes too bright and too dark, so image enhancement is required to produce a better image. Therefore, after converting the image into grayscale, Histogram Equalization (HE) employed on the dataset HE is a contrast enhancement technique for improving image quality in a simple and effective way (Hussain et al. Citation2018). Mathematical representation of histogram equalization is shown in EquationEquation (2)(2)
(2)
where represents the number of pixels and
represents the pixel to which the intensity value will be assigned as
(Dwipayana, Arnia, and Musliyana Citation2018).
The major concern in computer vision and image processing is unwanted noise reduction that distorts the vision and images. For noise removal wavelet is better technique by using the threshold value at every level of decomposition (Thukral, Kumar, and Arora Citation2019). As a result, noise removal was accomplished using the “Gabor Filter.” A Gabor is a Gaussian filter modulated with a function that is the product of a Gaussian and an exponential value (Bovik Citation1991; Weldon, Higgins, and Dunn Citation1996). Gabor filter mathematical representation is shown in EquationEquation (3)(3)
(3) as below.
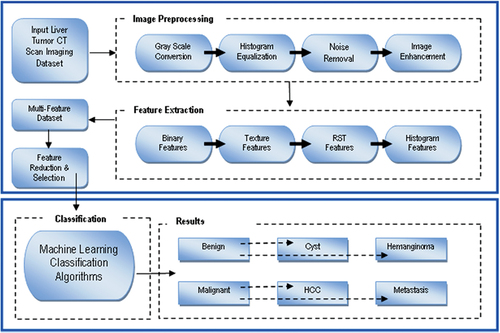
Finally, a spatial and frequency domain image smoothing, and sharpening technique was deployed to generate the high-quality image enhancement (Pérez-Benito et al. Citation2017). All image preprocessing phases are shown in .
Figure 2. Image pre-processing phases.
Multi-Class Feature Extraction
After preprocessing, the images were segmented to find the tumor’s exact location by selecting Region of Interest (ROI) segmentation. There are many methods for extraction of ROI, some are automated, and some are semi-automated. For liver CT images multi-featured dataset, four types of features were extracted as histogram features, texture features, binary features and rotational, scalability and translational (RST) features.
Histogram Features
The intensity of each pixel was used to calculate histogram features. First-order histogram features were another name for these features. For this study, five first-order histogram features were calculated. EquationEquation 4(4)
(4) describes the first-order histogram probability L(I).
T denotes the total number of pixels, and L (e) denotes the instance of the grayscale value of e. The first-order histogram features of mean, Standard Deviation (SD), skewness, energy, entropy, and others were calculated.
The mean represented the average value, as shown in EquationEquation 5(5)
(5) . The SD determined the image contrast as shown in EquationEquation 6
(6)
(6) . Skewness was the asymmetry that arises when there is no symmetry around the center value, as shown in EquationEquation 7
(7)
(7) . The energy was a distribution of grayscale values as illustrated in EquationEquation 8
(8)
(8) , and Entropy was the total of image data content as shown in EquationEquation 9
(9)
(9) .
Texture Features
These features are also called second-order statistical features, which are based on Gray level co-occurrence matrix (GLCM). This study comprised five texture features, which are described in equations.
The image’s texture features were extracted. EquationEquation 10(10)
(10) described energy. The correlation was defined as pixel similarity at a given pixel distance, as shown in EquationEquation 11
(11)
(11) . As stated in EquationEquation 12
(12)
(12) , entropy represents the overall content of the image. The inverse difference shown in EquationEquation 13
(13)
(13) is the image’s local homogeneity. The inertia was defined by the contrast, as illustrated in EquationEquation 14
(14)
(14) .
Binary Features
Shape features are another name for binary features, which are projection, thinness, aspect ratio, Euler, center area. For this study, eight binary features are calculated with the pixel projection of 10 pixel widthwise and 10 pixel height wise. There are total 28 features computed for this study.
The concept of defining object area is shown in EquationEquation 15(15)
(15) . Centroid, which is defined as the center of the graph in terms of row and column coordinates, is described in EquationEquations 16
(16)
(16) and Equation17
(17)
(17) . Orientation is the angel between x-axis and the major axis, which is described in EquationEquation 18
(18)
(18)
The perimeter constitutes the image boundaries using number of pixels as indicated in EquationEquation 19(19)
(19) . The Euler number is the difference between the number of objects and the number of holes as shown in EquationEquation 20
(20)
(20) . Projection provides valuable knowledge about the object’s shape, as shown in EquationEquations 21
(21)
(21) and Equation22
(22)
(22) .
Rotation, Scaling, and Translation (RST) Features
For this work, seven RST features (invariant features) were acquired. Structured information and a histogram description were used to extract these features. Domain-based features are also called spectral characteristics. Texture-based image classification can benefit from these features. These features were calculated in terms of power in various regions. EquationEquation 23(23)
(23) defined Spectral region power below
Multi-class features dataset for this work requires five histogram, five texture, 28 binary and seven RST features were extracted. In this way, a total of 55 multi-featured datasets was developed for each ROI. Five non-overlapping ROIs of different pixel dimensions, 11 × 11, 13 × 13, 15 × 15, 17 × 17, 19 × 19, respectively, were developed to retain the full information of each CT image of liver tumor. A total of 55000 (1000 × 55) multi-feature dataset was produced for each ROI size based on these multi-features.
Feature Selection
Feature selection is a more significant part of ML research. This process’s major objective is to select more significant features and remove less important features from the dataset. During this research, it was observed that a multi-feature dataset contains many useless features that are not valuable for liver tumor classification. This large-scale multi-featured dataset consumes a lot of processing time (Iqbal et al. Citation2018). This issue was resolved by making our multi-feature dataset optimized, persistent, and appropriate for error-free classification results (Abdel-Basset et al. Citation2020). The Principal Component Analysis (PCA) techniques produce promising results on data separated linearly since PCA supports the transformation of input data (Sarker, Abushark, and Khan Citation2020), also used as feature selection. The most important feature set was acquired using PCA, which contained less functionality than the original feature vector space (FVS) (Taguchi Citation2019). Different image fusion techniques, such as Principal Component Analysis (PCA), Discrete Wavelet Transform (DWT), and Stationary Wavelet Transform (SWT), were used by (Srivastava and Aggarwal Citation2018). PCA results were not impressive as compare to SWT and DWT (Srivastava, Singhal, and Aggarawal Citation2019). Unfortunately, because PCA could not handle massive discrete data, the optimized feature set did not accurately represent the entire dataset; moreover, the PCA approach was unsupervised, but our liver tumor CT images dataset was labeled. PCA produced less impressive results on the labeled dataset. A correlation-based feature selection (CFS) technique extracted the best feature set from the high-dimensional feature set data.
This technique was better as compared to PCA and helped to produce a dataset with optimal characteristics. CFS technique was shown in EquationEquation 24(24)
(24) as below:
In the above Equationequation 24(24)
(24) , is the heuristic of subset feature T with the D feature space. Simultaneously, it described the correlation of the features and showed the average inter-correlation feature value. Projection of the with-in-class features was expressed by numerator in EquationEquation 24
(24)
(24) , and redundancy in features was defined through the denominator of EquationEquation 24
(24)
(24) . CFS was used in a multi-featured dataset of liver tumor CT images. It produced 20 optimized feature spaces of each liver tumor CT image. The FVS was reduced from 55000 (1000 × 55) multi-features to 20000 (1000 × 20) FVS. Finally, this optimized multiclass dataset of liver tumor CT images was used by deploying different ML classifiers with 10-fold cross-validation. Twenty optimized features were shown in .
Table 1. List of features in CFS.
The proposed multi-class liver tumor identification (MLTI) framework was shown in .
Figure 3. Multi-class liver tumor identification framework (MLTIF).
Classification
Classification is the important segment during ML implication (Chauhan n.d.). For this study, we had acquired four types of liver tumor dataset and to acquire better classification accuracy four supervised ML classifiers were deployed. These classifiers are, namely, J48, RF, RT, and LMT. The RF and RT classifiers performed best among the implemented classifiers.
A tree-based classifier used a random vector sampled input vector independently, and each tree cast a unit vote for the most popular class to classify an input vector (Pal Citation2020).
The RF classifier employed in this study grows a tree by randomly selecting features at each node. The Gini Index was employed as an attribute selection measure by the RF classifier, which quantifies the impurity of an attribute in relation to the class (Pal Citation2020).
Gini Index is shown in the following EquationEquation 25(25)
(25)
where is the probability of selected value that may belong to a class
All experimental results are described in section 5. This section consist of results of relative experimentation previously performed and their comparison with this state of the art MLTI technique.
Results & Discussion
This study covers the use of four ML classifiers named J48, RF, RT, and LMT, which were deployed on the features using ten-fold cross-validation. For experiments, different size of ROI’s were taken for each liver CT image. These four ML classifiers were deployed on ,
,
,
,
and
ROI dimensions.
It was observed that these all four classifiers produced lower accuracy of less than 35% on ROI size . After that, ROI size
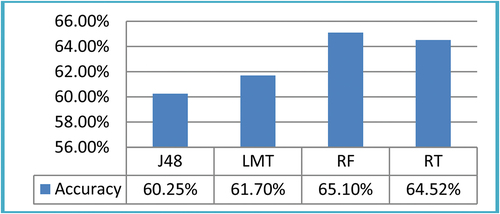
was taken to deploy ML classifiers. It was observed that J48, LMT, RF, and RT produced 60.25%, 61.70%, 65.10%, and 64.52%, respectively. The accuracy produced by ML classifiers on ROI size
was improved as compare to ROI size
. Among all four classifiers, RF produced better accuracy of 65.10%.
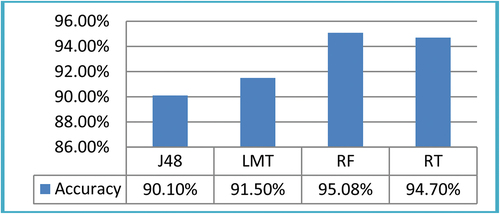
Furthermore, experiments were extended to improve classification results. These four ML classifiers were deployed on ROI size . The results showed that 90.10%, 91.50%, 95.08%, and 94.70% accuracy was achieved by J48, LMT, RF, and RT classifiers, respectively. The experiment on ROI size
produced promising results as compare to the results achieved on ROI size
and
. The experiments were extended to achieve better accuracy. For this,
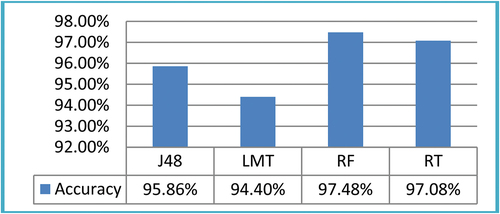
ROI size was taken and four ML classifiers were deployed. The results showed that J48, LMT, RF, and RT classifiers produced accuracy of 95.86%, 94.40%, 97.48%, and 97.08%, respectively. The classification results on ROI size
were more promising as compare to results on ROI size
,
and
.
Moreover, the experiments continued to produce better accuracy. For this purpose, ROI size and
were taken. All four ML classifiers deployed for each ROI size separately. It was observed that on ROI size
the accuracy results decreased. All four ML classifiers produced accuracy between 80% and 85%. The ML classifiers accuracy more decreased on ROI size
.
During experiments ML classifiers performance was evaluated for each ROI size taken. Accuracy factor was observed more critically among all other performance evaluation factor. These factors, namely, Kappa, True Positive (TP), False Positive (FP), Receiver Operating Curve (ROC), Recall, F-Measures, Precision, Root Mean Square Error (RMSE), and Mean Absolute Error (MAE). Were calculated to observe the overall performance of MLTI. Kappa statistics, which compare observed and expected accuracy, was used to assess the overall performance MLTI outcome with the deployed four ML classifiers. TP represented the MLTI outcome when predicting positive class correctly, and FP represented the MLTI outcome when miss predicting positive class, and precision relates reproduction and repetitions shown in EquationEquation 26(26)
(26) , and recall shows the actual retrieved amount of relevant instances, shown in EquationEquation 27
(27)
(27) .
Finally, precision and recall were used to calculate the f-measure (f-score) of MLTI. Mathematical representation of f-measure is shown in EquationEquation 28(28)
(28) .
TP and FP rates represent using a graphical plot called receiver operating characteristics (ROC). The difference between observed and predicted values is known as root mean squared error (RMSE). Mean absolute error (MAE) measures how close forecasted results are to the eventual outcomes. This happened due to the threshold of classifiers refinement, confusion matrix, and time complexity.
For this study, results on ROI size 13 × 13 were shown in . The four ML classifiers, namely, J48, LMT, RF, and RT produces accuracy results 60.25%, 61.70%, 65.10%, and 64.52%, respectively.
Table 2. Classification accuracy of ML classifier’s on ROIs 13 × 13.
The graphical representation of accuracy to classify liver tumors using CT images on ROIs size 13 × 13 showed in ,
Figure 4. Accuracy graph of the ML classifiers deployed on ROIs 13 × 13.
A confusion matrix describes the performance of the ML classifiers. shows the performance of RF classifiers, which produces promising results among other ML classifiers on ROIs size 13 × 13.
Table 3. Confusion matrix RF classifier on ROIs 13 × 13.
Furthermore, the results on ROI size 15 × 15 were shown in . The four ML classifiers, namely, J48, LMT, RF, and RT produces accuracy results 90.10%, 91.50%, 95.08%, and 94.70%, respectively.
Table 4. Classification accuracy of ML classifier’s on ROIs 15 × 15.
The graphical representation of accuracy to classify liver tumors using CT images on ROIs size 15 × 15 showed in .
Figure 5. Accuracy graph of the ML classifiers deployed on ROIs 15 × 15.
A confusion matrix describes the performance of the ML classifiers. shows the performance of RF classifiers, which produces promising results among other ML classifiers on ROIs size 15 × 15.
Table 5. Confusion matrix RF classifier on ROIs 15 × 15.
Moreover, the results on ROI size 17 × 17 were taken using ML classifiers. The results were shown in below. It was observed that RF and RT classifiers produce promising results on ROIs size 17 × 17 compared to other ML classifiers.
Table 6. Classification accuracy of ML classifier on ROIs 17 × 17.
The graphical representation of the accuracy achieved by different classifiers on ROI size 17 × 17 were showed in
Figure 6. Accuracy graph of the ML classifiers deployed on ROIs 17 × 17.
A confusion matrix of ROIs size 17 × 17 describes the performance of the ML classifiers. shows the performance of RF classifiers which produces promising results among other ML classifiers. A comparison between current and the proposed techniques are shown in .
Table 7. Confusion matrix RF classifier on ROIs 17 × 17.
Table 8. Comparison between current and proposed techniques.
Finally, this study concluded that, performance of four ML classifiers observed. These classifiers, namely, J48, LMT, RF, and RT deployed on different ROIs size ,
,
,
,
and
. Accuracy factor was used to evaluate the performance of each ML classifier. The results showed that encouraging accuracy was achieved on ROI size
,
,
. ML classifiers could not achieve promising results on ROI size
,
and
due to unwanted region of liver tumor. These unwanted regions decreased the accuracy of ML classifiers. It was also observed among all four classifiers RF and RT produced encouraging results for each ROI size
,
,
. The graphical representation of accuracy achieved by RF and RT showed in below.
Figure 7. Accuracy of RF and RT for ROIs 13x13, 15 × 15 and 17 × 17.
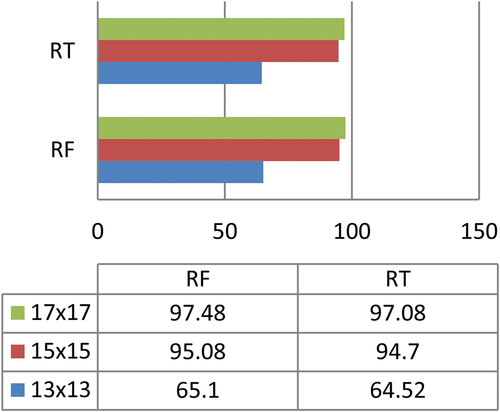
As mentioned earlier, RF and RT produced promising results on ROIs size ,
,
. Among these two classifiers RF produced higher accuracy on ROI size
using multi-featured liver CT images dataset.
Therefore, our proposed framework MLTI produced promising results for the classification of liver tumor using CT images dataset. Our proposed framework MLTI classify liver tumor into benign (hemangioma and cyst) and malignant (hepatocellular carcinoma and metastasis). MLTI achieved higher classification accuracy of 97.48% among four ML classifiers, namely, J48, LMT, RF, and RT. The following showed the comparison of MLTI with already existing techniques already deployed for the classification of liver tumor.
Therefore, in the comparison , our proposed framework MLTI classifies liver tumors using multi-feature dataset of liver CT images more accurately. This will help physicians to identify liver tumors more accurately.
Conclusion
This study focused on classification of liver tumors into a benign (hemangioma, cyst) and malignant (hepatocellular carcinoma, metastasis). The dataset consists of CT images of liver obtained from Nishter Medical University, Multan, Pakistan. Multi-featured were extracted from different ROIs segments. Features were optimized using the CFS technique. Four ML classifiers, namely, J48, LMT, RF, and RT were deployed on ROIs size ,
,
,
,
and
. ML classifiers produced better accuracy on
,
,
ROIs size. Among four ML classifiers, RF and RT produced promising results 97.48% and 97.08% on ROI
respectively. The variation of results in different classifiers was due to the modalities of the dataset.
Future Work
This proposed frame work MLTI will be enhanced in the future by combining deep learning and segmentation approaches with other imaging modalities like MRI and PET. This could lead to more accurate liver tumor classification.
Data Availability
The dataset will be provided on demand for research study.
Acknowledgments
This work was supported by IUB and MNS-UAM. The authors would like to thank Radiology Department Nishter Medical Hospital Multan Pakistan
Disclosure statement
No potential conflict of interest was reported by the author(s).
Additional information
Funding
References
- Abdel-Basset, M., D. El-Shahat, I. El-henawy, V. H. C. de Albuquerque, and S. Mirjalili. 2020. A new fusion of grey wolf optimizer algorithm with a two-phase mutation for feature selection. Expert Systems with Applications 139:112824. doi:10.1016/j.eswa.2019.112824.
- Alahmer, H., and Ahmed, A. 2016. Computer-aided classification of liver lesions from CT images based on multiple ROI. Procedia Computer Science 90:80–2650.
- Alirr, O. I. 2020. Deep learning and level set approach for liver and tumor segmentation from CT scans. Journal of Applied Clinical Medical Physics 21 (10):200–09. doi:10.1002/acm2.13003.
- Almotairi, S., G. Kareem, M. Aouf, B. Almutairi, and M. A. M. Salem. 2020. LLiver tumor segmentation in CT scans using modified SegNet. Sensors 20 (5):1516. doi:10.3390/s20051516.
- n.d. American Cancer Society. Accessed May 15, 2020. https://www.cancer.org.
- Anter, A. M., and A. E. Hassenian. 2019. CT liver tumor segmentation hybrid approach using neutrosophic sets, fast fuzzy c-means and adaptive watershed algorithm. Artificial Intelligence in Medicine 97:105–17. doi:10.1016/j.artmed.2018.11.007.
- Arora, K., and A. K. Aggarwal. 2018. Approaches for image database retrieval based on color, texture, and shape features. In Advanced Concepts in real time image and video processing, ed. Ashwani Kumar Aggarwal Alka Srivastava, 28–50. Punjab, India: IGI Global.
- Baâzaoui, A., W. Barhoumi, A. Ahmed, and E. Zagrouba. 2017. Semi-automated segmentation of single and multiple tumors in liver CT images using entropy-based fuzzy region growing. IRBM 38 (2):98–108. doi:10.1016/j.irbm.2017.02.003.
- Balagourouchetty, L., J. K. Pragatheeswaran, B. Pottakkat, and R. Govindarajalou. 2018. Enhancement approach for liver lesion diagnosis using unenhanced CT images. IET Computer Vision 12 (8):1078–87. doi:10.1049/iet-cvi.2018.5265.
- Bi, L., J. Kim, A. Kumar, and D. Feng. 2017. Automatic liver lesion detection using cascaded deep residual networks. arXiv preprint arXiv:1704.02703. https://doi.org/10.48550/arXiv.1704.02703
- Boss, R. S. C., K. Thangavel, and D. A. P. Daniel 2012. Mammogram image segmentation using fuzzy clustering. International Conference on Pattern Recognition, Informatics and Medical Engineering (PRIME-2012), 290–95. Salem, India, IEEE.
- Bovik, A. C. 1991. Analysis of multichannel narrow-band filters for image texture segmentation. IEEE Transactions on Signal Processing 39 (9):2025–43. doi:10.1109/78.134435.
- Chang, C. C., H. H. Chen, Y. C. Chang, M. Y. Yang, C. M. Lo, W. C. Ko, R. F. Chang, K.-L. Liu, and R.-F. Chang. 2017. Computer-aided diagnosis of liver tumors on computed tomography images. Computer Methods and Programs in Biomedicine 145:45–51. doi:10.1016/j.cmpb.2017.04.008.
- Choi, B. H., Y. J. Kim, S. J. Choi, and K. G. Kim. 2018. Malignant and Benign classification of liver tumor in CT according to data pre-processing and deep running model. Journal of Biomedical Engineering Research 39 (6):229–36.
- Czipczer, V., and A. Manno-Kovacs 2019. Automatic liver segmentation on CT images combining region-based techniques and convolutional features. 2019 International Conference on Content-Based Multimedia Indexing (CBMI). 1–6, Dublin, Ireland, IEEE.
- Dey, R., and Y. Hong. 2019. Hybrid cascaded neural network for liver Lesion segmentation. arXiv preprint arXiv:1909.04797. https://doi.org/10.48550/arXiv.1909.04797
- Dwipayana, M., F. Arnia, and Z. Musliyana. 2018. Histogram equalization smoothing for determining threshold accuracy on ancient document image binarization. Journal of Physics Conference Series 1019:2–s2. doi:10.1088/1742-6596/1019/1/012071.
- Ghoniem, R. M. 2020. A novel bio-inspired deep learning approach for liver cancer diagnosis. Information 11 (2):80. doi:10.3390/info11020080.
- Gruber, N., S. Antholzer, W. Jaschke, C. Kremser, and M. Haltmeier. 2019. A joint deep learning approach for automated liver and tumor segmentation. arXiv preprint arXiv:1902.07971. https://doi.org/10.48550/arXiv.1902.07971
- Hemalatha, V., and C. Sundar. 2021. Automatic liver cancer detection in abdominal liver images using soft optimization techniques. Journal of Ambient Intelligence and Humanized Computing 12 (5):4765–74. doi:10.1007/s12652-020-01885-4.
- Hussain, K., S. Rahman, M. M. Rahman, S. M. Khaled, M. Abdullah-Al Wadud, M. A. H. Khan, and M. Shoyaib 2018. A histogram specification technique for dark image enhancement using a local transformation method. (IPSJ Transactions on Computer Vision an).
- Iqbal, Z., M. A. Khan, M. Sharif, J. H. Shah, M. H. Ur Rehman, and K. Javed. 2018. An automated detection and classification of citrus plant diseases using image processing techniques: A review. Computers and Electronics in Agriculture 153:12–32. doi:10.1016/j.compag.2018.07.032.
- Jemal, A., Bray, F., Center, M. M., Ferlay, J., Ward, E., and Forman, D. 2011. Global cancer statistics. CA: A Cancer Journal for Clinicians 61(2):69–90.
- Jinglu, H., and J. Zhang. 2008. Image segmentation based on 2d otsu method with histogram analysis. International Conference, 6, Wuhan, China.
- Kanan, C., G. W. Cottrell, and E. Ben-Jacob. 2012. Color-to-grayscale: Does the method matter in image recognition? PloS one 7 (1):e29740. doi:10.1371/journal.pone.0029740.
- Kaur, A., A. P. S. Chauhan, and A. K. Aggarwal. 2021. An automated slice sorting technique for multi-slice computed tomography liver cancer images using convolutional network. Expert Systems with Applications 186:115686. doi:10.1016/j.eswa.2021.115686.
- Kavur, A. E., L. I. Kuncheva, and M. A. Selver. 2020. Basic ensembles of vanilla-style deep learning models improve liver segmentation from CT images. arXiv preprint arXiv \2001.09647. https://doi.org/10.48550/arXiv.2001.09647
- Kondo, S., K. Takagi, M. Nishida, T. Iwai, Y. Kudo, K. Ogawa, T. Kamiyama, H. Shibuya, K. Kahata, and C. Shimizu. 2017. Computer-aided diagnosis of focal liver lesions using contrast-enhanced ultrasonography with perflubutane microbubbles. IEEE Transactions on Medical Imaging 36(7):1427-1437. https://doi.org/10.1109/tmi.2017.2659734
- Kondo, S., K. Takagi, M. Nishida, T. Iwai, Y. Kudo, K. Ogawa, C. Shimizu, H. Shibuya, K. Kahata, and C. Shimizu. 2017b. Computer-aided diagnosis of focal liver lesions using contrast-enhanced ultrasonography with perflubutane microbubbles. IEEE Transactions on Medical Imaging 36 (7):1427–37. doi:10.1109/TMI.2017.2659734.
- Krishan, A., and D. Mittal. 2021. Ensembled liver cancer detection and classification using CT images. Proceedings of the Institution of Mechanical Engineers. Part H, Journal of Engineering in Medicine 235 (2):232–44. doi:10.1177/0954411920971888.
- Kumar, S. S., and R. S. Moni. 2010. Diagnosis of liver tumor from CT images using curvelet transform. International Journal on Computer Science and Engineering 2 (4):1173–78.
- Li, C., and A. Zhu. 2020. Application of image fusion in diagnosis and treatment of liver cancer. Applied Sciences 10 (3):1171. doi:10.3390/app10031171.
- Liu, Y. C., D. S. Tan, J. C. Chen, W. H. Cheng, and K. L. Hua 2019. Segmenting hepatic lesions using residual attention U-Net with an adaptive weighted dice loss. 2019 IEEE International Conference on Image Processing (ICIP), 3322–33, Taipei, Taiwan.
- Macêdo, S., G. Melo, and J. Kelner. 2015. A comparative study of grayscale conversion techniques applied to SIFT descriptors. SBC Journal on Interactive Systems 6 (2):30–36.
- Meng, L., Y. Tian, and S. Bu. 2020. Liver tumor segmentation based on 3D convolutional neural network with dual scale. Journal of Applied Clinical Medical Physics 21 (1):144–57. doi:10.1002/acm2.12784.
- Naeem, S., A. Ali, S. Qadri, W. K. Mashwani, N. Tairan, H. Shah, S. Anam, F. Jamal, C. Chesneau, and S. Anam. 2020. Machine-Learning based hybrid-feature analysis for liver cancer classification using fused (MR and CT) images. Applied Sciences 10 (9):3134. doi:10.3390/app10093134.
- Naeemah, M. R. 2019. Textural analysis of liver tumor using watershed segmentation based on statistical and geometrical features. Iraqi Journal of Science 1877-1887. https://doi.org/10.24996/ijs.2019.60.8.25
- Nasiri, N., A. H. Foruzan, and Y. W. Chen 2019. A controlled generative model for segmentation of liver tumors. Iranian Conference on Electrical Engineering (ICEE), 1742–45, Yazd, Iran, IEEE.
- Ntomi, V., A. Paspala, and D. Schizas. 2018. Novel techniques in the surgical management of hepatocellular carcinoma. In (Ed.), Liver Cancer. IntechOpen. https://doi.org/10.5772/intechopen.79982
- Özyurt, F., T. Tuncer, E. Avci, M. Koç, and İ. Serhatlioğlu. 2019. A novel liver image classification method using perceptual hash-based convolutional neural network. Arabian Journal for Science and Engineering 44 (4):3173–82. doi:10.1007/s13369-018-3454-1.
- Pal, M. 2005. Random forest classifier for remote sensing classification. International Journal of Remote Sensing 26 (1):217–22. doi:10.1080/01431160412331269698.
- Pang, S., A. Du, M. A. Orgun, Z. Yu, Y. Wang, Y. Wang, and G. Liu. 2020. CTumorGAN: A unified framework for automatic computed tomography tumor segmentation. European Journal of Nuclear Medicine and Molecular Imaging 47(10):2248-2268. doi: 10.1007/s00259-020-04781-3. Epub 2020 Mar 28. PMID: 32222809.
- Pang, Y., D. Hu, and M. Sun 2019. A modified scheme for liver tumor segmentation based on cascaded FCNs. In Proceedings of the International Conference on Artificial Intelligence, Information Processing and Cloud Computing (AIIPCC '19). Association for Computing Machinery, New York, NY, USA, Article 10, 1–6. https://doi.org/10.1145/3371425.3371451.
- Parsai, A., M. E. Miquel, H. Jan, A. Kastler, T. Szyszko, and I. Zerizer. 2019. Improving liver lesion characterisation using retrospective fusion of FDG PET/CT and MRI. Clinical Imaging 55:23–28. doi:10.1016/j.clinimag.2019.01.018.
- Pérez-Benito, C., S. Morillas, C. Jordán, and J. A. Conejero. 2017. Smoothing vs. sharpening of colour images: Together or separated. Applied Mathematics and Nonlinear Sciences 2 (1):299–316. doi:10.21042/AMNS.2017.1.00025.
- Rajalakshmi, T., U. Snekhalatha, and J. Baby. 2019. Segmentation of liver tumor using fast greedy snake algorithm. Biomedical Engineering: Applications, Basis and Communications 31 (2):1950013.
- Rela, M., S. Nagaraja Rao, and P. Ramana Reddy. 2021. Optimized segmentation and classification for liver tumor segmentation and classification using opposition‐based spotted hyena optimization. International Journal of Imaging Systems and Technology 31 (2):627–56. doi:10.1002/ima.22519.
- Sarker, H. I., Y. B. Abushark, and A. I. Khan. 2020. ContextPCA: Predicting context-aware smartphone apps usage based on machine learning techniques. Symmetry 12 (4):499. doi:10.3390/sym12040499.
- Schmauch, B., P. Herent, P. Jehanno, O. Dehaene, C. Saillard, C. Aubé, S. Jégou, N. Lassau, and S. Jégou. 2019. Diagnosis of focal liver lesions from ultrasound using deep learning. Diagnostic and Interventional Imaging 100 (4):227–33. doi:10.1016/j.diii.2019.02.009.
- Seo, H., C. Huang, M. Bassenne, R. Xiao, and L. Xing 2020. Modified U-Net (mU-Net) With Incorporation of Object-Dependent High Level Features for Improved Liver and Liver-Tumor Segmentation in CT Images. IEEE Transactions on Medical Imaging 39:1316-1325.
- Shuang, Y., and Z. Wang. 2020. A novel approach for automatic and robust segmentation of the 3D liver in computed tomography images. Measurement Science and Technology 31 (11):115701. doi:10.1088/1361-6501/ab95db.
- Siddiqi, A. A., A. Khawaja, and A. Hashmi. 2020. Classification of abdominal CT images bearing liver tumor using structural similarity index and support vector machine. Mehran University Research Journal Of Engineering & Technology 39 (4):751–58. doi:10.22581/muet1982.2004.07.
- Siegel, R. L., Miller, K. D., Goding Sauer, A., Fedewa, S. A., Butterly, L. F., Anderson, J. C., and Jemal, A. 2020. Colorectal cancer statistics, 2020. CA: A Cancer Journal for Clinicians 70(3):145–164.
- Srivastava, A., and A. K. Aggarwal. 2018. Medical image fusion in spatial and transform domain: A comparative analysis. In Handbook of research on advanced concepts in real-time image and video processing, ed. A., & Aggarwal, A. K. Srivastava, 281–300. Punjab, India: IGI Global.
- Srivastava, A., V. Singhal, and A. K. Aggarawal. 2017. Comparative analysis of multimodal medical image fusion using PCA and wavelet transforms. International Journal of Latest Technology in Engineering, Management & Applied Science (IJLTEMAS) VI.
- Sun, C., A. Xu, D. Liu, Z. Xiong, F. Zhao, and W. Ding 2019. Deep Learning-Based Classification of Liver Cancer Histopathology Images Using Only Global Labels, In IEEE Journal of Biomedical and Health Informatics, vol. 24, no. 6, pp. 1643-1651, June 2020, doi: 10.1109/JBHI.2019.2949837.
- Taguchi, Y. H. 2020. “Applications of PCA based unsupervised FE to bioinformatics. Unsupervised Feature Extraction Applied to Bioinformatics. Springer.
- Thukral, R., A. Kumar, and A. S. Arora 2019, September. Effect of Different Thresholding Techniques for Denoising of EMG Signals by using Different Wavelets, 2019 2nd International Conference on Intelligent Communication and Computational Techniques (ICCT), pp. 161-165, doi: 10.1109/ICCT46177.2019.8969036.
- Todoroki, Y., Y. Iwamoto, L. Lin, H. Hu, and Y. W. Chen 2019. Automatic detection of focal liver lesions in multi-phase CT images using a multi-channel & multi-scale CNN. 2019 41st Annual International Conference of the IEEE Engineering, Berlin, Germany.
- Wang, Z., Zhang, C., Jiao, T., Gao, M., and Zou, G. 2018. Fully automatic segmentation and three-dimensional reconstruction of the liver in CT images. Journal of Healthcare Engineering, .
- Wang, S., M. Zhou, O. Gevaert, Z. Tang, D. Dong, Z. Liu, and J. Tian 2017. A multi-view deep convolutional neural networks for lung nodule segmentation. Engineering in Medicine and Biology Society (EMBC), 39th Annual International Conference IEEE, Jeju, Korea (South).
- Weldon, T. P., W. E. Higgins, and D. F. Dunn. 1996. Gabor filter design for multiple texture segmentation. OPTICAL ENGINEERING-BELLINGHAM-INTERNATIONAL SOCIETY FOR OPTICAL ENGINEERING 35:2852–63. doi:10.1117/1.600971.
- Wu, W., Z. Zhou, S. Wu, and Y. Zhang 2016. Automatic liver segmentation on volumetric CT images using supervoxel-based graph cuts. (Computational and mathematical methods in medicine, 2016).
- Wu, W., Zhou, Z., Wu, S., and Zhang, Y. 2016 . Automatic liver segmentation on volumetric CT images using supervoxel-based graph cuts. Computational and Mathematical Methods in Medicine, .
- Xia, K., H. Yin, P. Qian, Y. Jiang, and S. Wang. 2019. Liver semantic segmentation algorithm based on improved deep adversarial networks in combination of weighted loss function on abdominal CT images. IEEE Access 7. doi: 10.1109/ACCESS.2019.2929270.
- Xu, H., W. Guo, X. Cui, H. Zhuo, Y. Xiao, X. Ou, X. Ma, T. Zhang, and X. Ma. 2019. Three-dimensional texture analysis based on PET/CT images to distinguish hepatocellular carcinoma and hepatic lymphoma. Frontiers in Oncology 9:844. doi:10.3389/fonc.2019.00844.
- Zheng, Z., X. Zhang, H. Xu, W. Liang, S. Zheng, and Y. Shi. 2018. A unified level set framework combining hybrid algorithms for liver and liver tumor segmentation in CT images. BioMed Research International 2018. Article ID 3815346. https://doi.org/10.1155/2018/3815346.
- Zhou, L. Q., J. Y. Wang, S. Y. Yu, G. G. Wu, Q. Wei, Y. B. Deng, C. F. Dietrich, X.-W. Cui, and C. F. Dietrich. 2019. Artificial intelligence in medical imaging of the liver. World Journal of Gastroenterology 25 (6):672. doi:10.3748/wjg.v25.i6.672.