
 ?Mathematical formulae have been encoded as MathML and are displayed in this HTML version using MathJax in order to improve their display. Uncheck the box to turn MathJax off. This feature requires Javascript. Click on a formula to zoom.
ABSTRACT
The COVID-19 pandemic has spread rapidly and significantly impacted most countries in the world. Providing an accurate forecast of COVID-19 at multiple scales would help inform public health decisions, but recent forecasting models are typically used at the state or country level. Furthermore, traditional mathematical models are limited by simplifying assumptions, while machine learning algorithms struggle to generalize to unseen trends. This motivates the need for hybrid machine learning models that integrate domain knowledge for accurate long-term prediction. We propose a three-layer, geographically informed ensemble, an extensive peer-learning framework, for predicting COVID-19 trends at the country, continent, and global levels. As the base layer, we develop a country-level predictor using a hybrid Graph Attention Network that incorporates a modified SIR model, adaptive loss function, and edge weights informed by mobility data. We aggregated 163 country GATs to train the continent and world MLP layers of the ensemble. Our results indicate that incorporating quantitatively accurate equations and real-world data to model inter-community interactions improves the performance of spatio-temporal machine learning algorithms. Additionally, we demonstrate that integrating geographic information (continent composition) improves the performance of the world predictor in our layered architecture.
Introduction
Background
The COVID-19 pandemic has rapidly spread to most countries of the world. Accurate forecasts of COVID-19 will enable medical researchers and governments to better respond to this pandemic by informing decisions about pandemic planning, design, and distribution of vaccinations, resource allocation, implementation of social distancing measures, and other interventions (ElAraby et al. Citation2022; Niazkar and Niazkar Citation2020; Niu et al. Citation2021; Qiong et al. Citation2020; Shams et al. Citation2021). The two dominant categories of prediction techniques are mathematical models (usually described as deterministic or stochastic dynamic systems) and machine learning (ML) models (e.g., deep neural networks, logistic regression, XGBoost, random forests, SVM, and decision trees (investigated by Almeshal et al. Citation2020; El-Rashidy et al. Citation2021; Prakash et al. Citation2020; Wang et al. Citation2020, etc.)).
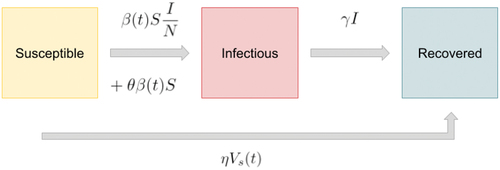
Figure 1. SIRVC model: susceptible-infectious-recovered with vaccinations and inter-community interactions. An additional term moves susceptible individuals into the infectious group through interactions with external communities.
Mathematical models, which are formulated using partial differential equations (PDE) (Liang et al. Citation2010) or ordinary differential equations (ODE) (Chaturvedi and Chakravarty Citation2021) in COVID-19 pandemic simulations, have relatively large error because they are derived based on simplification with high bias. Machine learning models can mirror the randomness of data, but noisy or non-representative data may affect the model’s prediction performance due to sensitivity to variance; additionally, the ability of these models to generalize to unseen data is limited. As a result, physics-guided ML models (Willard et al. Citation2021) are investigated to optimize the bias-variance tradeoff.
COVID-19 has generated a large volume of data that describes its transmission as a highly connected process. For example, each country’s unique dynamic situation can be significantly impacted by other countries’ infection trends due to physical interaction between countries and intervention differences (e.g., time of vaccine introduction). Therefore, we need a model that considers the inherent spatial and temporal nature of the disease to incorporate the connections between countries into COVID-19 prediction. Graph neural networks (GNNs) are a particularly useful machine learning method for capturing dependencies between nodes (countries). One type of GNN, known as a graph attention network (GAT) and proposed by Velickovic et al. (Citation2018), further enables nodal interactions to be propagated through a graph structure.
Additionally, the Spatio-Temporal Attention Network (STAN) model was recently developed to capture spatio-temporal patterns of COVID-19 by Gao et al. (Citation2021). The STAN model is a physics-guided GAT that incorporates pandemic physics in the form of the Susceptible-Infectious-Recovered (SIR) model into its loss function to enhance long-term predictions. STAN was tested using COVID-19 and patient claims data at the county and state levels for the United States. The authors tested their model against mathematical baselines and machine learning baselines, including ColaGNN (Deng et al. Citation2020) and CovidGNN (Kapoor et al. Citation2020). They found that STAN outperformed all baselines for COVID-19 prediction.
Our Work
This work extended and optimized STAN at the country level by including more accurate quantification of inter-community interactions to address some of the limitations of physics-guided ML models. We used flight data from OpenSky Network hosted by Olive, Strohmeier, and Lübbe (Citation2021) to model international interactions. We developed an adaptive loss function to give greater weight to mathematical models later in the prediction window. After critically assessing the modified country-level GNN, we addressed the challenge of global prediction. Learning hundreds of underlying patterns from large-scale COVID-19 data is beyond a single learning machine, so we present a layered ensemble to predict COVID-19 at the world level. The base layer of the ensemble assigns one GAT (modified STAN model) to each country. The outputs of these GATs are fed into two additional MLP layers corresponding to continent and world layers; the final output is a prediction of global COVID-19 trends. The country, continent, and world predictions of our model were assessed using COVID-19 data from Our World in Data hosted by Mathieu et al. (Citation2021).
The major technical contributions of this paper are:
(1) Developed a geographically informed layered ensemble framework to formulate a multiscale knowledge representation, which ranges from country through global level, of COVID-19 trends. As demonstrated in numerical experiments, the ensemble knowledge derived from lower level networks greatly improves the prediction accuracy of higher level networks.
(2) Proposed two interdependent learning frameworks, peer-learning and layered ensemble learning, to improve the learning effectiveness through the sharing of knowledge, ideas, and experience among learning agents.
(3) Developed a physics-guided Graph Attention Network framework for country-level COVID-19 predictions:
● Incorporated novel pandemic dynamic equations to reduce the limitations of traditional closed-community epidemiological models.
● Introduced mobility-based edge weights, derived from flight counts, to quantify interactions between countries and enhance dependencies between graph nodes.
● Designed an adaptive physics-guided loss function to optimize the trade-off between ML methods (featured with relatively poor long-term prediction (Karpatne et al. Citation2018; Willard et al. Citation2021)) and mathematical modeling (featured with relatively poor granular prediction (Karpatne et al. Citation2018; Willard et al. Citation2021)).
Related Works
Mathematical Modeling of Pandemics
The base Susceptible-Infectious-Recovered (SIR) model from epidemiology (Kermack, McKendrick, and Walker Citation1927) is used to model the progression of an epidemic in a closed population over time. Partial derivatives are calculated to determine the change in each of the three SIR states:
where is the transmission rate,
is the transmission rate constant, and
is the population size.
An extension of the SIR model includes vaccinations (Feng, Towers, and Yang Citation2011)
where is the number of vaccination shots administered at time
, and
is the efficacy of the vaccine.
Physics-Guided Machine Learning
As investigated by Rai and Sahu (Citation2020), neither physics-based approaches (investigated by Karpatne et al. (Citation2018)) nor machine learning approaches can independently formulate epidemics accurately and efficiently. Physics-based approaches provide an efficient calibrated numerical model to formulate pandemic spread processes, but they generally have large prediction errors because the numerical models are derived from simplification. Typically, purely mathematical models are used to evaluate concepts such as preparedness rather than quantifying outcomes (Subramanian et al. Citation2021). Machine learning approaches ignore the fundamental laws of epidemics and may result in ill-posed problems or have difficulty generalizing to unseen patterns; additionally, deeper and wider NNs often require large sets of labeled data for effective training and suffer from extremely high computational complexity (Chen et al. Citation2018), preventing them from being deployed in real-time systems. The result is a need to incorporate domain knowledge into NNs, which is implemented through loss function regularization, data enrichment, and network architecture configuration, etc.
Increased popularity of hybrid physics-guided machine learning models (Willard et al. Citation2021) have been previously implemented to predict COVID-19 trends. We focus on the STAN model developed by Gao et al. (Citation2021), a spatio-temporal GAT developed to predict COVID-19 progression based on Johns Hopkins and patient claims data. STAN incorporates the SIR pandemic transmission model into the loss function to form a hybrid machine learning model. The authors tested their model on USA county and state-level data from 2020, using demographic and geographic data to determine inter-community interactions. However, no known physics-guided ML models have been used to predict COVID-19 progression at the country, continent, and world levels.
Graph Neural Networks for Pandemic Prediction
As investigated by Scarselli et al. (Citation2009), a graph neural network (GNN) is a general framework for a neural network that operates on graph-structured data. Each node has an embedding, or state, with its current feature values, such as a single community at one point in time during a pandemic. The data can be modeled by constructing an attributed graph as
where is the set of nodes representing the set of communities and
is the set of directed edges representing interactions between communities.
In the GNN formalism, neighboring nodes affect the state of each node. Neighbors pass their states along edges in a directed graph as messages; each node’s state is updated in each layer (each iteration) by aggregating its neighbors’ messages. Let denote the feature of node
, and
denote the hidden feature (or embedding) of node
at layer
. A message passing layer updates the hidden feature of node
as follows:
where ,
is the neighbors of node
(Hamilton Citation2020).
Defined by Velickovic et al. (Citation2018), graph attention networks (GATs) are a type of GNN that assign learned attention scores to each edge. The attention score between two nodes is a linear transformation weight matrix. The non-linear activation function leaky rectified linear function (LeakyReLU) is applied to compute the attention matrix. Then soft-max function is used to normalize the attention score. Each edge of the node will receive an attention score.
The output of the vertex is derived from vertex embedding (or hidden feature) of layer
:
Define (
) as the embedding at variant layers, it is initialized using vertex’s feature:
and extended as:
EquationEq. (7)(7)
(7) aggregates neighbor embeddings weighted by the attention scores.
is a learnable weighted matrix.
is the normalized attention score described as:
which is derived from the un-normalized attention score
In EquationEq. 9(9)
(9) ,
is a learnable attention function (Velickovic et al. Citation2018).
Methods
This section mainly presents the major technical contributions of this paper. Particularly, two innovative frameworks such as team learning and layered ensemble learning will be addressed in detail.
SIRVC: Novel SIR Model with Vaccinations and Inter-Community Interaction
The SIRV model, which is described by EquationEq. (2(2)
(2) ), only models a closed population. To overcome the drawback we propose a novel extension of this model that incorporates dynamic inter-community interactions (). Our SIRVC model assumes that individuals in a community with a disease will interact with individuals outside of that community with the same disease, as is the case in a global pandemic such as COVID-19. The progression of the disease in each sub-community (e.g., country level) is unique due to differences in time of introduction, demographics, vaccination rate, mobility, etc., and affects the progression of the disease in the larger community (e.g., global level). The proposed SIRVC can be expressed as
Here, is the probability that an intra-community individual interacts with any outer-community infectious individual in a given time period (e.g., 14 day). Note that the
term (transmission rate) is assumed to be the same for the disease across all communities, which is a potential limitation of this model.
Mobility-Based Edge Weights
Each edge is directed and represents mobility from one country to another. A directed edge is included from an origin country to a destination country if a flight between the two countries occurred during the time period of training (and testing, if known). A directed edge also exists between countries that share a land border to account for ground travel (e.g., the United States and Canada each have a directed edge to the other).
Different from the typical GAT implementation, whose edges are graded by attention scores proposed by Velickovic et al. (Citation2018) only (excluding the weight value), our work takes the advantages of both edge weight and an attention mechanism proposed by Gong and Cheng (Citation2018). The edge weights are dynamic and determined by the volume of air travel between two countries.
is the set of graph edges that represent the possible interactions between countries that could contribute to the spread of COVID-19. In this work, the interactions between countries are determined based on the flight travel between origin and destination countries. Specifically, a weighted adjacency matrix
is defined as follows
where denotes the flight count from vertex
to vertex
in the graph, and
is a predetermined threshold value.
We incorporate A into EquationEq. (7)(7)
(7) by matrix multiplication of attention score and edge weight.
Spatio-Temporal Graph Attention Network
Since obtaining spatial dependencies is a crucial problem in pandemic prediction, GATs can make accurate predictions for individual countries by utilizing spatial features. In the proposed model, each country receives information from its adjacent locations based on flight travel and learned attention score, which models spatio-temporal disease transmission patterns.
Following the STAN model, we use two GAT layers designed to extract spatio-temporal features from the graph. Historical feature data is concatenated at each time step and fed into the first GAT layer. Then, the modified graph attention mechanism is applied to generate the updated hidden features for each node, which is passed into the second GAT layer.
The output of the second GAT layer is passed to the MaxPooling operator to generate an embedding for the whole graph. The graph embedding is input to a gated recurrent unit (GRU) to learn temporal features. Then, the GRU’s hidden state is calculated, which will output the spatial and temporal patterns learned, represented as (12)
where is the dimension of input-window and
is the time-series of embedding derived from Eq. (7).
Adaptive Loss Function
Machine learning methods are useful for short-term prediction and can learn complex trends from training data. In contrast, mathematical models like SIR are useful for long-term prediction but less accurate for granular day-to-day predictions that involve more interactions than the model can capture. An adaptive physics-guided loss function was proposed to optimize these trade-offs:
In EquationEq. (13(13)
(13) ),
is the parameter of GAT,
is the violation between the GAT-enabled prediction
and the ground truth data;
denotes the pandemic physics violation against the SIRVC model. Pandemics physics violation is derived from the modeling and simulation about COVID-19 pandemics governed by Eq. (10).
As one of our technical contributions,
is introduced to adaptively optimize the trade-off between bias (measured by physics violation) and variance (mainly measured by data prediction error). In EquationEq. (14(14)
(14) ), coefficient
denotes the prediction day and
denotes the prediction window size. Near the beginning of the prediction window, more weight is given to the purely data-based machine learning prediction. At the end, more weight is given to the physics-based model. We hypothesized that adapting the loss function based on the day of the prediction window would help account for the limitations of the two models.
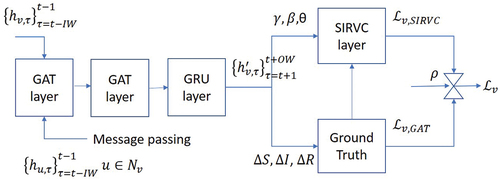
illustrates the architecture and loss function for each vertex. It should be remarked that we keep a similar neural network architecture as STAN (Gao et al. Citation2021) in order to demonstrate the advantages of our proposed methodology, such as layered ensemble, adaptive physics-guided loss function, etc. We updated the STAN model to include vaccinations and the SIRVC differential equations. However, note that we do not include the rich feature data (patient claims) used by the STAN authors, as the scope of our model is on the global level.
Figure 2. Architecture and adaptive physics-guided loss function for GAT vertex.
GAT-enabled Peer Learning
Different from Gao et al. (Citation2021), this work proposed a GAT-enabled team learning strategy to get other vertices/countries, which are closely related to the targeting country, involved in the learning process of pandemics pattern. This strategy is based on the assumption that peer learning can exploit the data in a more efficient way.
Algorithm 1 shows a sequential (or cascaded) implementation of GAT-enabled team learning. Future work will focus on the parallel GAT-enabled team learning. In addition, besides the international airborne or ground mobility, some other relations such as geopolitical relation and socioeconomic similarity should also be considered in the construction of peer-learning teams.
Algorithm 1 GAT-enabled peer learning
Require: target country , data loading, graph construction, feature prepossessing, GAT model definition, random parameter value of GAT
1: Formulate the learning team consisting of the countries that have heavy airborne/ground mobility with the target country
;
2: for do
3: for every vertex/country do
4: initialize using documented pandemics data;
5: for layer do
6: ;
7:
8:
9:
10: end for
11: Predict pandemics country from
;
12: Update GAT parameter according to
(EquationEq. 13)
(13)
(13) ;
13: end for
14: Measure the error of team learning, break if accurate enough;
15: end for
Geographically Informed Layered Ensemble Learning
The independent learning described in Algorithm 1 only exploits the peer-to-peer correlation among learning agents. As an extension, this paper also proposed a hierarchical/layered ensemble strategy, which takes the advantages of hierarchical correlations among agents as well.
As illustrated in , the networks will be trained in bottom-up order; the ensemble knowledge derived from the lower level networks will be fed into the upper level networks during training and prediction. Such approaches offer advantages like improved data efficiency, reduced over-fitting through shared representations, and fast learning by leveraging auxiliary information (Avelar et al. Citation2019; Ruder Citation2017; Zhang and Yang Citation2017).
Figure 3. Layered ensemble architecture for multi-scale pandemic prediction ranging from country through global level.
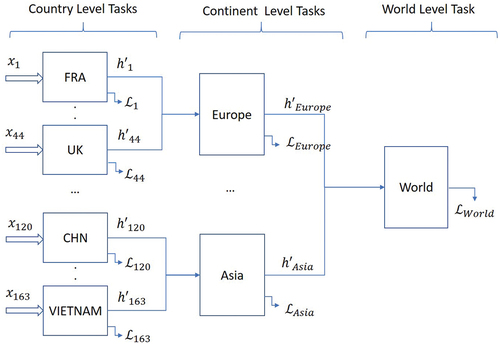
Algorithm 2 shows an implementation of the proposed three-layer geographically informed ensemble framework for COVID-19. This framework will open a new window for multi-scale knowledge representation about COVID-19 pandemics.
Algorithm 2 Three-layer geographically informed ensemble for global pandemics prediction (ranging from country level through global level)
Required: data loading, graph construction, feature prepossessing, GAT model definition, random parameter value of GAT
1: for = country,continent,world do
2: if == country then
3: Group multiple peer-learning teams described in Subsection 2.5;
4: Train every peer-learning teams using Algorithm 1;
5: Document the knowledge embedding derived from peer learning;
6: else
7: Configure the MLP architecture for ;
8: for do
9: for every vertex do
10: Gather lower levels’ ensemble knowledge for ;
11: Initialize the MLP wrt vertex as the target;
12: Update MLP’s parameters for vertex via backpropagation;
13: Document the knowledge embedding learned for vertex ;
14: end for
15: end for
16: end if
17: end for
Data Preparation
Training, Validation, and Testing
The proposed country-level GAT framework is given an input history window of 14 days’ worth of feature data (i.e., ). The model predicts the change in the number of active and recovered cases for the next 14 days (i.e.,
). Training data spanned January 2021 to March 2021, validation data were the month of April 2021, and testing data were May 2021.
GAT Framework Data
Node features
COVID-19 data from “Our World in Data” (Mathieu et al. Citation2021) was processed to create the temporal feature data for the graph nodes. Countries that had no COVID-19 deaths and fewer than 1000 confirmed cases by January 1, 2021 were excluded from the graph.
For each country, active (infectious) cases were estimated by subtracting the current day’s total cases from the total cases 14 days prior. Note that we assumed all new cases within the last 14 days remain active (high estimate) according to the CDC’s CDC-guidance. Recovered cases are determined by subtracting active cases and total deaths from the current day’s total cases. Since our model includes vaccinations, recovered cases also include all of the fully vaccinated individuals on the current day. The number of susceptible individuals is equal to the population size minus the number of active and recovered cases. Each node receives these three features () for each day of the history window.
Edge features
International flight data was collected from Opensky Network, which is managed by Olive, Strohmeier, and Lübbe (Citation2021), to formulate edge weights between nodes. For simplicity and computing performance, edge connections for all flights are added only during the initial construction of the graph; some edges will have weights of zero at certain time steps if there were no flights between them during those days. Edge weights are normalized using the doubly stochastic method and multiplied by the learned attention scores of each edge during message passing, as implemented by Gong and Cheng (Citation2018).
shows the final structure of our proposed country-level GAT framework.
Table 2. Country-level GAT structure.
Three-Layer Ensemble Data
The first layer of the ensemble is the country-level GAT framework. The 14-day prediction output of the 163 country-level GATs is split into corresponding continent groups, which is used as the input for the six continent-level MLPs (excluding Antarctica) of the middle ensemble layer. Then, the 14-day prediction output of the 6 continent-level MLPs is used as the input for the world-level MLP. The final output of the ensemble model is 14 days’ worth of global active COVID-19 case prediction.
Results
Baselines
The original STAN model (Gao et al. Citation2021) was compared with baseline models SIR, SEIR, GRU, ColaGNN, CovidGNN, STAN-PC, and STAN-Graph, all of which it outperformed. Our modified STAN model, an SIRVC-based adaptive GAT framework for country-level predictions, is compared with the STAN model as a baseline. We show country-level results of multiple experiments for the United States and the United Kingdom, two countries with high-quality COVID-19 data and high levels of international interactions.
We determined two baselines for our three-layer ensemble to demonstrate the importance of the middle (continent) layer. The first baseline pools all 163 countries to train the world-level MLP to justify the need for the continent layer. The second baseline randomly assigns countries to continents to demonstrate the importance of a geographically informed ensemble.
Country-Level Physics-guided GAT Predictions
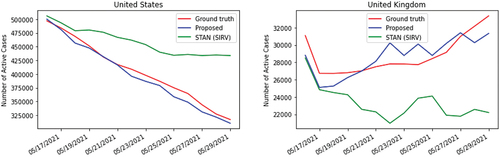
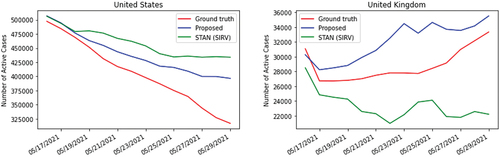
The proposed country-level GAT model includes edges weighted by international flight volume, an adaptive loss function, and our novel SIRVC model. Predictions for the United States and United Kingdom are shown in .
Figure 4. Country SIRVC-GAT prediction (proposed layered ensemble model: (a) USA; (b) UK.
Ablation Test
We performed an ablation test on two of the components of our adjusted model to analyze the effects of the components on prediction.
As justification for including adaptive loss (described by EquationEq. 13(13)
(13) and Equation14
(14)
(14) ), predictions of our model without adaptive loss are shown in . For both countries, using adaptive loss led to better performance compared to using fixed loss.
Figure 5. Country SIRVC-GAT prediction with fixed loss: (a) USA; (b) UK.
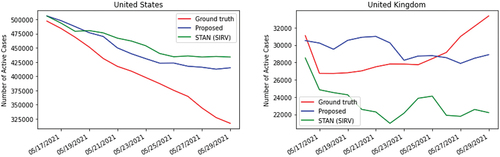
As justification for including mobility-based edge weights, predictions of the model trained without edge weights are shown in . Both countries performed better with edge weights incorporated into the attention mechanism compared to using only learned attention scores.
Figure 6. Country SIRVC-GAT prediction without edge weight: (a) USA; (b) UK.
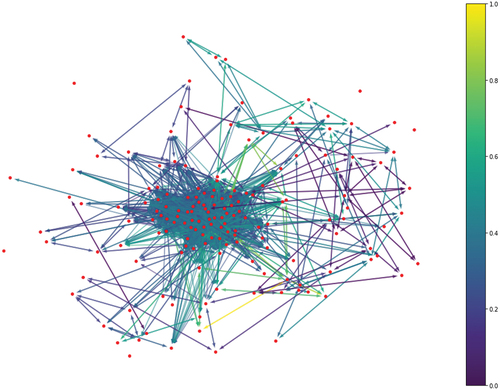
Visualization of the Attention Derived from Flight Information and Learned Attention Score
Interactions between countries are visualized in . This network shows the edge attention of the final layer of the proposed model trained on the United States (from ).
Figure 7. United States GAT model: final graph layer attention visualization. Edge color corresponds to min-max normalized edge attention.
Error Comparison
shows the mean-squared error (MSE) and root mean-squared error (RMSE) results for the three country-level experiments. Percent reduction in error of each model variant compared to the STAN baseline is shown.
Table 3. Performance comparison for country-level model variations.
Prediction Using Peer Learning (Algorithm 1)
To demonstrate the advantages of peer-learning, the two closely related countries – US and UK form a peer-learning team to predict the growth of Covid-19 pandemics in two countries.
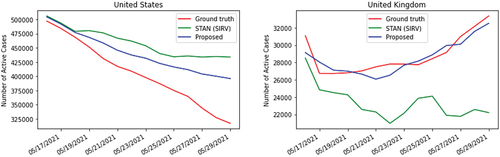
(a) and (b) compares the accuracy of peer-learning with the independent learning (namely, US and UK learn the Covid19-pandemic pattern without any collaboration). It is observed peer-learning of US and UK is more accurate than independent learning (STAN with SIRV-based loss function defined by EquationEq. 13)(13)
(13) . It can be further observed that peer-learning benefits UK’s prediction more than USA’s prediction. This observation seems consistent with the current geopolitical status of the world.
Figure 8. Peer learning (Algorithm 1) for the prediction of Covid-19 epidemics: (a) USA; (b) UK.
To improve the prediction accuracy of peer-learning about USA, some other countries that have close relation with USA should be introduced in the peer learning team.
Prediction Using Layered Ensemble Learning (Algorithm 2)
As an extension of the modified GAT described in the previous section, our proposed layered ensemble introduces hierarchical relations into the learning model of COVID-19 pandemics.
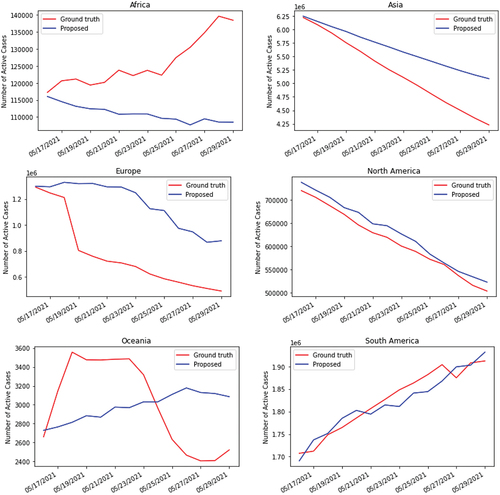
Continent MLP Prediction
Each continent MLP was trained with its corresponding countries (e.g., 16 of the 163 countries we tested are in North America). Continent-level predictions are shown in .
Figure 9. Middle ensemble layer predictions (Algorithm 2): Continent MLP trained with country SIRVC-GAT prediction: (a) Africa; (b) Asia; (c) Europe; (d) North America; (e) Oceania; (f) South America.
World MLP Prediction
The outputs of the six trained continent-level MLPs were used to train a world-level MLP. Preliminary results are shown in .
Figure 10. Final ensemble layer prediction: World MLP trained with continent MLP prediction (proposed ensemble model described by Algorithm 2) compared to 1) using randomized country grouping in the middle layer and 2) training without a middle/continent layer.
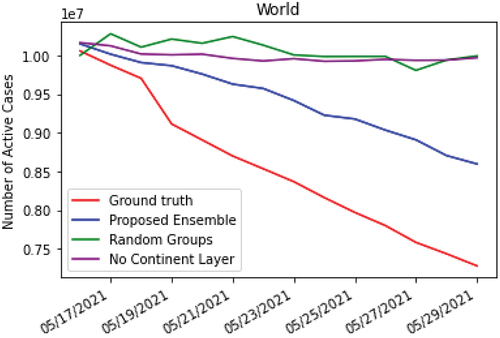
Ensemble Baseline Comparison
We tested two baselines for our ensemble model to determine the importance of the continent (middle) layer. First, we removed the continent layer and trained the world-level MLP directly with the country-level predictions (). Secondly, we randomly assigned each of the 163 countries to the six continents (27–28 countries for each continent), then used those trained continent-level MLPs to train the world-level MLP (). Our proposed ensemble method performed better compared to both of these baselines, justifying the need for the continent-based middle layer.
Error Comparison
shows the MSE and RMSE results for training the world-level ensemble model compared to the two baselines. Percent increase in error of the baselines compared to our proposed ensemble is shown.
Table 4. Performance comparison for proposed layered ensemble (Algorithm 2) against baselines.
Discussion
Discussion and Limitations
Country-level GAT Model
The proposed GAT model achieved 85% and 61% reduction in RMSE compared to the STAN baseline for the United States and United Kingdom, respectively. The proposed model included an adaptive loss function, edge weights, and a novel SIRVC model, as opposed to the fixed loss, attention scores, and SIRV model used by STAN (Gao et al. Citation2021). As part of our ablation study, we removed two components of our model to test for difference in accuracy. When we removed the adaptive loss function, we found that the United States model only achieved a 37% reduction in RMSE compared to the STAN baseline. When the edge weights (informed by flight data) were removed, the model achieved only a 22% reduction in RMSE. Similar trends were seen for the United Kingdom, although excluding edge weights did not seem to have as great of an impact on prediction (from 61% to 54% with exclusion). Note that the STAN model was developed and tested at a smaller scale (U.S. counties and states). Additionally, the STAN model used real-world medical claims data for a richer feature space, so the comparison to the “reduced” STAN model may be unfair. In this work, we demonstrate the impact of including more accurate quantification of inter-community interactions as schemes for informing spatio-temporal models (e.g., adaptive loss and mobility data), rather than attempting to develop state-of-the-art predictions.
Layered Ensemble
The three-layer hierarchical ensemble was tested against two baselines to determine the effectiveness of a geographically informed organization. We did not compare our global predictions against other ML baselines, as current models in the literature are not typically tested globally (Shinde et al. Citation2020).
Note that the focus of our work was not to develop accurate continent-level predictions, but we discuss the results briefly here. The predictions for North America, South America, Europe, and Asia appear to follow the general ground truth trends. North and South America in particular had high accuracy. In contrast, Africa (ground truth increasing) and Oceania (ground truth increasing then decreasing) showed a divergence from the predicted relationship. This might be due to the simple MLP used to implement the continent layer and the relatively lower number of cases associated with these two continents. However, the results for continents with the greatest number of cases are promising, and future work could focus on tuning the continent layer to improve predictions across the entire ensemble.
Instead, we focus our experiment and discussion on the impact of 1 including a middle layer and 2 using geographic information to inform the middle layer structure. Without the middle layer, the model’s RMSE increased by 69%, suggesting that the middle layer was indeed useful for informing the final layer’s output. When countries were randomly assigned to six different continent groups, the model’s RMSE increased by 74%, which provides preliminary evidence that incorporating geographic knowledge about real-world structure helps inform predictions for spatial models. Previous research has suggested that integrating domain knowledge can improve robustness compared to purely data-driven machine learning (Deng et al. Citation2020), which our work supports.
Future Work
To further improve the country-level GAT framework (and thereby the performance at downstream levels), additional mobility schemes should be incorporated into the graph’s edge features. For air mobility, including the number of passengers on each flight would allow for more accurate weights. For ground mobility, including the volume of ground vehicle traffic across international borders would capture more accurate, granular inter-community interactions.
Based on our experimental results, we found that our geographically informed and physics-guided layered architecture is able to handle large-scale data processing better than a two-layered or non-geographic ensemble. Future work on the layered ensemble model will consist of improving the physics-guided GAT framework and replacing the simple MLPs of the continent layer with a GAT framework that accurately models continent-level interactions. Additionally, the performance of the entire ensemble may be calibrated by feeding the global predictions back to the country-level layer. Incorporating other features, such as demographic information (country GDP) and land area vs. population size may also improve prediction. Integrating domain knowledge to enhance model performance continues to be an avenue of interest in machine learning research.
Conclusion
In this research, we devised a country-level GAT framework based upon previous work and proposed a three-layer ensemble, with the modified GAT framework as the base layer, to predict large-scale COVID-19 trends. The major changes we included to improve the accuracy of existing spatio-temporal GAT frameworks focused on improving the accuracy of inter-nodal interactions using both mathematical formulas and real-world data. After verifying the accuracy of this country-level GAT framework, we trained models for all 163 countries to create the base layer of our ensemble. The second layer used MLPs to represent continents and the third layer used another MLP to perform world-level prediction. We found that incorporating domain knowledge about geographic distribution of countries improved the prediction of our ensemble. We hope that our work demonstrates the power of hybrid and ensemble graph neural networks for pandemic prediction, the utility of these models in informing public health and policy decisions, and the potential for future work in applying hybrid models to capture complex real-world interactions.
Acknowledgments
This work was jointly sponsored by NSF #1924278, #1852042,and #1761839. Special thanks will go to Dr. Hong Qin at the Department of Computer Science and Engineering, University of Tennessee at Chattanooga, who provided a thorough support to this project. The code was partially developed based on STAN developed by Gao et al. (Citation2021).
Disclosure Statement
No potential conflict of interest was reported by the author(s).
Additional information
Funding
References
- Almeshal, A. M., A. I. Almazrouee, M. R. Alenizi, and S. N. Alhajeri. 2020. Forecasting the spread of COVID-19 in Kuwait using compartmental and logistic regression models. Applied Sciences. 10(10):3402. https://doi.org/10.3390/app101034022076-3417.
- Avelar, P., H. Lemos, M. Prates, and L. Lamb. 2019. Multitask learning on graph neural networks: Learning multiple graph centrality measures with a unified network. In artificial neural networks and machine learning – ICANN 2019: Workshop and special. In Sessions, isbn: 9783, isbn: 9783030304935, ed. 030304935, ed. I. V. Tetko, V. Kůrková, P. Karpov, and F. Theis, 701–2734. Cham: Springer International Publishing.
- Chaturvedi, D., and U. Chakravarty. 2021. Predictive analysis of COVID-19 eradication with vaccination in India, Brazil, and U.S.A. Infection, Genetics and Evolution 92 (104834):1567–1348. https://doi.org/10.1016/j.meegid.2021.104834.
- Chen, Y., T.-J. Yang, J. Emer, and V. Sze. 2018. Understanding the limitations of existing energy-efficient design approaches for deep neural networks. Energy 2 (L1):L3.
- Deng, S., S. Wang, H. Rangwala, L. Wang, and Y. Ning. 2020. “Cola- GNN: Cross-Location attention based graph neural networks for long-term ILI pre- diction.” In Proceedings of the 29th ACM International Conference on Information & Knowledge Management, 245–54. CIKM ‘20. Virtual Event, Ireland: Association for Computing Machinery. 10.1145/3340531.3411975.
- El-Rashidy, N., S. Abdelrazik, T. Abuhmed, E. Amer, F. Ali, H. Jong-Wan, and S. El-Sappagh. 2021. Comprehensive survey of using machine learning in the COVID-19 pandemic. Diagnostics. 11(7):1155.https://doi.org/10.3390/diagnostics110711552075-4418.
- ElAraby, M., O. Elzeki, M. Shams, A. Mahmoud, and H. Salem. 2022. A novel Gray-Scale spatial exploitation learning Net for COVID-19 by crawling Internet resources. Biomedical Signal Processing and Control 73 (March):103441. https://doi.org/10.1016/j.bspc.2021.103441.
- Feng, Z., S. Towers, and Y. Yang. 2011. Modeling the effects of vaccination and treatment on pandemic influenza. The AAPS Journal 13 (3):427–37. https://doi.org/10.1208/s12248-011-9284-7.
- Gao, J., R. Sharma, C. Qian, L. Glass, J. Spaeder, J. Romberg, J. Sun, and C. Xiao. 2021. STAN: Spatio-temporal attention network for pandemic prediction using real-world ev- idence. Journal of the American Medical Informatics Association 28 4 (January):733–43. https://doi.org/10.1093/jamia/ocaa3221527-974X.
- Gong, L., and Q. Cheng. 2018. Adaptive edge features guided graph attention networks. CoRR abs/1809.02709. arXiv: 1809.02709. http://arxiv.org/abs/1809.02709.
- Hamilton, W. L. 2020. Graph representation learning. Synthesis Lectures on Artificial Intelligence and Machine Learning. 14(3):1–159.
- Interim Guidance on Duration of Isolation and Precautions for Adults with COVID-19. https://www.cdc.gov/coronavirus/2019-ncov/hcp/duration-isolation.html#key-findings.
- Kapoor, A., X. Ben, L. Liu, B. Perozzi, M. Barnes, M. Blais, and S. O’Banion. 2020. Examining COVID-19 forecasting using spatio-temporal graph neural networks. CoRR. abs/2007.03113. abs/2007.03113. https://arxiv.org/abs/2007.03113
- Karpatne, A., W. Watkins, J. Read, and V. Kumar. 2018. Physics-guided neu- ral networks (PGNN): An application in lake temperature modeling. CoRR abs/1710.11431. arXiv: 1710.11431 [cs.LG].
- Kermack, W., A. McKendrick, and G. Walker. 1927. A contribution to the mathematical theory of epidemics. Proceedings of the Royal Society of London. Series A, Containing Papers of a Mathematical and Physical Cha R Acter. 115(772):700–21. https://doi.org/10.1098/rspa.1927.0118. eprint. https://royalsocietypublishing.org/doi/pdf/10.1098/rspa.1927.0118
- Liang, Y., Z. Shi, S. Sritharan, and H. Wan. 2010. Simulation of the spread of epidemic disease using persistent surveillance data. In Proceeding of COMSOL 2010, October 7-9, Boston, USA. October. eprint: https://www.comsol.com/paper/simulation-of-the-spread-of-epidemic-disease-using-persistent-surveillance-data-9134.
- Mathieu, E., H. Ritchie, E. Ortiz-Ospina, M. Roser, J. Hasell, C. Appel, C. Giattino, and L. Rodés-Guirao. 2021. A global database of COVID-19 vaccinations. Nature Human Behaviour (May), 2397–3374. doi:10.1038/s41562-021-01122-8.
- Niazkar, H. R., and M. Niazkar. 2020. Covid-19 outbreak: Application of multi-gene genetic programming to country-based prediction models. Electronic Journal of General Medicine 17 (5):em247. doi:10.29333/ejgm/8232.
- Niu, Y., L. Zhuoyang, L. Meng, S. Wang, Z. Zhao, T. Song, L. Jianhua, T. Chen, L. Qun, and X. Zou. 2021. The collaboration between infectious dis- ease modeling and public health decision-making based on the COVID-19. Journal of Safety Science and Resilience 2 (2):69–76. https://www.sciencedirect.com/science/article/pii/S2666449621000153.
- Olive, X., M. Strohmeier, and J. Lübbe. 2021. Crowdsourced air traffic data from the open- sky network 2020. Earth Syst. Sci. Data 13:357–366. doi:10.5281/zenodo.4737390.
- Prakash, K. B., S. Sagar Imambi, T. P. K. Mohammed Ismail, and Y. V. R Nagar Pawan. 2020. Analysis, prediction and evaluation of COVID-19 datasets using machine learning algorithms. International Journal of Emerging Trends in Engineering Research 8 5(May):2199–204. doi:10.30534/ijeter/2020/11785202023473983.
- Qiong, J., Y. Guo, G. Wang, and S. J. Barnes. 2020. Big data analytics in the fight against major public health incidents (Including COVID-19): A conceptual framework. International Journal of Environmental Research and Public Health 17 (17):1660–4601. https://doi.org/10.3390/ijerph17176161.
- Rai, R., and C. Sahu. 2020. Driven by data or derived through physics? a review of hybrid physics guided machine learning techniques with Cyber-Physical System (CPS) focus. IEEE Access 8:71050–73. doi:10.1109/ACCESS.2020.2987324.
- Ruder, S. 2017. An overview of multi-task learning in deep neural networks. CoRR abs/1706.05098. arXiv: 1706.05098 http://arxiv.org/abs/1706.05098.
- Scarselli, F., M. Gori, A. Tsoi, M. Hagenbuchner, and G. Monfardini. 2009. The graph neural network model. IEEE Transactions on Neural Networks 20 (1):61–80. https://doi.org/10.1109/TNN.2008.2005605.
- Shams, M. Y., O. M. Elzeki, L. M. Abouelmagd, A. Ella Hassanien, M. Hamed Abd Elfattah, and H. Salem. 2021. HANA: A healthy artificial nutri- tion analysis model during COVID-19 pandemic. Computers in Biology and Medicine 135:104606. https://www.sciencedirect.com/science/article/pii/S0010482521004005.
- Shinde, G. R., A. B. Kalamkar, P. N. Mahalle, N. Dey, J. Chaki, and A. Ella Hassanien. 2020. Forecasting models for coronavirus disease (COVID-19): A survey of the state-of-the-art. SN Computer Science 1 (4):4. https://doi.org/10.1007/s42979-020-00209-9.
- Subramanian, S., S. Sourabh Mohakuda, P. S. N. Ankit Kumar, A. Kumar Yadav, K. Chatterjee, and K. Chatterjee. 2021. Systematic review of predic- tive mathematical models of COVID-19 epidemic. SPECIAL ISSUE: COVID-19 - NAV- IGATING THROUGH CHALLENGES, Medical Journal Armed Forces India 77:S385–S392 . https://doi.org/10.1016/j.mjafi.2021.05.005.
- Velickovic, P., G. Cucurull, A. Casanova, A. Romero, P. Liò, and Y. Bengio. 2018. Graph Attention Networks. arXiv. arXiv:1710.10903 [ stat.ML].
- Wang, P., X. Zheng, A. Gang, D. Liu, and B. Zhu. 2020. Time series prediction for the epidemic trends of COVID-19 using the improved LSTM deep learning method: Case studies in Russia, Peru and Iran. Chaos, Solitons, and Fractals. 140(110214):0960–0779.https://www.sciencedirect.com/science/article/pii/S096007792030610X.
- Willard, J., X. Jia, S. Xu, M. Steinbach, and V. Kumar. 2021. Integrating scientific knowledge with machine learning for engineering and environmental systems. arXiv. arXiv: 2003.04919 [physics.comp-ph].
- Zhang, Y., and Q. Yang. 2017. A survey on multi-task learning. CoRR abs/1707.08114. arXiv: 1707.08114. http://arxiv.org/abs/1707.08114.