
 ?Mathematical formulae have been encoded as MathML and are displayed in this HTML version using MathJax in order to improve their display. Uncheck the box to turn MathJax off. This feature requires Javascript. Click on a formula to zoom.
ABSTRACT
The demand for skilled labor has increased dramatically in the current knowledge-based economy, which is characterized by the growing intensity in labor market competition between firms. Therefore, it would be of special interest to identify future labor market competitors. At present, with the vast amount of textual data, the existing study focuses on constructing the human capital overlap and product overlap metrics with the text data as predictors to predict the labor market competition in the United States. Based on these metrics, this paper experiments with machine learning methods to predict Chinese labor market competition with Chinese text data. Furthermore, sentiment analysis is becoming popular and it has been used in a wide variety of fields. However, due to lack of data, there are few existing studies using sentiment analysis approach of firms’ online reviews. In response to this research gap, this paper constructs the sentiment analysis metric by mining the emotional content expressed in the firms’ online reviews on Maimai’s platform. The results show that our proposed metrics have superior predictive power over conventional measures and highlight the predictive utility of proposed sentiment analysis metric. Moreover, the nuanced two-dimensional competition analysis gives some interesting results.
Introduction
The demand for skilled labor has increased dramatically in the current knowledge-based economy, which is characterized by the growing intensity in labor market competition between firms. However, the rapid changes in science and technology make it more difficult for firms to adequately train and develop employees to meet firms’ demands for talent by themselves, and they increasingly rely on the acquisition of human assets from other firms to satisfy their human capital needs (Cappelli Citation2008; Lee, Mauer, and Xu Citation2018). Consequently, it would be of special interest to identify future labor market competitors, which is crucial for all firms’ future strategic development (Friesenbichler and Reinstaller Citation2021).
At present, the vast amount of textual data is rapidly increasing. Liu, Pant, and Sheng (Citation2020) saw the opportunity for identifying labor market competitors in light of the increasing availability of textual data and recent advances in big data analytics, and used the textual data to construct the human capital overlap and product overlap metrics as predictors to predict the labor market competition in the United States. Based on these metrics, this paper tries to experiment with machine learning methods to predict Chinese labor market competition with Chinese text data. Furthermore, sentiment analysis has become popular lately (Bandhakavi et al. Citation2021; Osmani, Mohasefi, and Gharehchopogh Citation2020; Rehman et al. Citation2021; Yan et al. Citation2021), which has been widely used in online tourism reviews (Luo et al. Citation2021), product reviews (Al-Sharuee, Liu, and Pratama Citation2021; Vo, Nguyen, and Ock Citation2020), stock market data (Yin, Wu, and Kong Citation2020) and so on. However, due to lack of data, there are few existing studies using sentiment analysis approach of firms’ online reviews. In fact, Maimai’s platform can provide a rich data foundation for this research, where employees can post their reviews about firms. These reviews may affect job satisfaction of employees and whether the individual works there. In response to this research gap, this study takes the human capital overlap and product overlap metrics as the basic metrics, and is a first attempt to construct the sentiment analysis metric by mining the emotional content expressed in the firms’ online reviews on Maimai’s platform, which could provide the great predictive power for identifying labor market competitors and deliver deep insights into labor market competition.
The contributions of this paper are presented as follows:
● Based on the human capital overlap and product overlap metrics, we propose the sentiment analysis metric as a predictor to predict Chinese labor market competition by applying Support Vector Machines (SVM) for binary sentiment classification of firms’ online reviews on Maimai’s platform.
● We predict Chinese labor market competition experimented with a number of state-of-the-art machine learning methods by using these metrics.
● We perform the two-dimensional (2D) competition analysis of typical industries to provide a more nuanced picture of the Chinese industry-specific competitor landscape.
The remainder of this paper is organized as follows. Section 2 gives a brief overview of the related work. Section 3 describes the datasets and predictors. Section 4 presents empirical results of the prediction models and performs the nuanced 2D competition analysis. Section 5 gives the conclusions.
Related Work
Extensive literature investigated labor market competition based on the product overlap and human capital overlap from different perspectives. In this part, the literature on conventional methods for measuring product overlap and human capital overlap is reviewed, respectively. Next, the paper that applied sentiment analysis approaches is also reviewed.
The Measures of Product Overlap
The product overlap of firms is a basic predictor of their labor market competition, and the measure of product overlap has attracted more attention in the field of competitor analysis. Hou and Robinson (Citation2006) and Giroud and Mueller (Citation2011) used the Herfindahl Index to measure product market competition. Nonetheless, this measure only represents the overlap within a product market or even within an industry, it has less ability to represent both within and across industry similarity in product market and typically has much stronger data requirements.
Then, some studies see the opportunity for a new and more general methodology in light of the increasing availability of public, unstructured data and recent advances in big data analytics (Java et al. Citation2007). To capture the relatedness of firms in the product market space, Hoberg and Phillips (Citation2010) evaluated the similarity of the text in product descriptions. Li, Lundholm, and Minnis (Citation2013) applied a competition measure in the product market derived from the textual analysis of firms’ 10-K filings by ranking the frequency of competition-related words each year and putting it into deciles. Yet, they only can measure the average competition pressure faced by the available firms.
Pant and Sheng (Citation2015) used firms’ websites and hyperlinks to measure the product similarity and predict product market competitors. Some commercial firm profiling companies such as Hoover’s and Mergent manually identified product market competitors. However, because of the scale and dynamic nature of the problem, the methods require more manual preprocessing and may increase the complexity of representing the business environment.
Overall, the previous measures are quite incomplete and do not explicitly cover the product and market spaces when identifying competitors. Shi, Lee, and Whinston (Citation2016) proposed a new data-analytic approach to measure firms’ product overlap based on industry classifications and business descriptions. Specifically, they analyzed the unstructured texts that describe firms’ businesses using the statistical learning technique of topic modeling, and constructed a novel business proximity measure based on the output. When compared with other methods, this approach is scalable for large datasets and provides finer granularity on quantifying firms’ positions in the spaces of product, market, and technology.
Therefore, following Shi, Lee, and Whinston (Citation2016), this paper constructs the product overlap metrics as the predictors in section 3.2.1 to identify Chinese labor market competitors.
The Measures of Human Capital Overlap
The human capital overlap of firms is an important predictor of their labor market competition, and a challenging problem that arises in identifying labor market competitors is the measure of human capital overlap at the level of a firm. Leping (Citation2009) constructed a skill-based measure for human capital specificity and the measure is based on the possibilities of making use of skills on the labor market, which depends on the number of jobs where any particular skill is required in labor market. Dallimore (Citation2010) proposed an inclusive measure of human capital by integrating traditional measures of human capital and non-accounting measures (e.g., educational level, experience, and motivation). Santarelli and Thu (Citation2013) chose individual-level professional education, start-up experience, and learning to measure human capital, the first two dimensions of human capital are measured with traditional indicators and they defined learning as the ability to accumulate knowledge to conduct innovation activities (new product introduction, product innovation, and process innovation). Hun, Mauer, and Qianying (Citation2018) obtained an industry occupation profile vector with elements equal to the proportion of total employment in the industry’s occupations to measure human capital similarities among different firms. Sasso and Ritzen (Citation2019) investigated human capital measures by sectoral skills that defined as the average cognitive skills of the workforce in each country-sector combination. Yang (Citation2020) used a more sophisticated measure of the human capital, in addition to education, which focuses on the skills derived from self-assessed investments in job-specific human capital.
However, most of the research in this field is aimed at measuring the explicit knowledge and skills, the implicit knowledge (Grant Citation1996) held by employees remains an open problem in the human capital measure, which is also an important aspect of human capital. Liu, Pant, and Sheng (Citation2020) addressed these problems of human capital measure with a unique longitudinal employer-employee matched data set from the information of online users’ public profile pages. They proposed novel human capital overlap metrics based on firms’ skill endowment and their embedded human capital flow (HCF) network structure, which can capture the interfirm similarities in the explicit knowledge and tacit knowledge base, respectively. Thus, the metrics could be applied more generally to empirically test other human capital and firm strategy theories and derive business intelligence (Newbert Citation2007).
Hence, following Liu, Pant, and Sheng (Citation2020), this paper constructs the human capital overlap metrics as the predictors in section 3.2.2 to identify Chinese labor market competitors.
Sentiment Analysis
Sentiment analysis can be used to help us obtain emotional information by mining and analyzing the emotional content expressed and aim to predict the orientation of sentiment present on the massive textual data (Abbasi, Chen, and Salem Citation2008). This type of analysis is mainly divided into dictionary-based sentiment analysis and machine learning-based sentiment analysis.
Dictionary-Based Sentiment Analysis
Taboada et al. (Citation2011) presented a lexicon-based approach to extracting sentiment from text. Hogenboom et al. (Citation2014) explored the expansion of lexicon-based sentiment analysis from English to Dutch, and they created the language-specific lexicon through semantics. Sharma and Dutta (Citation2021) applied Lexicon-based methods, which used sentiment orientation scores of words contained in the text for polarity determination of documents.
However, dictionary-based sentiment analysis is limited by the richness of context and semantic expression, and these constraints usually make the accuracy rate low.
Machine Learning-Based Sentiment Analysis
Sentiment analysis methods based on different machine learning algorithms are used for sentiment classification in the existing studies (Mohammadi and Shaverizade Citation2021; Indrawan et al. Citation2020).
Shyamasundar and Jhansi (Citation2020) proposed a multi-tier architecture for sentiment classification, the sentiments of large amount of tweets generated from Twitter have been analyzed using machine learning algorithms. Similarly, Saura, Palacios-Marqués, and Ribeiro-Soriano (Citation2022a) applied machine learning algorithms for sentiment analysis of tweets. In another study, Textblob worked with machine learning to perform sentiment analysis (Saura, Ribeiro-Soriano, and Iturricha-Fernández Citation2022b).
The SVM is regarded as one of the most effective machine learning algorithms for sentiment classification (Bogawar and Bhoyar Citation2018). Furthermore, a number of works have shown that by using SVM, not only the classification efficiency can be improved, but also the Vapnik–Chervonenkis (VC) dimension can be reduced (Dangi, Bhagat, and Dixit Citation2021; Liu, Bi, and Fan Citation2017; Na, Khoo, and Wu Citation2005).
In summary, the SVM can provide good technical support for research in sentiment classification. Therefore, this paper proposes our sentiment analysis metric as a predictor to identify Chinese labor market competitors by applying SVM in section 3.2.3.
Datasets and Predictors
Datasets
We seeded the data by focusing on all China’s A-Share listed firms (4,616 firms in total, including all A-Share listed firms in Shanghai and Shenzhen Stock Markets in China) in the CSMAR Database (China Stock Market & Accounting Research Database) as of December 2020. One reason for choosing these listed firms as our seeds is that they are involved with various industries in China Mainland, thus leading to a diversity of firms in our data set. In addition, because these listed firms represent the most valued firms by the market, their employees on average would tend to represent the more highly valued human capital.
Maimai is a China-based career and social-networking platform, it now has tens of millions of users and is the most used professional social networking site in China. This gives us the chance to select 3,025 China’s A-share listed firms that have more than 100 employees with real-name registrations and complete public profiles on Maimai’s platform. Then, we crawled a total of 50,508 public profiles of these employees, who are monthly active users and more likely to be the target of labor market competition between firms. The employee’s profile contains job experiences, occupation tags, and education information. In particular, the job experience of an individual includes the firm name and the start and end dates of this job experience. Hence, from an individual’s job experiences, we can observe where the individual was working (among the 3,025 firms included in our study) in a particular year. As a result, a total of 78,027 source-target-year firm pairs from 2006 to 2020 are included in our analysis. The occupation tags of an individual report a set of skill terms to indicate the human capital the individual possess. We can aggregate these individual skill terms at the firm level. Furthermore, we can construct a skill summary for each firm. shows the top-10 skills for some of the firms in different industries in 2019, where each skill term is weighted by the number of employees at the given firm that reported it. The education information reports the individual’s college or higher level of education information.
Table 1. Top-10 skills of example firms in 2019.
In addition to seeding our data from a diverse set of firms, we perform robustness checks to verify the representativeness of our data, as described in Appendix A. Firstly, we confirm that our data includes firms across all major industry groups, and their distribution across industries is similar to all China’s A-Share listed firms included in CSMAR Database. Secondly, we test how our sample matches with all employees at different firms over time to confirm that our data are a reasonable representation of firms in terms of their relative sizes. Finally, based on employee skills and business summaries of firms in our data, we show that the skills of the employees in our sample data are good representatives of the business activities of their respective firms.
Predictors
The product overlap metrics, human capital overlap metrics, sentiment analysis metric and basic economic metrics of a pair of firms can be expected to be the predictors of their labor market competition.
Product Overlap Metrics
The product overlap between firms includes Industry Code similarity, the similarity between two firms’ business scopes, business scope topics, main businesses, and main business topics. According to Industry Code Classification (The Guidance for Industry Classification of Listed Companies released by China Securities Regulatory Commission in 2012) and following Shi, Lee, and Whinston (Citation2016), we define Industry Code similarity () between a pair of firms as shown in .
Table 2. Metric for measuring Industry Code similarity () between firms.
Obviously, the Industry Code of a firm may not reflect all the different and granular product spaces in which the firm operates. Then, we also compute firm pair not only cosine similarity in the text terms in their business scopes () and business scope topicsFootnote1 (
), but also cosine similarity in the text terms in their main businesses (
) and main business topicsFootnote2 (
) as the complementary metrics. The results are shown in , , and in Appendix B, respectively.
Human Capital Overlap Metrics
And there are usually two aspects of human capital overlap – labor overlap and HCF network overlap (Liu, Pant, and Sheng Citation2020).
Labor overlap includes skill-term similarity and skill topic similarity, which can capture the interfirm similarities in the explicit knowledge base.
Firstly, we define the skill-term similarity. In our data, 50,508 employees reported their 5,022 distinct skill terms in their profiles’ occupation tags, which is the basis for the construction of interfirm skill-based similarity metrics (the skill terms that are reported by more than one employee are included). As described in section 3.1, we constructed a skill summary for each firm by aggregating the skill terms of its employees in a particular year (see ). For firm , we denote
in
space as its skill vector, where
5,022 is the set of all skill terms across employees in our data. Furthermore,
stands for each element of
, which can be calculated as follows:
Where the skill frequency is defined as the number of employees at firm
that reported the skill term
in their profiles. The inverse firm frequency
is defined as
, where
is the total number of firms, and
is the number of firms whose skill summary contains the skill term
.
Based on this formular, we measure skill-term similarity () in the human capital at two firms by the cosine similarity between the skill vectors corresponding to firms
and
as follows:
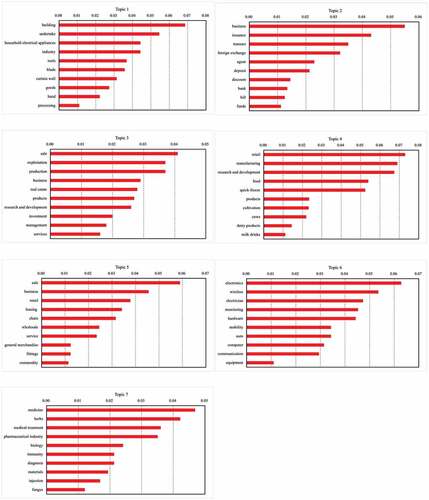
Secondly, we define the skill topic similarity. We apply Latent Dirichlet Allocation (LDA) (Blei Citation2012; Blei, Ng, and Jordan Citation2003) to discover the skill topics in the employees’ skill terms. To apply the LDA algorithm, we need firstly determine the number of latent topics. Based on in Appendix C, we set the number of skill topics as nine because it provides semantically meaningful topics. Then, the LDA algorithm represents each of the nine skill topics with a distribution over the 5,022 skill terms (The top-10 skill terms with the highest probabilities for each of the nine skill topics are shown in in Appendix C). Therefore, each employee in our data can be represented by nine probability values corresponding to the nine skill topics and each firm in a year can be represented by a vector
of size nine, where each element of the vector is the sum of its employees’ probabilities for that skill topic. Eventually, we calculate skill topic similarity (
) in the human capital at two firms by the cosine similarity between the skill topic vectors corresponding to firms
and
as follows:
The HCF networkFootnote3 overlap includes the upstream similarity and downstream similarity, which could provide cues to measure the human capital overlap in terms of tacit knowledge (Liu, Pant, and Sheng Citation2020).
Firstly, we define the upstream similarity. For firm , we denote
in
space as its upstream vector, where
is the set of all firms nodes in the HCF network. The element
of
is the number of employees who have moved in the past from firm
to firm
Therefore,
represents the distribution of employees who have migrated to firm
over all firms. Then, we define the upstream similarity (
) between firms
and
by the cosine similarity between the upstream vector
and
corresponding to the firms as follows:
Similarly, the downstream vector stands for the distribution of employees who have moved from firm
to other firms, and we can also denote the downstream similarity (
) between a pair of firms as:
Sentiment Analysis Metric
Sentiment analysis has become popular lately, which has been widely used in online tourism reviews (Luo et al. Citation2021), product reviews (Al-Sharuee, Liu, and Pratama Citation2021; Vo, Nguyen, and Ock Citation2020), stock market data (Yin, Wu, and Kong Citation2020) and so on. However, due to lack of data, studies on sentiment analysis of the firms’ online reviews are few to identify future labor market competitors. In fact, Maimai’s platform can provide a rich data foundation for this research, where employees can post their reviews about firms. These reviews of firms are mainly about the wages, working hours, autonomy given to employees, organizational structure and communication between employees and management, which may affect job satisfaction of employees and whether the individual works there. For predicting labor market competition, we crawled a total of 5,125 online reviews of listed firms on Maimai’s platform from 2006 to 2020 and construct our sentiment analysis metric, which may provide the great predictive utility for identifying labor market competitors and deliver deep insights into labor market competition. (Several reviews of listed firms are provided as examples in Appendix D).
In this paper, we use Python program to construct the sentiment classification model. The specific process is as follows:
(1) This study uses Python and Jieba Chinese word segmentation library to complete the processing of the sample text-based data. During word segmentation, we initially remove all punctuations and various symbols by regularity, obtain pure text, and then load the stop word library and self-built vocabulary for word segmentation. We select the stop words used by the latest version of the NLPIR participle of the Chinese Academy of Sciences. Concurrently, we construct a specific lexicon on the basis of the existing thesaurus to prevent the division of names of firms and other words with special characteristics in this field.
(2) The SVM model training only supports numerical samples; thus, the sample text data should be quantized. Word2Vec is widely used in natural language processing tasks (e.g., text sentiment analysis) as the basic technology in the field of natural language processing (Zhang et al. Citation2015). We use the Wiki Chinese corpus as the original sample and select the Word2Vec model of the Gensim library for training and CHI square method as a feature extraction method.
(3) This study manually marks 1,000 positive online reviews and 500 negative online reviews as the training set. To obtain the ideal model, we use Python’s scikit-learn library, continuously debug the parameters of the model and verify the actual classification effect of the model with 600 manually marked reviews. The area under the receiver operating characteristics (ROC) curve (AUC) is 0.9037 (AUC is equivalent to the probability that a randomly chosen positive sample will be ranked higher than a randomly chosen negative sample), which indicates that the model is considered to have high accuracy. Then, we classify the remaining reviews as positive or negative and calculate the proportion of positive reviews of each firm, the takes 1 if the proportion of positive reviews of a firm greater than 0.5 or 0 otherwise.
Basic Economic Control Metrics
In the preceding section, we proposed a set of metrics for the product overlap, human capital overlap and sentiment analysis, and our goal is to predict labor market competition, we also include a set of basic economic control features that are the most commonly used in the literature and are expected to cue such labor market competition (Hom et al. Citation2017; Markman, Gianiodis, and Buchholtz Citation2009; Nyberg et al. Citation2014). In order to indicate the current economic state, power, and maturity in the labor market of firms, we record for each firm its revenue, revenue growth rate, number of employees and growth rate in the number of employees from CSMAR Database.
Besides, the education information can be expected to provide signals on identifying labor market competition (Mora, García-Aracil, and Vila Citation2007), based on the education information available in public profiles, we compute the average number of years current employees have been working after college, the percentage of employees with a master’s or PhD degree, the average ranking of employees’ bachelor’s degree granting universities and master’s or PhD degree granting universities according to Best Global Universities Rankings in 2020 released by U.S.News, respectively.
Moreover, we also calculate a set of important control variables for our prediction, which includes (the previous year’s number of employees moved between firm pairs),
and
(the current and previous year’s number of employees who move from a target to a source firm, respectively),
and
(the current and previous year’s number of incoming employees minus number of employees leaving a firm, respectively).
In summary, this paper calculates four sets of features for our predictive analysis: basic economic metrics, product overlap metrics, human capital overlap metrics and sentiment analysis metric (see ).
Table 3. Summary of predictors.
Results
The employee mobility between firms is a key reflection of interfirm labor market competition (Chen, Michel, and Lin Citation2021; Gardner Citation2002, Citation2005), hence, this paper selects the in a given year as the target variable of predictive framework and experiments with above proposed set of metrics for the prediction of future labor market competition, which is operationalized using
values.
Outcome Variable
Based on the academic literature and practice of labor market competition where firms are either seen as competitors or not, this study transforms the numeric values into a binary interfirm labor market competition indicator
as the outcome variable depending on whether the
value between the source and target firms meets a threshold
:
Because in our data set, any observed positive value may indicate a significant HCF between the two firms. Moreover, for all firm pairs with a positive
value in our data, 76.16% have
equal to one, 12.93% have
equal to two, and the remaining
is greater than or equal to three. For this purpose, the three different
values need to be set to constitute three different definitions of labor market competition. The larger HCF threshold can indicate a stronger labor market competition relationship between two firms. When
= 1, we can identify all labor market competitors that have any HCF between them in a given year. When
= 2, we can identify the moderate and strong labor market competitors. When
= 3, we can only identify the strong labor market competitors, and as seen in , this reduces the list of competitor pairs to a small fraction of the data.
Table 4. Data set summary.
Predictive Methods
Based on the metrics constructed in the preceding section and as summarized in , we use observations from the years 2006 to 2018 for training the predictive methods and evaluate the predictions from the different methods for the observations in 2019 and 2020. Of the training data, we use observations in 2017 and 2018 as the validation set for hyperparameter tuning. The data set summary is shown in .
The popular machine learning methods such as regularized Logistic Regression (LR), K-Nearest Neighbors (KNN), Support Vector Machines (SVM) and Decision Tree (DT) as baseline methods are included in this study for prediction. In addition, we experiment with predictive methods that use an ensemble approach of training multiple methods and then aggregate their output to lower the resulting prediction errors. These methods include Bootstrap aggregation or Bagging of Logistic Regressions (Bag(LR)), Bagging of Support Vector Machines (Bag(SVM)), as well as a tree-based ensemble method, Random Forest (RF). Finally, the deep learning methods such as Multilayer Perceptron (MLP), Convolutional Neural Network (CNN) and Long Short-Term Memory (LSTM) as predictive methods are also included in this paper for the prediction.
Prediction Results
For the predictive analysis, we use variables from year to predict the labor market competition outcome variable as defined in year
with a total of 78,027 source-target-year firm pair instances among 3,025 listed firms from 2006 to 2020. Specifically, to analyze the HCF between firms, we evaluate our models, first with just the economic metrics, followed by incrementally adding product overlap as the base models, then we add the human capital overlap and our proposed sentiment analysis metric as the alternative 1 and alternative 2 models, respectively.
shows the predictive performance of various machine learning methods (columns) with different sets of predictors (rows) in terms of AUC. The AUC of a classifier is equivalent to the probability that a randomly chosen positive sample (competitors) will be ranked higher than a randomly chosen negative sample (noncompetitors), where the ranking is based on the predicted probabilities.
Table 5. Prediction performance in area under the receiver operating characteristic (ROC) curve (AUC).
From we can find that: firstly, by comparing the predictive performances of our base models (i.e., Economic + Product) with the alternative 1 models (i.e., Economic + Product + Human), we observe that models including the human capital overlap metrics outperform models without them in panel A, B, and C. In other words, the results show that all types of labor market competitors are more likely using similar human capital metrics and hence require similar explicit and tacit knowledge inputs from labor. This indicates that comparing the base models with the alternative 1 models, the addition of the human capital overlap metrics is helpful for identifying labor market competitors across predictive methods in panel A, B, and C.
Secondly, the predictive utility of sentiment analysis metric is also clear in panel A, B, and C from . In particular, comparing panel A with panel B and panel C, we see the large improvements in AUC of the alternative 2 models (i.e., Economic + Product + Human + Sentiment) for all methods in panel B and C. Specifically, the improvement in predictive performance can range between 12.00% (CNN) and 22.80% (DT) in panel B, and between 9.46% (Bag(SVM)) and 24.60% (LR(L1)) in panel C. This might be because when labor market competition relationship between two firms is moderate or strong, the work environment of a firm, such as company culture, working conditions, feelings of wellbeing, workplace relationships, collaboration, and efficiency can notably impact whether an individual works there. Therefore, the moderate or strong competitors usually provide the comfortable work environment to attract more talent.
Finally, the best-performing methods are highlighted in boldface in . Overall, the best-performing method is the ensemble-based RF using all four types of predictors. This is consistent for all values of . A random classifier would achieve an AUC of 0.5, while in panel A, it achieves an AUC of 0.9022, which means our best-performing method hence can substantially outperform a random baseline classifier. In particular, it is expected to identify a competitor pair over a noncompetitor pair without HCF correctly in the test set with a probability of 0.9022. Similarly, the RF with four metrics is also the most effective in identifying the moderate and strong or only strong labor market competitors, as shown in panel B and panel C of .
In brief, by using basic economic metrics, product overlap metrics, human capital overlap metrics, and proposed sentiment analysis metric, along with RF methods, this study can provide strong predictive performance for identifying future labor market competitors. Furthermore, when the labor competition between a pair of firms is moderate or strong, the sentiment analysis metric of firms can provide obvious predictive utility.
Discussion
The labor market competition does not exist just within an industry but can span a diverse set of firms across industries in China. The 2D competition analysis can depict this labor market competitor landscape directly and vividly based on both the product and human capital overlap. Hence, this paper also performs the 2D competition analysis of all China’s A-Share listed firms and typical industries in our data separately, which could provide a more nuanced picture of the Chinese industry-specific competitor landscape.
2D Competition Analysis
This paper performs the 2D competition analysis of all China’s A-Share listed firms and two typical industries in our data separately.
The 2D competition analysis can classify competitors into four types, and depending on different types of competitors, a firm may have vastly different strategies for acting on the discovery. We place each firm pair into one of the four quadrants and each quadrant signifies different levels of similarities in the product and human capital dimensions, as shown in . For a focal firm, the firms in the quadrant I that produce similar products and have similar human capital needs are categorized as direct competitors and the indirect competitors in the quadrant II are likely to be firms that use different technologies for the production of similar products, which leads to the differences in their human capital needs. The firms in the quadrant III are weak competitors that have dissimilar products and human capital endowments and the firms may be put into the quadrant IV as potential competitors because they produce different products and yet may possess a similar set of human capital.
Figure 1. Two-dimensions of interfirm competition
Since the ,
,
and
provide somewhat different information, we take the average of these five measures to measure a firm pair’s product market overlap, which can combine the different levels of granularity of information on interfirm product overlap. Similarly, we take the average of a firm pair’s
,
,
and
to measure their human capital overlap, which can measure the similarity in the explicit and tacit knowledge of two firms simultaneously.
Discussion of 2D Competition Analysis of All Firms
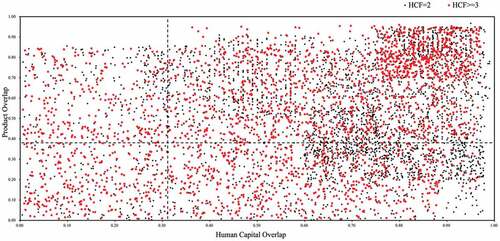
For ease of visualization, plots the moderate and strong competitors (i.e., = 2). The black dot indicates the
is equal to two and the red dot indicates the
is greater than or equal to three. The dashed lines plot the median values of the product overlap and the human capital overlap given all firm pairs in our data, and hence, the median lines divide the plot into four quadrants. Obviously, shows that most of the labor market competition appears in the quadrant I, which corresponds to direct competitors. As expected, firm pairs with both high product and human capital overlap usually have higher levels of HCF.
Figure 2. The 2D competition plot for all firm pairs
Discussion of 2D Competition Analysis of Typical Industries
In order to provide a more nuanced picture of the industry-specific competitor landscape, we also perform the 2D competition analysis of information technology (IT) industry and automotive industry separately (see ).
Figure 3. The 2D competition analysis for firm pairs with IT industry as source firms
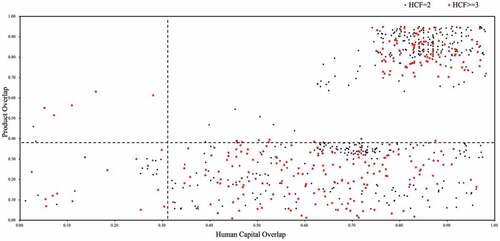
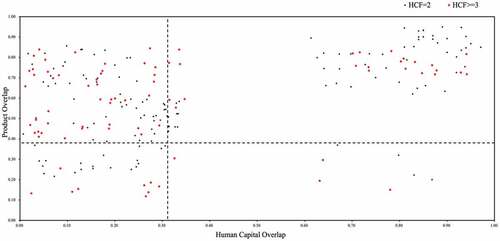
Figure 4. The 2D competition analysis for firm pairs with automotive industry as source firms
shows a competitive landscape for the source firms that are in the industry of IT, such as Yonyou Network, China Greatwall Technology Group, Iflytek, and so on. Clearly, the labor market competitors faced by IT firms are mostly other firms with high product and labor market overlap simultaneously. While, there are many firm pairs in the quadrant IV, indicating the HCF from IT industry to a wide variety of non-IT industries (e.g., financial industry, retail industry, pharmaceutical industry, and education industry). In particular, with the development of “Internet+” action, the listed firms in pharmaceutical industry are setting up cooperative medical network information platforms with the internet firms, so as to provide online medical services through internet technology. For example, Kangmei Pharmaceutical has begun to layout “Internet + Healthcare” strategy in recent years, which includes Business-to-Business (B2B), Business-to-Customer (B2C), Online to Offline (O2O) and internet medical services. And BY-HEALTH (a pharmaceutical firm) established Electronic Medical Record (EMR) systems in 2015. Moreover, it has been an irresistible trend to vigorously expand the emerging industry of online and offline “Internet + Healthcare” services after the COVID-19 pandemic (Tijani, Osagie, and Afolabi Citation2021; Valaskova, Ward, and Svabova Citation2021). In fact, mobile payment technologies, cloud computing, artificial intelligence and location-based services, fueled by the rise of the “Internet+” action, are facilitating the HCF from IT industry to financial and retail industries. In line with our finding, Kovacova and Lewis (Citation2021) also noted that in addition to IT industry, deep learning algorithms are used in more industries in the era of big data, which requires more IT talent. This presumably reflects the strategy of firms in non-IT industries to accelerate their internet technology innovation by hiring IT talent. Despite these firms in non-IT industries have low product overlaps with many firms in IT industry, they have human capital needs that are similar to those of firms in IT industry. Therefore, for some firms in IT industry, these listed firms in non-IT industries are potential competitors, as shown in . In summary, the diverse target firms for the HCF from firms in IT industry are a reflection of the general applicability of IT knowledge to other industries (Durana, Perkins, and Valaskova Citation2021).
shows a subset of firm pairs where the source firms are in automotive industry. From we can find that in addition to many firm pairs being in the quadrant I, there are also many firm pairs in the quadrant II, which shows a different competitive landscape from (the source firms that are in the industry of IT). Since 2010, China’s government has issued many policies designed to support the rapid development of new energy vehicles (NEVs) as a critical strategy for the automobile industry (Lazaroiu, Kliestik, and Novak Citation2021). Leading auto firms (e.g., BYD and FOTON) have promoted the pace of the auto market’s transformation to new energy, which can realize the substitution effect on the fuel vehicle market gradually. Similarly to Kliestik et al. (Citation2020) finding that this probably reflects the strategy of these firms to increase production capacity by hiring more talent from traditional auto firms that mainly produce conventional and fossil fuel-powered vehicles. Because some NEV components are different from fuel vehicle components, these traditional auto firms are indirect competitors in the quadrant II that use different technologies for the production of similar products, which leads to the differences in their human capital needs.
Conclusions
To predict future labor market competition, in addition to selecting the metrics of economic, product overlap and human capital overlap as the basic metrics, this paper proposes our sentiment analysis metric by mining the emotional content expressed in the 5,125 online reviews on Maimai’s platform, and experiments with a number of state-of-the-art machine learning methods by using a total of 78,027 source-target-year firm pair among 3,025 China’s A-Share listed firms and online profiles of 50,508 employees from 2006 to 2020. Moreover, in order to provide a more nuanced picture of the competitor landscape, we perform the 2D competition analysis of all listed firms and typical industries (IT industry and automotive industry) separately.
The study leads to the following conclusions: firstly, using the alternative 2 models (i.e., Economic + Product + Human + Sentiment) along with RF methods can provide strong predictive performance for identifying future labor market competitors, which can achieve the AUC of 0.9022 for = 1, 0.9432 for
= 2 and 0.8869 for
= 3.
Secondly, the results of the alternative 1 models (i.e., Economic + Product + Human) show that the addition of the human capital overlap metrics is helpful for identifying labor market competitors across predictive methods. Moreover, when the labor competition between a pair of firms is moderate or strong, the sentiment analysis metric can provide obvious predictive utility, which means that providing the positive and comfortable work environment is an important way for the firms to attract more talent.
Finally, all firm pairs with both high product and human capital overlap usually have higher levels of HCF. However, different typical industries have different competitor landscapes. Specifically, for some firms in IT industry, there are many potential competitors in a wide variety of non-IT industries (e.g., financial industry, retail industry, pharmaceutical industry and education industry), while the leading auto firms have many indirect competitors within an industry.
Theoretical Implications
With regard to theoretical implications of our findings, by applying publicly available data from Maimai’s platform, this study takes the human capital overlap and product overlap metrics as the basic metrics, and is a first attempt to construct the sentiment analysis metric by mining the emotional content expressed in the firms’ online reviews, which could provide the great predictive power for identifying labor market competitors and deliver deep insights into labor market competition.
Practical Implications
Our prediction framework can be used to form the basis of a targeted recruitment strategy, help the firms design the more effective talent retention programs and track where employees likely may be leaving, which is crucial for a firm’s future strategic development. Moreover, based on the results from the nuanced two-dimensional competition analysis, the government and firms can apply different strategies for different labor market competitors.
Limitations and Future Research
The limitations of this study are related to its simple treatment of the data. Sentiment as a predictor might be classified more categories and takes some continuous values, which may bring the challenge of analyzing labor market competition. However, this paper establishes a theoretical framework for the analysis of labor market competition in future research. Moreover, our proposed framework can be applied to other fields, such as analyzing the agricultural market by using comments from farmer forums and the market of healthcare service delivery by using online patient reviews from the healthcare community platforms.
Disclosure Statement
No potential conflict of interest was reported by the author(s).
Notes
1. We apply the LDA algorithm to detect latent business topics from textual business scopes and main businesses of firms that are available from the CSMAR Database, and we provide the business scope and main business of ZTE Corporation in Appendix B as an example.
2. We apply the LDA algorithm to detect latent business topics from textual business scopes and main businesses of firms that are available from the CSMAR Database, and we provide the business scope and main business of ZTE Corporation in Appendix B as an example.
3. in Appendix C plots a subgraph of the HCF network among the five firms across different industries in 2019.
References
- Abbasi, A., H. Chen, and A. Salem. 2008. Sentiment analysis in multiple languages: Feature selection for opinion classification in web forums. ACM Transactions on Information Systems 26 (3):1211–2854. doi:10.1145/1361684.1361685.
- Al-Sharuee, M. T., F. Liu, and M. Pratama. 2021. Sentiment analysis: Dynamic and temporal clustering of product reviews. Applied Intelligence 51 (1):51–70. doi:10.1007/s10489-020-01668-6.
- Bandhakavi, A., N. Wiratunga, S. Massie, and D. P. 2021. Emotion-Aware polarity lexicons for twitter sentiment analysis. Expert Systems 38 (7):e12332. doi:10.1111/exsy.12332.
- Blei, D. M. 2012. Probabilistic topic models. Communications of the ACM 55 (4):77–84. doi:10.1145/2133806.2133826.
- Blei, D. M., A. Y. Ng, and M. I. Jordan. 2003. Latent Dirichlet allocation. Journal of Machine Learning Research 3:993–1022. doi:10.1162/jmlr.2003.3.4-5.993.
- Bogawar, P. S., and K. K. Bhoyar. 2018. An improved multiclass support vector machine classifier using reduced hyper-plane with skewed binary tree. Applied Intelligence 48 (11):4382–91. doi:10.1007/s10489-018-1218-y.
- Cappelli, P. 2008. Talent management for the twenty-first century. Harvard Business Review 86 (3):74–81. doi:10.1007/s10726-007-9078-6.
- Chen, M.-J., J. G. Michel, and W. Lin. 2021. Worlds apart? Connecting competitive dynamics and the resource-based view of the firm. Journal of Management 47 (7):1820–40. doi:10.1177/01492063211000422.
- Dallimore, P., C. C. A. Chan, and P. Dallimore. 2010. Perceptions of human capital measures: From corporate executives and investors. Journal of Business and Psychology 25 (4):673–88. doi:10.1007/s10869-009-9150-0.
- Dangi, D., A. Bhagat, and D. K. Dixit. 2021. Sentiment analysis of social media data based on chaotic coyote optimization algorithm based time weight-ad boost support vector machine approach. Concurrency and Computation: Practice and Experience e6581. doi:10.1002/cpe.6581.
- Durana, P., N. Perkins, and K. Valaskova. 2021. Artificial intelligence data-driven internet of things systems, real-time advanced analytics, and cyber-physical production networks in sustainable smart manufacturing. Economics, Management, and Financial Markets 16 (1):20–30. doi:10.22381/emfm16120212.
- Friesenbichler, K. S., and A. Reinstaller 2021. “Do firms facing competitors from emerging markets behave differently? Evidence from Austrian manufacturing firms.” WIFO Working Papers. doi:10.1108/EBR-09-2020-0216
- Gardner, T. M. 2002. In the trenches at the talent wars: Competitive interaction for scarce human resources. Human Resource Management 41 (2):225–37. doi:10.1002/hrm.10033.
- Gardner, T. M. 2005. Interfirm competition for human resources: Evidence from the software industry. Academy of Management Journal 48 (2):237–56. doi:10.5465/amj.2005.16928398.
- Giroud, X., and H. M. Mueller. 2011. Corporate governance, product market competition and equity prices. The Journal of Finance 66 (2):563–600. doi:10.1111/j.1540-6261.2010.01642.x.
- Grant, R. M. 1996. Prospering in dynamically-competitive environments: Organizational capability as knowledge integration. Organization Science 7 (4):375–87. doi:10.1287/orsc.7.4.375.
- Hoberg, G., and G. Phillips. 2010. Product market synergies and competition in mergers and acquisitions: A text-based analysis. The Review of Financial Studies 23 (10):3773–811. doi:10.1093/rfs/hhq053.
- Hogenboom, A., B. Heerschop, F. Frasincar, U. Kaymak, and F. D. Jong. 2014. Multi-lingual support for lexicon-based sentiment analysis guided by semantics. Decision Support Systems 62:43–53. doi:10.1016/j.dss.2014.03.004.
- Hom, P. W., T. W. Lee, J. D. Shaw, and J. P. Hausknecht. 2017. One hundred years of employee turnover theory and research. Journal of Applied Psychology 102 (3):530–45. doi:10.1037/apl0000103.
- Hou, K., and D. T. Robinson. 2006. Industry concentration and average stock returns. Journal of Finance 61 (4):1927–56. doi:10.1111/j.1540-6261.2006.00893.x.
- Hun, K., D. C. Mauer, and E. Qianying. 2018. Human capital relatedness and mergers and acquisitions R. Journal of Financial Economics 129 (1):111–35. doi:10.1016/j.jfineco.2018.03.008.
- Java, A., X. Song, T. Finin, and B. Tseng 2007. Why we twitter: Understanding microblogging usage and communities. In Proceedings of the 9th WebKDD and 1st SNA-KDD 2007 workshop on Web mining and social network analysis, August 12, 2007 San Jose, California , USA (pp. 56–65). doi: 10.1007/978-3-642-00528-2_7
- Kliestik, T., E. Nica, H. Musa, M. Poliak, and E. A. Mihai. 2020. Networked, smart, and responsive devices in industry 4.0 manufacturing systems. Economics, Management, and Financial Markets 15 (3):23–29. doi:10.22381/EMFM15320203.
- Kovacova, M., and E. Lewis. 2021. Smart factory performance, cognitive automation, and industrial big data analytics in sustainable manufacturing internet of things. Journal of Self-Governance and Management Economics 9 (3):9–21. doi:10.22381/jsme9320211.
- Lazaroiu, G., T. Kliestik, and A. Novak. 2021. Internet of things smart devices, industrial artificial intelligence, and real-time sensor networks in sustainable cyber-physical production systems. Journal of Self-Governance and Management Economics 9 (1):20–30. doi:10.22381/jsme9120212.
- Lee, K. H., D. C. Mauer, and Q. E. Xu. 2018. Human capital relatedness and mergers and acquisitions. Social Science Electronic Publishing 129 (1):111–35. doi:10.1016/j.jfineco.2018.03.008.
- Leping, K. 2009. Measuring the specificity of human capital: A skill-based approach. Baltic Journal of Economics 9 (1):39–54. doi:10.1080/1406099X.2009.10840452.
- Li, F., R. Lundholm, and M. Minnis. 2013. A Measure of competition based on 10-K filings. Journal of Accounting Research 51 (2):399–436. doi:10.1111/j.1475-679X.2012.00472.x.
- Liu, Y., J. Bi, and Z. Fan. 2017. A method for multi-class sentiment classification based on an improved one-vs-one (OVO) strategy and the support vector machine (SVM) algorithm. Information Sciences 394-395:38–52. doi:10.1016/j.ins.2017.02.016.
- Liu, Y., G. Pant, and O. R. L. Sheng. 2020. Predicting labor market competition: Leveraging interfirm network and employee skills. Information Systems Research 31 (4):1443–66. doi:10.1287/isre.2020.0954.
- Luo, Y., J. He, Y. Mou, J. Wang, and T. Liu. 2021. Exploring China’s 5a global geoparks through online tourism reviews: A mining model based on machine learning approach. Tourism Management Perspectives 37:100769. doi:10.1016/j.tmp.2020.100769.
- Markman, G. D., P. T. Gianiodis, and A. K. Buchholtz. 2009. Factor-market rivalry. Academy of Management Review 34 (3):423–41. doi:10.5465/AMR.2009.40632072.
- Mohammadi, A., and A. Shaverizade. 2021. Ensemble deep learning for aspect-based sentiment analysis. International Journal of Nonlinear Analysis and Applications 12:29–38. doi:10.22075/IJNAA.2021.4769.
- Mora, J. G., A. García-Aracil, and L. E. Vila. 2007. Job satisfaction among young European higher education graduates. Higher Education 53 (1):29–59. doi:10.1007/s10734-005-2377-4.
- N.a, I., S. Y.g, Y. Ruldeviyani, and A. Gandhi 2020. “What users want for gig economy platforms: Sentiment analysis approach,” 2020 6th International Conference on Science in Information Technology (ICSITech), OCT 21-22, 2020 Palu, INDONESIA, 68–73. doi:10.1109/ICSITech49800.2020.9392060
- Na, J. C., C. Khoo, and P. H. J. Wu. 2005. Use of negation phrases in automatic sentiment classification of product reviews. Library Collections Acquisitions, & Technical Services 29 (2):180–91. doi:10.1080/14649055.2005.10766050.
- Newbert, S. L. 2007. Empirical research on the resource-based view of the firm: An assessment and suggestions for future research. Strategic Management Journal 28 (2):121–46. doi:10.1002/smj.
- Nyberg, A. J., T. P. Moliterno, D. Hale, and D. P. Lepak. 2014. Resource-based perspectives on unit-level human capital: A review and integration. Journal of Management 40 (1):316–46. doi:10.1177/0149206312458703.
- Osmani, A., J. B. Mohasefi, and F. S. Gharehchopogh. 2020. Enriched latent dirichlet allocation for sentiment analysis. Expert Systems 37 (4):e12527. doi:10.1111/exsy.12527.
- Pant, G., and O. R. L. Sheng. 2015. Web footprints of firms: using online isomorphism for competitor identification. Information Systems Research 26 (1):188–209. doi:10.1287/isre.2014.0563.
- Rehman, M., A. Razzaq, I. A. Baig, J. Jabeen, M. H. N. Tahir, U. I. Ahmed, A. Altaf, and T. Abbas. 2021. Semantics analysis of agricultural experts’ opinions for crop productivity through machine learning. Applied Artificial Intelligence 1–16. doi:10.1080/08839514.2021.2012055.
- Santarelli, E., and H. Thu. 2013. The interplay of human and social capital in shaping entrepreneurial performance: The case of Vietnam. Small Business Economics 40 (2):435–58. doi:10.1007/s11187-012-9427-y.
- Sasso, S., and J. Ritzen. 2019. Sectoral cognitive skills, R&D, and productivity: A cross-country cross-sector analysis. Education Economics 27 (1):35–51. doi:10.1080/09645292.2018.1515309.
- Saura, J. R., D. Palacios-Marqués, and D. Ribeiro-Soriano. 2022a. “Exploring the boundaries of open innovation: Evidence from social media mining.” Technovation in press, 102447. doi:10.1016/j.technovation.2021.102447.
- Saura, J. R., D. Ribeiro-Soriano, and A. Iturricha-Fernández. 2022b. Exploring the challenges of remote work on Twitter users’ sentiments: From digital technology development to a post-pandemic era. Journal of Business Research 142 (March):242–54. doi:10.1016/j.jbusres.2021.12.052.
- Sharma, S. S., and G. Dutta. 2021. Sentidraw: Using star ratings of reviews to develop domain specific sentiment lexicon for polarity determination. Information Processing & Management 58 (1):102412. doi:10.1016/j.ipm.2020.102412.
- Shi, Z., G. M. Lee, and A. B. Whinston. 2016. Toward a better measure of business proximity: Topic modeling for industry intelligence. MIS Quarterly 40 (4):1035–56. doi:10.25300/MISQ/2016/40.4.11.
- Shyamasundar, L. B., and R. P. Jhansi. 2020. A multiple-layer machine learning architecture for improved accuracy in sentiment analysis. The Computer Journal 63 (3):95–409. doi:10.1093/comjnl/bxz038.
- Taboada, M., J. Brooke, K. Voll, K. Voll, and M. Stede. 2011. Lexicon-based methods for sentiment analysis. Computational Linguistics 37 (2):267–307. doi:10.1162/COLI_a_00049.
- Tijani, A. A., R. O. Osagie, and B. K. Afolabi. 2021. Effect of strategic alliance and partnership on the survival of MSMEs post COVID-19 pandemic. Ekonomicko-manazerske spektrum 15 (2):126–37. doi:10.26552/ems.2021.2.126-137.
- Valaskova, K., P. Ward, and L. Svabova. 2021. Deep learning-assisted smart process planning, cognitive automation, and industrial big data analytics in sustainable cyber-physical production systems. Journal of Self-Governance and Management Economics 9 (2):9–20. doi:10.22381/jsme9220211.
- Vo, A. D., Q. P. Nguyen, and C. Y. Ock. 2020. Semantic and syntactic analysis in learning representation based on a sentiment analysis model. Applied Intelligence 50 (3):663–80. doi:10.1007/s10489-019-01540-2.
- Yan, X., H. Xue, S. Jiang, and Z. Liu. 2021. Multimodal sentiment analysis using multi-tensor fusion net-work with cross-modal modeling. Applied Artificial Intelligence. doi:10.1080/08839514.2021.2000688.
- Yang, G. 2020. Do rural migrants benefit from labor market agglomeration economies? Evidence from Chinese cities. Growth and Change 51 (3):910–31. doi:10.1111/grow.12417.
- Yin, H., X. Wu, and S. X. Kong. 2020. Daily investor sentiment, order flow imbalance and stock liquidity: Evidence from the Chinese stock market. International Journal of Finance & Economics. doi:10.1002/ijfe.2402.
- Zhang, D., H. Xu, Z. Su, and Y. Xu. 2015. Chinese comments sentiment classification based on word2vec and SVMperf. Expert Systems with Applications 42 (4):1857–63. doi:10.1016/j.eswa.2014.09.011.
Appendix A
Because ours is a firm-level study, we compare basic firm-level statistics from our data with all China’s A-Share listed firms in the CSMAR Database. shows the number of firms in each industry according to Industry Code Classification (The Guidance for Industry Classification of Listed Companies released by China Securities Regulatory Commission in 2012). We observe that for most industries, the number of firms across different industries in our data is more than 50% of all China’s A-Share listed firms across different industries in CSMAR Database, which implies that our data includes firms across all major industry groups, and their distribution across industries is similar to all China’s A-Share listed firms included in CSMAR Database.
Table A1. The number of firms across different industries according to industry code classification.
Furthermore, we also test how our sample matches with all employees at different firms over time. We compute Kendall rank correlation between the sizes of firms (in the number of employees) based on our sample with the known sizes of the firms (obtained from CSMAR Database). shows the Kendall rank correlations over time, which are consistently significant at 1% level. The rank correlation values confirm that our data are a reasonable representation of firms in terms of their relative sizes.
Figure A1. Correlation between firm sizes from our sample and true firm sizes.
To understand the extent to which the employees of firms in our sample reflect the key business process or output of the corresponding firms, we randomly selected 20% of firms from each industry and crawled the basic summary of business activities of listed firms from Juchao Website (www.cninfo.com.cn), which is the first and largest financial professional website in China that provides information of listed firms. For each firm, we calculate the cosine similarities of its skill summary (input side) in 2019 with all firms’ business summary (output side), and then rank all firms based on computed cosine similarities from high to low. A high rank based on such similarity would mean that the employees in our sample represent the business of the firm well. We observe that all firms’ own skill and business summary similarity are ranked within the top 50%, indicating that the skills of the employees in our sample data are good representatives of the business activities of their respective firms.
Appendix B
The business scope of ZTE Corporation is as follows: 生产程控交换系统、多媒体通讯系统、通讯传输系统;研制、生产移动通信系统设备、卫星通讯、微波通讯设备、寻呼机、计算机软硬件、闭路电视、微波通信、信号自动控制、计算机信息处理、过程监控系统、防灾报警系统、新能源发电及应用系统等项目的技术设计、开发、咨询、服务;铁路、地下铁路、城市轨道交通、公路、厂矿、港口码头、机场的有线无线通信等项目的技术设计、开发、咨询、服务(不含限制项目);通信电源及配电系统的研发、生产、销售、技术服务、工程安装、维护;数据中心基础设施及配套产品(含供配电、空调制冷设备、冷通道、智能化管理系统等)的研发、生产、销售、技术服务、工程安装、维护;电子设备、微电子器件的购销(不含专营、专控、专卖商品);承包境外通讯及相关工程和境内国际招标工程,上述境外工程所需的设备、材料进出口、对外派遣实施上述境外工程的劳务人员;电子系统设备的技术开发和购销(不含限制项目及专营、专控、专卖商品);经营进出口业务(按贸发局核发的资格证书规定执行);电信工程专业承包(待取得资质证书后方可经营);自有房屋租赁。
The main business of ZTE Corporation is as follows: 信息产业、通讯及电子设备、计算机系统的硬件、软件等。
Figure B1. Perplexity plot for the number of topics based on all firms’ business scopes.

Figure B2. The top-10 business descriptions with the highest probabilities for each of the thirteen business scope topics based on all firms.
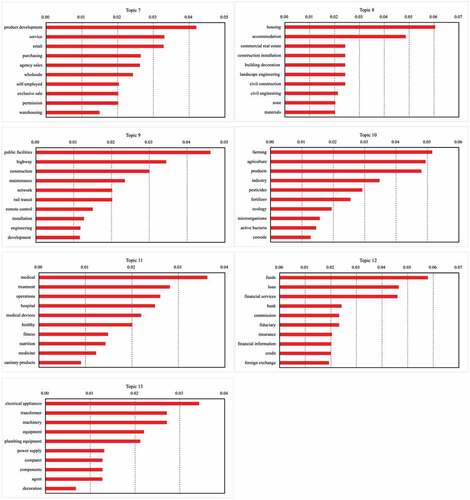
Figure B3. Perplexity plot for the number of topics based on all firms’ main businesses.
Figure B4. The top-10 business descriptions with the highest probabilities for each of the seven main business topics based on all firms.
Appendix C
Figure C1. Perplexity plot for the number of topics based on all employees.
Figure C2. The top-10 skill terms with the highest probabilities for each of the nine skill topics based on all employees.
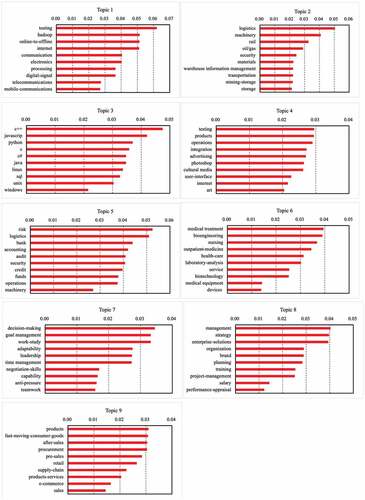
Figure C3. An HCF network based on a small subsample of data.
Notes, in the HCF network, two firms are connected by the direct employee mobility between them, the nodes of the network are firms, and the directed edges between firms are weighted by the number of employees who have moved from the source firm to the target firm up to a given year. The upstream firms of a focal firm are the firms from which employees have moved in the past to the focal firm. The downstream firms of a focal firm are the firms to which the focal firm’s employees have moved in the past. The HCF network records which firms have acquired knowledge from which other firms over time, which is hard to be measured through explicit skill terms.
Appendix D
Several reviews of listed firms are as follows:
来伊份在全网没有好评, 全是负面评价, 劝人不要去的,果然去了才明白, 大家诚不欺人啊。
大华股份,钱少事多, 考核加班,还没有弹性上班一律8点半, 真是后悔来这里.。
加班都挺严重的, 相对来说深信服最严重。
中兴通讯人力资源部因为同事更像是朋友, 上司也是正直善良的人, 感觉很幸运。
中兴有各种奖金哦。项目奖金。绩效奖金。还有QCC奖金。
东阿阿胶非常满意。偶尔加班, 工作压力适中, 对薪资待遇满意。推荐大家加入这家公司。