
 ?Mathematical formulae have been encoded as MathML and are displayed in this HTML version using MathJax in order to improve their display. Uncheck the box to turn MathJax off. This feature requires Javascript. Click on a formula to zoom.
ABSTRACT
Breast cancer is one of the most prominent sources of death in females. Every year many women suffer breast cancer, and, in the end, death occurs. The early detection of breast cancer may cause to reduce the death rate and save women’s lives. The medical care and cost of prevention of women’s breast cancer are costly and become a priority to diagnose breast cancer at its early stages. Initially, the mammography technique was the leading technique to detect the early stage of breast cancer. However, it cannot deal with a tumor size of less than 2 mm. To overcome this challenge, by considering the DMR-thermogram images, a novel layer-based Convolutional Neural Network (BreastCNN) for breast cancer detection and classification was proposed. BreastCNN method works in five different layers and uses different types of filters. The learning rate and structures of layers change after every convolution layer. The proposed technique is tested on the Database for Mastology Research (DMR) having 745 healthy and 261 sick images. The performance is calculated as the statistical values known as sensitivity, specificity, precision, accuracy, and F1-score. The proposed technique shows better accuracy of 99.7% as related to the already presented methods.
Introduction
Breast cancer (BC) is the most collective cause of females death in the whole world. The human body naturally consists of a solid defense system against any disease that occurs. It controls the body tissue’s growth, creation, and death as well with a certain ratio. When this control breaks, body tissues behave abnormally, and tissue creation is converted into the death of human body tissues. This condition is called cancer. The human body is made up of many cells in its tissues, when these cells start growing irregularly and spread their tissues without any control, this causes cancer in the breast. BC is a well-known virus that causes the disease of women. Concerning the World Health Organization (WHO) the expecting cases of BC after 2025 will be around 20 million (Mathers Citation2020). On the other hand, in many countries like the USA and Egypt around 50000 women are dying in a year. Moreover, as a ratio one in eight women will be affected with BC in her whole period of life (Dite et al. Citation2016). This ratio can be reduced by using early detection of methods, improving treatment options, and by awareness sessions among the women to avoid this disease.
Over the last few years, many techniques have been established to identify cancer in the breast, but the best publicly used technique to identify initial stage BC is mammography. The mammography method is the kind of X-ray method for premature phase detection of breast cancer and was considered the best value method for recognition of primary stage cancer and reducing the mortality rates. This method is used only to diagnose the small size of tumors for women having ages above 40. On the other hand, it is not useful for younger age women (Hamidinekoo et al. Citation2018). The most attractive and alternative mammogram method is magnetic resonance imaging (MRI) to confirm the existence of breast cancer. The use of the MRI method creates an allergic reaction to the skin of the patient at the injected place and causes claustrophobia (Ragab et al. Citation2019). Another method for detecting breast cancer was used in the 1980s is thermography. The technique used for detection purposes is known as the image. Thermography screening is the modern technique to find breast cancer. It concerns the heat of the body. In normal cases, the graph for thermal screening is symmetrical and in the abnormal condition, the thermal graph is not symmetrical for both the breast. It is a highly used, risk-free, less painful method for the identification of cancers in the breast (Prabha S, Sujatha C M, and Ramakrishnan S Citation2014).
Moreover, there are many other signs of breast cancer, like structural distortion but these are not significant. There are two types of early signs of disease: masses and micro-calcifications. The masses have two types of benign and malignant tumors. The benign tumor has oval or rounded shapes while on the other hand, the malignant tumor has a partially rounded shape and whiter outlines than the benign tumor (Bozek et al. Citation2009). Cancer is the worst type of BC that roots the activation of breast cancer cells. These cells’ growth is irregular and spreads in the human body and other humanoid body parts (Anon Citation2021). The BC hammers the women in the age group of 20–50. This pathetic increase in breast cancer disease causes an alarming situation for women’s survival (Christy and Priyadharshini Citation2018). Over the past five years, the percentage of BC patients’ survival is approximately 80–90 in the USA, whereas in other countries like India reported as 60–70 approximately. During the year 2020, the ratio of breast cancer patients in India increases by round about two million (Malvia et al. Citation2017).
Recently, many researchers proposed different techniques to diagnose breast cancer and classify the masses. At the start, the mammography technique was the leading technique to detect the early stage of breast cancer. However, it cannot deal with a tumor size of less than 2 mm. To overcome this challenge, by considering the DMR-thermogram images a stable layer-based Convolutional Neural Network (BreastCNN) for breast cancer detection and classification was proposed. The proposed method works in five different layers and uses different types of filters. The learning rate and structures of layers change after every convolution layer. The main purpose of the proposed method is to detect the initial phases of cancer in the breast and classify the breast cancer.
The remaining paper is organized into three sections. The most related work of the field is presented in section 2 as related work. The overall methodology is explained in section 3 as the methodology. The achieved results and discussion is described in section 4. The obtained outcomes are to be maximum precise in the form of precision when compared to the other existing techniques.
Related Work
Many machine learning techniques have been proposed in the previous few years, which are appropriate for the detection and classification of various complicated breast cancers disease (Li et al. Citation2018). To classify invasive and noninvasive cancer, the ConvoNet technique has been proposed. It also detects the severity of breast cancer (RibRibli et al. Citation2018). In addition, some researchers proposed neural network techniques and their different variants like deep learning and recurrent neural network. They also tried to detect breast cancer through some modern machine learning techniques (Charan, Khan, and Khurshid Citation2018).
The mammography method is the kind of X-ray method for primary phase recognition of cancer in the breast and was considered the best value method for detection of early-stage cancer and reduced mortality rates. This method is used only to diagnose the small size of tumors for women having ages above 40. On the other hand, it is not useful for young age females (Hamidinekoo et al. Citation2018).
In another technique, a local quinary pattern recognition technology has been for breast cancer density classification, which gives better results (Rampun et al. Citation2018). To overcome the mammography technique, a new method, known as near-infrared fluorescence, has been offered for the continuous observation of detection of cancer in the breast. In image processing, this technique takes continuous images of breast cancer which carry a lot of information to detect breast cancer (Li et al. Citation2017). As soon as the early breast cancer stage is detected, sooner its treatment consequently started.
In the beginning, many researchers found it difficult to detect early parameters of breast cancer like breast metabolic heat, depth, and diameter (Amri, Pulko, and Wilkinson Citation2016). Many researchers have shown the negative impact of the use of mammography over the last 10 years using for breast cancer treatment. A study shows around a 50% impact ratio for the mammogram method for successive use for women (Boogerd et al. Citation2017). Another technique thermography has been used for breast cancer detection (Kandlikar et al. Citation2017). The sentinel lymph node technique for women reduces the ratio of the spread of breast cancer (Namikawa, Sato, and Hanazaki Citation2015).
Identification of cancer in the breast a new approach combining thermography and mammography was proposed by Kennedy, Lee, and Seely (Citation2009). The findings of this technique revealed that thermogram-based recognition had a sensitivity of only 83%, mammography-based detection had a sensitivity of 90%, and combined thermogram and mammogram had a sensitivity of 95%. Block Variance was proposed by Sourav Pramanik and colleagues as a feature extraction approach. This approach is reliant on the texture in the immediate vicinity. Thermogram breast cancer detection was then employed. They combined a gradient descent training procedure and a feed-forward neural network in the classification stage. They tested their technique with 100 pictures from the DMR database, which is open to the public (40 malignant and 60 benign). An asymmetry analysis approach is used to analyze the suggested system. In comparison to previous research, the findings demonstrated that this system has a high level of accuracy for classification. However, a tiny dataset was used to reach this good result (Pramanik, Bhattacharjee, and Nasipuri Citation2016). More related work is explained in with results, methodology, and some limitations.
Table 1. State-of-the-art related work
Methodology
A detailed description of the proposed methodology is defined in this section for breast cancer analysis and classification. A detailed description is given below.
Architecture of BreastCNN Network
The proposed layer-based Convolutional Neural Network (BreastCNN) consists of five convolutional layer boxes with different parameters. The first, second, and fifth convo layers are the combination of three mini layers as convolutional, ReLU, and polling layers with different filter sizes, strides, and polling sizes. The remaining third and fourth convo layers consist of only convolutional, ReLU layers with different parametric functions as shown in . The proposed method is made up of multiple initial processes, including image improvement, segmentation, feature abstraction, classification, and classifier valuation as shown in .
Figure 1. BreastCNN Model architecture.
Figure 2. BreastCNN architecture description.
Figure 3. Workflow of initial pre-processing steps.
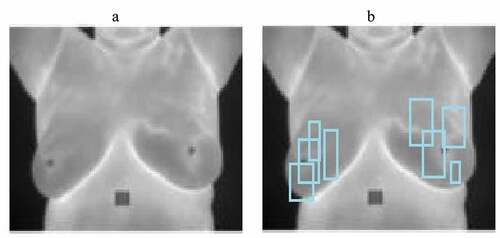
Image Improvement
Image improvement is the practice of increasing difference and suppressing noise in mammography images to find abnormal values. Adaptive contrast enhancement is one of the various image enhancing techniques that are employed. This method can boost the image’s native distinction and fetch further information. It is a fantastic piece. It can be used to improve the contrast of both natural and medical photographs, but it can also cause a lot of noise. To increase the distinction in images, contrast-limited adaptive histogram equalization (CLAHE) (Namikawa, Sato, and Hanazaki Citation2015), a form of adaptive histogram equalization (AHE), will be employed in this work. Because of the integration process, only the downsides of AHE may complete improvement of the noise in the images. As a result, the CLAHE is used because it customs a pin level to edge the native histogram and hence bounded the quantity of difference improvement for each pixel. The comparison of the original and enhanced image after CLAHE is used is shown in .
Figure 4. Comparison of original (A) & CLAHE resultant image (B).
Segmentation of Image
The segmentation of an image refers to the procedure of separating an image into segments with parallel traits and things. The basic goal of segmentation is to make the image easier to understand by giving it logically. Edge, fuzzy technique, partial differential equation (PDE), ANN, threshold, and regional segmentation are some of the most prominent segmentation approaches (Kennedy, Lee, and Seely Citation2009). The most basic approaches for image segmentation are threshold methods. The image pixels are arranged into groups depending on their level of intensity. The global threshold is the most prevalent form of thresholding approach. This is accomplished by establishing a suitable threshold value (tv). This (tv) value will remain constant throughout the image. The output picture X (a; b) can be produced from the initial image Y (a; b) using (tv), as shown in Equationequation 1(1)
(1) .
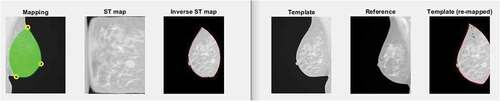
Other methods of segmentation are more complicated than region-based segmentation. Based on predefined parameters, it separates the image into different regions. (1) Region growth and (2) area division and merging are the two elementary methods of region-based segmentation (Pramanik, Bhattacharjee, and Nasipuri Citation2016). The region-growing algorithm can eliminate a section from an image constructed on predetermined measures, such as strength. A method of segmentation of image known as region growing examines neighboring pixels and joins them to a section class with no discernible edges. Because it includes the selection of an initial seed point, it is also characterized as a pixel-dependent picture segmentation approach. The area division and amalgamation approach is the arctic reverse of the area growing technique in that it applies to the complete image (Agarap Citation2018). The region of interest (ROI) is derived from the novel mammography picture using two different approaches in this publication. A deep convolutional neural network (DCNN) is the type of neural network that the first way is to use circular outlines to determine the ROI. The ROI is calculated using the inception and region-based procedures in the second method. For ROI extraction, the first step is to conclude the cancer region using an inception value, which is a value calculated about the green color pixels. After a few tests, the inception was established at 79 for all photos, irrespective of cancer size. The cancer was then clipped automatically based on the largest space within this inception along with the image. The image segmentation process for ROI is shown in .
Figure 5. Image segmentation mapping.
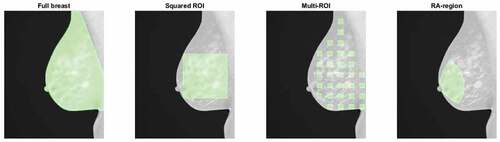
Figure 6. Image ROI mapping.
Feature Extraction
The feature extraction stage can be done in a variety of ways. The BreastCNN method has received a lot of interest in recent years due to its excellent performance. As a result, the BreastCNN is used in this paper. BreastCNN has been successful in image classification and image examination challenges. Several trainable steps are piled on top of each other in a CNN, which is then monitored by multiple supervised classification feature sets. The convo layer, pooling layer, and fully connected layer are the three core forms of layers used to develop CNN structures.
Feature Classification
According to the features, the ROI is classed as either healthy or unhealthy in this step. Linear discriminant analysis, ANN, binary decision trees, and SVM are just a few examples of classifier algorithms. As it produced the highest classification ratio in the breast cancer classification task, a five-layered CNN is used in this work. The first, second, and fifth convo layers are made up of three microlayers with variable filter sizes, strides, and polling sizes: convolutional, ReLU, and pooling layers. Only convolutional, ReLU layers with distinct parametric parameters make up the remaining third and fourth convo layers.
Classifier Evaluation
The confusion matrix, Accuracy, Sensitivity, Specificity, Precision, and F1 score are some of the evaluation methods that can be used to evaluate a classifier. The confusion matrix is a specialized tabular classification evaluation. It is commonly referred to as the error table in machine learning. Depending on the data type, an image section is positive or negative. A judgment for the observed result can also be accurate or erroneous. As a result, the choice will be between four options: true-positive, true-negative, false-positive, and false-negative. The diagonal of the confusion matrix is the correct decision. The accuracy of a classifier’s prediction is the measure of how accurate it is. It specifies the classifier’s overall performance capability. The accuracy is calculated by Equationequation 2(2)
(2) . explains the description of the proposed BreastCNN techniques.
Table 2. Description of BreastCNN layers
The receiver operating curve (ROC) examination is a renowned task detection calculation approach. A ROC analysis was first utilized in the medical field for the decision-making process. The ROC curve is a graph of operational points that depicts the true-positive rate as a function of the false-positive rate are also known as sensitivity (recall) and specificity. EquationEquations 3(3)
(3) and Equation4
(4)
(4) are used to define them.
The proportion of correctly predicted optimistic annotations to whole anticipated optimistic annotations is known as precision. Low FPR correlates with high precision. The following Equationequation 5(5)
(5) is used to calculate the precision.
The biased average of precision and recall is the F1-score. It is a statistical metric for evaluating the classifier’s performance. As a result, this score considers both false positives and false-negative. EquationEquation 6(6)
(6) defines the F1-score.
Results and Discussion
The proposed layer-based Convolutional Neural Network (BreastCNN) was applied to thermogram images, allowing each image to be classified into one of two groups: healthy or sick. The most frequently used DMR database for mastology research of thermal images was utilized in this study to test the proposed methods in MATLAB 2018a with Lenovo ThinkPad core i5, 2.8 GHz CPU, and 8GB RAM.
Dataset Pre-Processing
The DMR dataset is pre-processed by histogram equalizer and ROI techniques to decrease the amount of noise and anomalies in the dataset images as shown in . The Database for Mastology Research (DMR) is a publicly available online platform that stores and organizes hematologic images for breast cancer initial identification. Thermal and mammography images obtained by the research group are available in this collection. We used thermogram images for our research purpose. The thermogram images consist of two categories healthy and sick with sizes 640 × 480 pixels. Both the categories consist of a total of 1006 mages of which healthy is 745 and sick is 261 (Al-Hadidi, Alarabeyyat, and Alhanahnah Citation2016; Bazazeh and Shubair Citation2016). The dataset is distributed into train and test datasets. The ratio of the training dataset is 70% and for the test is 30%. The description of a dataset with distribution is given in .
Figure 7. Dataset ROI (C) and Histogram (D) representation.
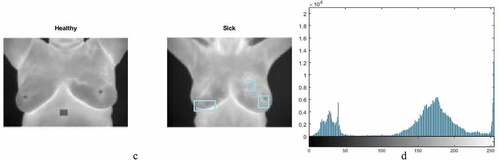
Table 3. DMR Dataset details and distribution
Evaluation Criterion
The experimental evaluation of the proposed model is calculated by using different statistical equations as described earlier in Equationequations 1(1)
(1) to 6. shows the testing and shows the training confusion matrix for the DMR dataset. The rows in the confusion matrix show the predictive class values and on the other hand, the column shows the true class value. The diagonal values explain the total observation that is correctly classified, and the off-diagonal shows the observation that is incorrectly classified. Every column consists of the overall quantity of observations and their percentages. The bottom right cell of the confusion matrix shows the overall accuracy. The calculation of the statistical values is shown in and . shows the average of testing dataset computed values as sensitivity: 98.32%, specificity: 99.0%, accuracy: 99.7%, precision: 99.05%, and F1-score: 96.25%. shows the average training dataset computed values as sensitivity: 97.15%, specificity: 98.6%, accuracy: 99.6%, precision: 98.59% and F1-score: 97.05%.
Figure 8. Two-class classification confusion matrix for DMR Test dataset.
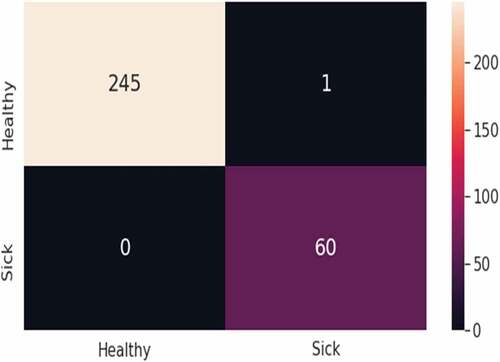
Figure 9. Two-class classification confusion matrix for DMR Training dataset.
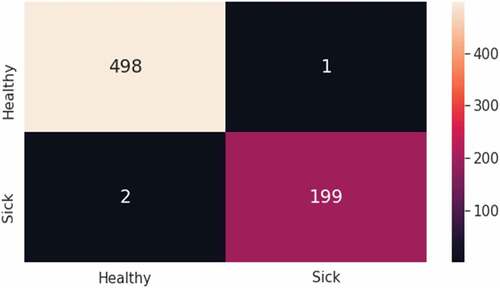
Table 4. Statistical calculated values for the DMR test dataset
Table 5. Statistical calculated values for DMR training dataset
show the testing and training accuracies and loss of the complete execution process. The test accuracy is 99.7% and the training accuracy is 99.6%. The flat line shows the training and testing, and the scattered line shows the validation of the dataset. shows the comparison of accuracy values with the already existing algorithms. The proposed technique for breast cancer classification and detection shows better results as accuracy: 99.7% because of the multi-layered structure and an optimum number of parameters and filters used that minimize the complexity to give the highest results. In (Ramya Devi and Anandhamala Citation2019) the Addaboost was used having a higher computational cost and resource utilization while BreastCNN involves less computational cost and resource utilization. On the other hand, in (Abo El-Soud and Eltoukhy Citation2020) EML method was applied with the single-layer structure of a neural network while the proposed method used multiple layer architecture for classification. In (AlFayez, El-Soud, and Gaber Citation2020) the MLP supports FANN architecture and has no looping structure while BreastCNN architecture support both FANN and backpropagation architecture with a looping structure.
Figure 10. Graphical representation of testing accuracy and loss over different iterations.
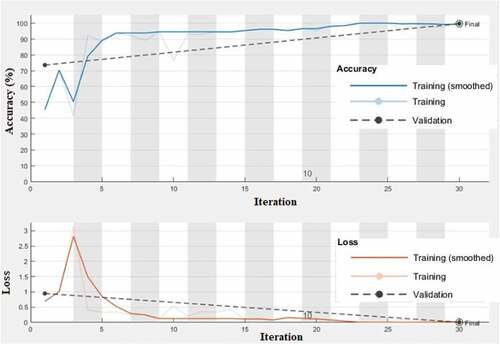
Figure 11. Graphical representation of training accuracy and loss over different iterations.
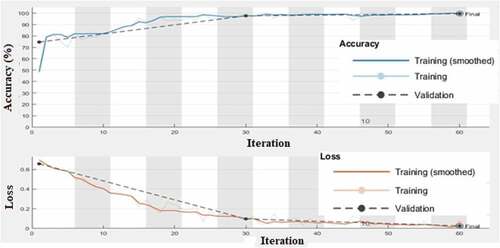
Table 6. Accuracy comparison of the proposed model with the state-of-the-art techniques
Discussions
The results of the proposed methodology are shown in which indicates the overall performance of the system. The comparison factor in results is done on a publically available DMR dataset. shows the average of testing dataset computed values as sensitivity: 98.32%, specificity: 99.0%, accuracy: 99.7%, precision: 99.05% and F1-score: 96.25%. shows the average training dataset computed values as sensitivity: 97.15%, specificity: 98.6%, accuracy: 99.6%, precision: 98.59% and F1-score: 97.05%. So the test accuracy is 99.7% and the training accuracy is 99.6%. The proposed technique for breast cancer classification and detection shows better results as accuracy: 99.7% because of the multi-layered structure and an optimum number of parameters and filters used that minimize the complexity to give the highest results. The results in indicate the comparison which shows that our proposed model is most significant in terms of accuracy measures for breast cancer detection and classification.
Conclusions
This paper proposed a machine learning method known as a novel layer-based Convolutional Neural Network (BreastCNN) for breast cancer detection and classification for DMR-thermogram images for detection and classification of cancer in women’s breast thermogram images. The publicly available DMR dataset is used for testing and training purposes. The proposed methodology for breast cancer detection and classification for the DMR-thermogram images model outperforms in the form of statistical values known as sensitivity, specificity, precision, accuracy, and F1-score. The measured accuracy of testing and training processes is 99.7% and 99.6%, respectively. The promising result of the proposed model indicates that it demonstrates better accuracy as related to the other existing algorithms but as a limitation, there is a need to create a proper application to use it in the medical field for simultaneous diagnosis of breast cancer. For future perspectives, more ensemble-based, and hybrid machine learning techniques can be utilized with the DMR database to get higher accuracy results with a proper application for medical experts.
Note On Contribute
Samar M. Alqhtani received her Ph.D. in Information Technology from the University of Newcastle, Australia. She is currently an Assistant Professor in Najran university, Saudi Arabia. Her research interest is in information technology and multimedia, including health informatics, machine learning, data mining, image processing, computer vision, and Internet-oriented IT applications.
Data Availability
The DMR dataset is publicly available at http://visual.ic.uff.br/dmi/ (accessed on 26 July 20)
Acknowledgments
The author is thankful to the Deanship of Scientific Research at Najran University for funding this work through grant research code (NU/-/SERC/10/517).
Disclosure Statement
No potential conflict of interest was reported by the author(s).
Additional information
Funding
References
- Abo El-Soud, M. W., M. M. Eltoukhy, and A. Farouk. 2020. Breast cancer detection in thermal images using extreme learning machine. Journal of Intelligent & Fuzzy Systems 38 (3):2673–899. doi:10.3233/jifs-179553.
- Agarap, A. F. M. 2018. On breast cancer detection: An application of machine learning algorithms on the wisconsin diagnostic dataset. In Proceedings of the 2nd International Conference on Machine Learning and Soft Computing - ICMLSC ’18. New York, New York, USA: ACM Press.
- Ak, M. F. 2020. A comparative analysis of breast cancer detection and diagnosis using data visualization and machine learning applications. Healthcare (Basel, Switzerland) 8 (2):111. doi:10.3390/healthcare8020111.
- Al-Hadidi, M. R., A. Alarabeyyat, and M. Alhanahnah. 2016. Breast cancer detection using K-nearest neighbor machine learning algorithm. In 2016 9th International Conference on Developments in ESystems Engineering (DeSE). IEEE, Liverpool, UK.
- Al-Rakhami, M. S., M. M. Islam, M. Z. Islam, A. Asraf, A. H. Sodhro, and W. Ding. 2020. Diagnosis of COVID-19 from X-rays using combined CNN-RNN architecture with transfer learning MedRxiv . doi:10.1101/2020.08.24.20181339.
- AlFayez, F., M. W. A. El-Soud, and T. Gaber. 2020. Thermogram breast cancer detection: A comparative study of two machine learning techniques. Applied Sciences (Basel, Switzerland) 10 (2):551. doi:10.3390/app10020551.
- Amri, A., S. H. Pulko, and A. J. Wilkinson. 2016. Potentialities of steady-state and transient thermography in breast tumour depth detection: A numerical study. Computer Methods and Programs in Biomedicine 123:68–80. doi:10.1016/j.cmpb.2015.09.014.
- Anon. 2021. Breast cancer in men - western new york urology associates, LLC. Wnyurology.Com. Accessed December 31. https://www.wnyurology.com/content.aspx?chunkiid=884502.
- Asraf, A., M. Z. Islam, M. R. Haque, and M. M. Islam. 2020. Deep learning applications to combat novel Coronavirus (COVID-19) pandemic. SN Computer Science 1 (6):363. doi:10.1007/s42979-020-00383-w.
- Bazazeh, D., and R. Shubair. 2016. Comparative study of machine learning algorithms for breast cancer detection and diagnosis. In 2016 5th International Conference on Electronic Devices, Systems and Applications (ICEDSA), 1–4. IEEE, Ras Al Khaimah, United Arab Emirates.
- Boogerd, L. S. F., H. J. M. Handgraaf, H.-D. Lam, V. A. L. Huurman, A. Farina-Sarasqueta, J. V. Frangioni, C. J. H. van de Velde, A. E. Braat, and A. L. Vahrmeijer. 2017. Laparoscopic detection and resection of occult liver tumors of multiple cancer types using Real-time near-infrared fluorescence guidance. Surgical Endoscopy 31 (2):952–61. doi:10.1007/s00464-016-5007-6.
- Bozek, J., M. Mustra, K. Delac, and M. Grgic. 2009. A survey of image processing algorithms in digital mammography. In Recent advances in multimedia signal processing and communications, edited by Janusz Kacprzyk, 631–57. Berlin, Heidelberg: Springer Berlin Heidelberg.
- Charan, S., M. J. Khan, and K. Khurshid. 2018. Breast cancer detection in mammograms using convolutional neural network. In 2018 International Conference on Computing, Mathematics and Engineering Technologies (ICoMET). IEEE, Sukkur, Pakistan.
- Chaurasia, V., and S. Pal. 2017. A novel approach for breast cancer detection using data mining techniques. International Journal of Innovative Research in Computer and Communication Engineering 2 (1):17. Available at SSRN https://ssrn.com/abstract=2994932.
- Christy, J., and L. Priyadharshini. 2018. Differential expression analysis of JAK/STAT pathway related genes in breast cancer. Meta Gene 16:122–29. doi:10.1016/j.mgene.2018.02.008.
- Dite, G. S., R. J. MacInnis, A. Bickerstaffe, J. G. Dowty, R. Allman, C. Apicella, R. L. Milne, H. Tsimiklis, K.-A. Phillips, G. G. Giles, et al. 2016. Breast cancer risk prediction using clinical models and 77 independent risk-associated SNPs for women aged under 50 years: Australian breast cancer family registry. Cancer Epidemiology, Biomarkers & Prevention: A Publication of the American Association for Cancer Research, Cosponsored by the American Society of Preventive Oncology 25 25 (2):359–65. doi:10.1158/1055-9965.EPI-15-0838.
- Ghasemzadeh, A., S. Sarbazi Azad, and E. Esmaeili. 2019. Breast cancer detection based on gabor-wavelet transform and machine learning methods. International Journal of Machine Learning and Cybernetics 10 (7):1603–12. doi:10.1007/s13042-018-0837-2.
- Hamidinekoo, A., E. Denton, A. Rampun, K. Honnor, and R. Zwiggelaar. 2018. Deep learning in Mammography and breast histology, an overview and future trends. Medical Image Analysis 47:45–67. doi:10.1016/j.media.2018.03.006.
- Islam, M. Z., M. M. Islam, and A. Asraf. 2020. A combined deep CNN-LSTM network for the detection of novel coronavirus (COVID-19) using X-ray images. Informatics in Medicine Unlocked 20 :100412. doi:10.1016/j.imu.2020.100412.
- Islam, M. M., F. Karray, R. Alhajj, and J. Zeng. 2021. A review on deep learning techniques for the diagnosis of novel Coronavirus (COVID-19). IEEE Access: Practical Innovations, Open Solutions 9:30551–72. doi:10.1109/ACCESS.2021.3058537.
- Kandlikar, S. G., I. Perez-Raya, P. A. Raghupathi, J.-L. Gonzalez-Hernandez, D. Dabydeen, L. Medeiros, and P. Phatak. 2017. Infrared imaging technology for breast cancer detection – current status, Protocols and new directions. International Journal of Heat and Mass Transfer 108:2303–20. doi:10.1016/j.ijheatmasstransfer.2017.01.086.
- Kennedy, D. A., T. Lee, and D. Seely. 2009. A comparative review of Thermography as a breast cancer screening technique. Integrative Cancer Therapies 8 (1):9–16. doi:10.1177/1534735408326171.
- Li, S., J. Johnson, A. Peck, and Q. Xie. 2017. Near infrared fluorescent imaging of brain tumor with IR780 dye incorporated phospholipid nanoparticles. Journal of Translational Medicine 15 (1):18. doi:10.1186/s12967-016-1115-2.
- Li, H., J. Weng, Y. Shi, W. Gu, Y. Mao, Y. Wang, W. Liu, and J. Zhang. 2018. An improved deep learning approach for detection of thyroid papillary cancer in ultrasound images. Scientific Reports 8 (1). doi: 10.1038/s41598-018-25005-7.
- Malvia, S., S. A. Bagadi, U. S. Dubey, and S. Saxena. 2017. Epidemiology of breast cancer in indian women: Breast cancer epidemiology. Asia-Pacific Journal of Clinical Oncology 13 (4):289–95. doi:10.1111/ajco.12661.
- Mathers, C. D. 2020. History of global burden of disease assessment at the world health organization. Archives Belges de Sante Publique [Archives of Public Health] 78 (1):77. doi:10.1186/s13690-020-00458-3.
- Mohammed, S. A., S. Darrab, S. A. Noaman, and G. Saake. 2020. Analysis of breast cancer detection using different machine learning techniques. In Data mining and big data, edited by Amin Mobasheri, 108–17. Singapore: Springer Singapore.
- Muhammad, L. J., M. M. Islam, S. S. Usman, and S. I. Ayon. 2020. Predictive data mining models for novel Coronavirus (COVID-19) infected patients’ recovery. SNComputer Science 1 (4):206. doi:10.1007/s42979-020-00216-w.
- Namikawa, T., T. Sato, and K. Hanazaki. 2015. Recent advances in near-infrared Fluorescence-guided imaging surgery using Indocyanine green. Surgery Today 45 (12):1467–74. doi:10.1007/s00595-015-1158-7.
- Osareh, A., and B. Shadgar. 2010. Machine learning techniques to diagnose breast cancer. In 2010 5th International Symposium on Health Informatics and Bioinformatics. IEEE, Ankara, Turkey.
- Prabha, S., C. M. Sujatha, and S. Ramakrishnan 2014. Asymmetry analysis of breast thermograms using BM3D technique and statistical texture features. In 2014 International Conference on Informatics, Electronics & Vision (ICIEV). IEEE, Dhaka, Bangladesh.
- Pramanik, S., D. Bhattacharjee, and M. Nasipuri. 2016. Texture analysis of breast thermogram for differentiation of malignant and benign breast. In 2016 International Conference on Advances in Computing, Communications and Informatics (ICACCI). IEEE, Jaipur, India.
- Prerita, N. S., A. Rana, and A. Chaudhary. 2021. Breast cancer detection using machine learning algorithms. In 2021 9th International Conference on Reliability, Infocom Technologies and Optimization (Trends and Future Directions) (ICRITO). IEEE, Noida, India.
- Ragab, D. A., M. Sharkas, S. Marshall, and J. Ren. 2019. Breast cancer detection using deep convolutional neural networks and support vector machines. PeerJ 7 (e6201):e6201. doi:10.7717/peerj.6201.
- Rahman, M. M., M. M. Islam, M. M. H. Manik, M. R. Islam, and M. S. Al-Rakhami. 2021. Machine learning approaches for tackling novel Coronavirus (COVID-19) pandemic. SN Computer Science 2 (5):384. doi:10.1007/s42979-021-00774-7.
- Rampun, A., B. Scotney, P. Morrow, H. Wang, and J. Winder. 2018. Breast density classification using local quinary patterns with various neighbourhood Topologies. Journal of Imaging 4 (1):14. doi:10.3390/jimaging4010014.
- Ramya Devi, R., and G. S. Anandhamala. 2019. Analysis of breast Thermograms using asymmetry in infra-mammary curves. Journal of Medical Systems 43 (6):146. doi:10.1007/s10916-019-1267-8.
- Ribli, D., A. Horváth, Z. Unger, P. Pollner, and I. Csabai. 2018. Detecting and classifying lesions in mammograms with deep learning. Scientific Reports 8 (1). doi: 10.1038/s41598-018-22437-z.
- Saha, P., M. S. Sadi, and M. M. Islam. 2021. EMCNet: Automated COVID-19 diagnosis from X-ray images using convolutional neural network and ensemble of machine learning classifiers. Informatics in Medicine Unlocked 22 (100505):100505. doi:10.1016/j.imu.2020.100505.
- Vaka, A. R., B. Soni, and S. Reddy. 2020. Breast cancer detection by leveraging machine learning. ICT Express 6 (4):320–24. doi:10.1016/j.icte.2020.04.009.