
ABSTRACT
The 311 phone number is for reporting non-emergency service requests (SRs) to authorities. This service is available through web, e-mail, and text message as well. Through this service, citizens would describe the issue and its location and the authorities would determine its category and the responsible unit and track the problem until it is resolved. The number of 311 SRs would amount to hundreds of thousands every year in some cities and determining the category of SRs manually is time-consuming, burdensome, and prone to human error. Additionally, these categories are not standardized across the states. In this paper, we standardize these categories across two cities and study the recurrent neural network’s ability in automatically determining the category of SRs based on the transcript of customer-provided descriptions. According to our results, the automatic categorization of these descriptions is not only faster and less cumbersome, but also more accurate than manual categorization. A close look at the mistakes made by the machine in labeling SRs revealed that in many cases either the SR’s description was insufficient to infer its category or the category identified by the machine was correct but the ground truth label assigned to that SR was incorrect.
Introduction
The 311 phone number operates similar to 911, but for reporting non-emergency service requests (SRs). Using this service, citizens can inform authorities of non-emergency issues in their community and make sure that they are aware of their existence. Examples of non-emergency issues are potholes, trees down, broken streetlights or traffic signals, and general cleaning problems. Some cities rely on 311 SRs for reports of homeless people who might need assistance. With phone calls as the only way of reporting non-emergency problems initially, e-mails, web forms, and mobile applications were later developed to allow citizens to request services through Internet (DeMeritt and Writer Citation2011).
The original purpose of this service was to alleviate the large volume of 911 calls, separate non-emergency calls from emergency ones, and make municipalities aware of infrastructure problems in the city. However, the storage and accumulation of SRs along with their location, time, and other descriptive attributes created a large and crowd-sourced database of non-emergency municipal problems. These data provide a live and evolving picture of citizens’ needs and city’s problems. This has triggered research in detecting, analyzing, and understanding patterns among SRs, some of which are reviewed in Section 2.
Although, the 311 system is a focus of many researchers from different disciplines, they focus less on providing an applicable tool for improved database management and service efficiency. This study’s contribution is to provide a practical tool for 311 service providers to improve their service operations by automatic categorization, which is time-consuming and cumbersome. A SR from a customer entails its location and customer-provided description and the agent has to determine its category. Considering that the number of SRs across the United States amounts to millions every year (Hashemi Citation2021a), manual labeling of these descriptions is cumbersome and prone to human error. Pamukcu, Zobel, and Ge (Citation2021) highlighted the role and significance of categorizing 311 SRs in the system and the challenges posed by lack of a standard method across different cities. This study proposes an automatic labeling of these descriptions and shows that natural language processing (NLP) along with deep learning (Hashemi and Hall Citation2020) can achieve over 83% generalization accuracy in doing so, given that the categories of SRs are standardized and there are enough manually labeled samples to train the machine. The dataset of two different 311 systems in the United States is used to validate the practicality of the proposed method.
Section 3 describes the data deployed in this work. Section 4 explains the standardization of SR categories and the machine learning model for automatically detecting these categories. Section 5 provides insight into our results and Section 6 concludes this study and provides some future research venues.
Related Work
Xu et al. (Citation2017) employed spatial-temporal kernel density estimation to forecast the daily number of sanitation SRs (e.g. garbage cart problems and general cleaning) in Chicago from 2011 to 2016. Wang et al. (Citation2017) showed that SR types across New York City (NYC), Boston, and Chicago from 2012 to 2015, project each census tract’s socioeconomic features (obtained from U.S. Census 2014 American Community Survey) and each zip code’s real estate prices (obtained from Zillow). Socioeconomic features in their study include racial decomposition, education, income, and employment. They clustered census tracts into four categories based on the relative frequency of different SR types in each census tract, using k-means clustering. They showed that each cluster has distinctive socioeconomic features. Thus, socioeconomic features in each census tract could be predicted based on its relative frequency of SR types. They also showed that the relative frequency of different SR types in each zip code could predict whether the average house price in that zip code will increase or decrease in the following year.
Kontokosta, Hong, and Korsberg (Citation2017) used a gradient boosting classifier to predict whether or not heat and hot water problems would happen in a residential building based on its physical conditions and property characteristics across NYC. With property value, building shape, building age, ownership, building management, and physical relationship with the adjacent building turning out to be the most significant input features, they reached a 75% classification accuracy. They then compared their model’s predictions with 311 SRs to identify residential buildings where over- or under-reporting to 311 occurs. They showed that under-reporting is concentrated in upper Manhattan, the lower east side of Manhattan, and the Bushwick area in Brooklyn and over-reporting in the Upper East Side and Upper West Side of Manhattan, Midtown Manhattan, and parts of Brooklyn. They associated under-reporting to neighborhoods with higher proportions of male residents, unmarried population, minority population, higher unemployment rate, and non-English speakers. This population appear to under-use 311. They associated over-reporting to neighborhoods with higher rents and incomes, higher proportions of female, elderly, non-Hispanic White, and Asian residents, and higher educational attainment.
Wheeler (Citation2018) found detritus- and infrastructure-related SRs to have a statistically significant positive effect, though negligible in magnitude, on serious crime, such as homicide and robbery, in Washington D.C. Based on this finding, they suggested that reducing physical disorder (measured by the number of 311 SRs in their study) is not viable as a crime control tactic.
Minkoff (Citation2016) showed that, in NYC from 2007 to 2012, census tracts with older houses, lower rates of minorities, higher rates of homeownership, children under 18, and income, request more government-provided services, related to streets, trees, sidewalks, garbage, water, lighting, etc. and less noise and graffiti related services. Because of their stake in the neighborhood, people in those areas are more invested in the community’s success, justifying their higher rate of SRs. Additionally, they showed that higher population growth is positively correlated with the volume of government-provided services and complaints about noise and graffiti.
O’Brien (Citation2016) showed that homeowners are three times more likely than renters to request 311 services in Boston. He also showed that most people request 311 services within two blocks of their home. White and Trump (Citation2018) showed that the volume of SRs from different areas in NYC has a negative relationship with voter turnout and a positive relationship with campaign donations. Clark, Brudney, and Jang (Citation2013) showed that the Hispanic population share has a significant negative relationship with the likelihood of using the 311 service in Boston. Lu and Johnson (Citation2016) showed that the 311 reporting channel is increasingly shifting from phone calls (80% in 2015) to Internet-based methods, i.e. mobile applications (8% in 2015), web forms (7% in 2015), and e-mails (5% in 2015) in Edmonton, Canada from 2013 to 2015. They showed that phone calls are more popular in large residential areas and among elderly and people without a diploma or college degree, while Internet-based methods are more popular in small industrial and institutional areas and among younger people with a diploma or college degree.
Although, the 311 system data have been the focus of research in pattern detection and knowledge extraction by researchers from different fields, they focus less on providing an applicable tool for improved database management and service efficiency. This study attempts to standardize the categories of non-emergency SRs and automate the process of assigning a category to SRs based on their customer-provided description, which is currently being done manually. Such categorization of SRs is not limited to the 311 service. Other government services, such as 911 also assign a category to each SR (e.g. fire, serious car incidents, fights, person with weapons, and break-ins), where our proposed method could be used for automation.
It is noteworthy that identifying categories based on citizen descriptions has similarities to labeling social media data. Automatic labeling of social media content is prevalent in the literature, such as automatic labeling and detection of topics related to oncology, Coronavirus, and political elections (Hashemi Citation2021a, Citation2021b, Citation2021c). Additionally, some 311 systems have integrated social media to collect SRs, for instance in San Francisco (Young Citation2021). This integration could result in significantly more requests, making the automation even more beneficial.
Data Description
We obtained 311 SR collections from the US City Open Data Census (USCODC). Not all cities provide the customer-provided transcript of SRs in their dataset, which is needed because we intend to predict the SR type based on the description transcript provided by the customer. Also, some cities have a very small dataset which is not sufficient for training a deep neural network. With this consideration, two cities were selected: Cincinnati and San Diego. We collected the data for the years that it was available, shown in . lists the number of SRs per city and year and the city’s population obtained from the US Census Bureau.
Table 1. Number of SRs and population per city and year
Methodology
Service Request Type Standardization
The names of SR types are not standardized across different cities. In other words, the same SR would be titled differently in two different cities. We need to standardize the names of SR types across cities. We used the description of each SR, metadata, and manuals describing the SR types for each city to understand and unify the names of SR types. We created 79 categories of standard SR types. We refer to these classes as minor standard types. We also categorized these 79 minor types into 12 major standard types. lists the 12 major SR types in the top row and the 79 minor SR types under their corresponding major type. SR types with a single instance, as well as unspecific SR types, such as “Other,” “Request for service,” or “General” are standardized under the title of “Other.”
Table 2. Standardized minor SR types under twelve major categories; the top row shows the major categories and the following rows show the minor types
shows the number of SR types in each city before and after they were standardized. As shown in this table, after standardization the number of SR types is reduced significantly, which makes it feasible for training a machine to automatically identify the major classes based on SR descriptions. shows the percentage of major SR types in each city. As shown in this figure, garbage and recycling is the most frequent category in Cincinnati, while streets/sidewalks is the most frequent category in San Diego.
Figure 1. Percentage of major SR categories in each city.
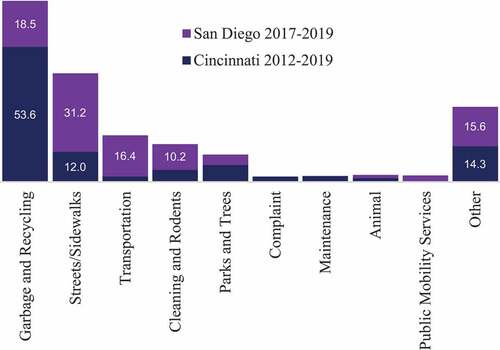
Table 3. Number of SR types before and after standardization in each city
Automatic Classification of SR Descriptions with LSTM RNN
Long short-term memory (LSTM) network (Hochreiter and Schmidhuber Citation1997) is a state-of-the-art recurrent neural network (RNN) architecture for sequence learning (Hashemi Citation2020; Hashemi and Hall Citation2020) that overcomes the RNN error back-flow problem. LSTM enforces constant error flow via truncating the gradient at special, self-connected units and uses multiplicative units that learn to gate access to the constant error flow and protect error flow from unwanted perturbations.
An LSTM network is composed of an input layer (shown with xt in ), one or more hidden layers (the area marked as memory cell in ), and a multi-layer perceptron (MLP) with softmax output layer. The number of neurons in the input layer is equal to the number of features. Since we consider words as tokens, the number of features would be the size of the embedding vector for each word. The length of the embedding vector is set to 256. Creating an embedding vector requires that the input data be integer encoded, so that each word is represented by a unique integer. Encoding words into unique integers is performed using tokenization. Tokenization is the process of transforming a stream of characters into a stream of processing units called tokens, e.g. words (Jurafsky and Martin Citation2014). A one-dimensional spatial dropout rate of 10% is considered for the input layer. In regular dropout, individual elements are dropped out, but in spatial drop out, the entire embedding vector for a word is dropped out. This is equivalent to randomly removing 10% of the words from each document.
Figure 2. LSTM memory cell architecture.
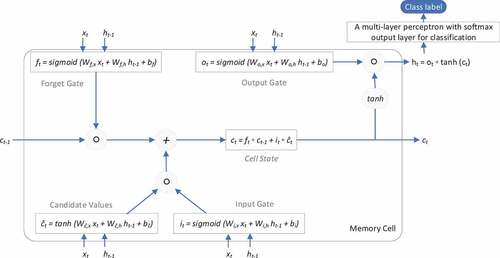
The hidden layer, also referred to as memory cell, produces a hidden state (shown with ht in ) at every time step. The number of memory cells are optimized using cross-validation in our network, where each cell has 256 neurons. A 20% dropout rate is considered for the linear transformation of the inputs. A 20% recurrent dropout rate is considered for the linear transformation of the recurrent state.
The output layer receives the hidden state generated by the memory cell (shown with ht in ) and produces a class label. In our network, this MLP has only one dense layer with 256 neurons, a 20% dropout rate, and an ReLU activation function. There are as many units in the output layer of this MLP as there are classes. Each class is locally represented by a binary target vector with one non-zero component.
Each memory cell consists of three gates whose values range from 0 to 1, acting as filters:
the forget gate (ft) specifies which information is erased from the cell state,
the input gate (it) controls which information is added to the cell state, and
the output gate (ot) decides which information from the cell state is passed to the hidden state (ht).
At every time step t, each of the three gates is presented with the input vector (xt which is equivalent to a word) at time step t as well as the output vector of the memory cells at the previous time step (ht-1). The equations in describe the update of the memory cells at every time step t. In these equations, Wf,x,Wf,h,Wĉ,x,Wĉ,h,Wi,x,Wi,h,Wo,x, and Wo,h are weight matrixes, for instance Wf,x is the weight matrix from the input vector to the forget gate, bf,bĉ,bi, and bo are bias vectors, ft,it, and ot are vectors for the activation values of respective gates, ĉt and ĉt are vectors for the cell states and candidate values thereof, ◦ denotes the element-wise product, and tanh refers to the element-wise hyperbolic tangent function.
Since we have a classification problem, we use the categorical cross-entropy as objective (cost) function and Adam optimization algorithm (Kingma and Ba Citation2014) with hyperparameters selected trough cross-validation. We set the batch size to 512 and make use of early stopping to dynamically derive the number of training epochs and to further reduce the risk of overfitting. In this approach, the training stops when the validation accuracy does not improve over a certain number of (5 in our experiments) consecutive epochs.
Results and Discussion
The network is trained and tested for each city separately, and also for combination of both cities. A ten-fold cross validation on 100,000 samples was used to optimize the number of memory cells in the network, which resulted in one memory cell. Then the machine was trained on all 100,000 training samples and tested on an unseen set of 100,000 samples. The generalization accuracies in are from the 100,000 test samples that have not been used for training.
Table 4. The vocabulary size of SR descriptions, the maximum length of SR descriptions, and the training and test classification accuracy, in each city
According to , the classification accuracy for major classes is slightly higher than the classification accuracy of minor classes, which is justified by the much lower number of major classes than minor classes. Additionally, the accuracy of the classifier that is trained across both cities closely resembles the accuracy of the classifiers that are trained for individual cities. This indicates the transferability of the proposed model across cities, via pretraining. It is also noteworthy that the responsible municipal agency/department for each SR is usually determined by the minor classes assigned to SRs. Therefore, this automatic categorization of SRs would also determine the responsible agency.
An investigation of the misclassified SR descriptions showed that mistakes by the machine mostly happen due to three reasons: (A) inaccurate labeling of the SR in the original file, (B) insufficient description for the SR, and (C) border cases. In the first case, the machine predicts the class correctly but it does not match the ground truth class. The reason is that the class that is listed for that SR is inaccurate and does not match the description. In the second case, the SR description does not seem to sufficiently describe a SR. In the last case, a SR description belongs to one class but also has attributes of another class. Therefore, the machine assigns a high likelihood to both classes but a higher likelihood to the wrong class. shows misclassified SR descriptions from different cities and the reason for their misclassification by the machine.
Table 5. Misclassified SR descriptions from different cities and the reason for their misclassification by the machine
The proposed automatic labeling of SRs has multiple advantages: it saves time and effort that would be required for manual labeling and it is more accurate than manual labeling as the majority of mistakes made by the machine were due to reasons A and B above. The automatic labeling would help to standardize the non-emergency SR types across the states. The downside is when the machine makes a mistake of type C (described above), where the machine is to blame for the misclassification. However, this type of mistake was the rarest type and we observed that it becomes even rarer when more SRs are used to train the machine. Additionally, type C mistakes happen mostly when the machine is less certain about its prediction. In other words, after looking at a service description, machine assigns a likelihood to each category and attributes the service request description to the category with the highest likelihood. In most type C mistakes, the likelihood assigned to the winning category is not much different than the likelihood assigned to the second class. Such cases are referred to as less certain predictions, which can be flagged for further investigation by an agent. This might help to alleviate type C mistakes.
Another important observation of misclassified cases was that the vast majority of mistakes happen when the ground truth class is Other but the predicted class is not. In other words, the machine tends to misclassify SRs of the type Other. This includes 37% of all mistakes for Cincinnati, 39% for San Diego, and 42% when cities are combined. In most of these cases, the predicted class by the machine is more specific and correct than the ground truth class, which is Other (this would fall under the mistake category A described above) and its examples are provided in . The second main type of mistake happens when the predicted class is Other but the ground truth class is not. This includes 13% of all mistakes for Cincinnati, 37% for San Diego, and 18% when cities are combined. In most of these cases, either the actual label does not match the description (mistake type A) or the description is not sufficient to infer the actual label (mistake type B). Examples of this mistake are provided in , as well.
Conclusions and Future Directions
Although, 311 systems are well-established and integrate many technologies into their system, their operations can be improved with the automation of some functionalities. This study tackles a very important and practical problem of government service systems and call centers in general. It presents a deep learning algorithm to automatically standardize 311 non-emergency service request categories, which is currently being done manually by call center operators. Experimenting with the proposed model resulted in a misclassification rate of 23% in Cincinnati, 17% in San Diego, and 21% when cities are combined. In Cincinnati, 50% of misclassified cases had “Other” as either their ground truth or predicted class. This percentage was 75% in San Diego and 60% when cities were combined. The majority of mistakes were not the machine’s fault, but due to either the inaccurate labeling or insufficient description of the SR.
As proposed in this study, automatic identification of the category of non-emergency service requests (SRs) based on the description transcript provided by citizens, not only would reduce the required manual effort and human error and expedite their processing, but also would help to standardize the categorization of 311 SRs across the states. The downside is when the machine is to blame for the misclassification. Such cases happen mostly when the machine is less certain about its prediction, i.e. the winning class’s likelihood is not much different than the second class. Such cases could be flagged for further investigation by an agent. Another limitation of the proposed automatic categorization would rise, if a customer describes more than one services in one call (this is not a concern in the current dataset). In such cases, the machine would assign the description to only one category, but most likely the prediction would be of low certainty because multiple categories will end up having close likelihoods. Such cases will be referred to an agent for further investigation as well. An alternative is to use multi-label classification methods, which would detect the presence or absence of each category independently of other categories. In other words, categories will not be competing with each other to win a description. However, multi-label classification could result in a large false positive rate, i.e. detecting categories that are not necessarily present in the description.
Another question is how the automatic categorization of SRs would perform during disasters, when some SR types increase significantly and new SR types emerge. For instance, social distancing violation and face mask covering violation emerged as new SR types in New York City during the COVID-19 pandemic (Pamukcu and Zobel Citation2021). When SRs surge under disastrous conditions, automation would reduce the need for personnel. However, as a natural limitation of classification methods, it would not be able to detect a category for which it has not been trained. Therefore, new emerging categories will not be identified as such. In our future work, we will add a new component to our method to continuously and automatically look for new emerging SR categories. We will apply anomaly detection, one class learning, and clustering methods to investigate how closely new SRs fit into the existing categories and if a large number of them fall too far from the existing categories and are forming their own new cluster. In such cases, the new cluster(s) could be presented to human experts for further investigation and potentially creating new categories.
Disclosure Statement
No potential conflict of interest was reported by the author(s).
Data Availability Statement
The data in this study is available at http://us-cities.survey.okfn.org/
References
- Clark, B. Y., J. L. Brudney, and S. G. Jang. 2013. Coproduction of government services and the new information technology: Investigating the distributional biases. Public Administration Review 73 (5):687–1335. doi:10.1111/puar.12092.
- DeMeritt, M., and E. Writer. 2011. Simplifying citizen reporting. ArcUser, Magazine for ESRI Software User 14 (1):26–27.
- Hashemi, M., and M. Hall. 2020. Multi-label classification and knowledge extraction from oncology-related content on online social networks. Artificial Intelligence Review 53 (8):5957–94. doi:10.1007/s10462-020-09839-0.
- Hashemi, M. 2020. Web page classification: A survey of perspectives, gaps, and future directions. Multimedia Tools and Applications 79 (17–18):11921–45. doi:10.1007/s11042-019-08373-8.
- Hashemi, M. 2021a. Studying and clustering cities based on their non-emergency service requests. Information 12 (8):332. doi:10.3390/info12080332.
- Hashemi, M. 2021b. Discovering social media topics and patterns in the Coronavirus and election era. Journal of Information, Communication and Ethics in Society 20 (1):1-17. doi:10.1108/JICES-04-2021-0039.
- Hashemi, M. 2021c. A data-driven framework for coding the intent and extent of political tweeting, disinformation, and extremism. Information 12 (4):148. doi:10.3390/info12040148.
- Hochreiter, S., and J. Schmidhuber. 1997. Long short-term memory. Neural Computation 9 (8):1735–80. doi:10.1162/neco.1997.9.8.1735.
- Jurafsky, D., and J. H. Martin. 2014. Speech and language processing. London: Pearson.
- Kingma, D. P., and J. Ba. 2014. Adam: A method for stochastic optimization. arXiv preprint arXiv 1412:6980.
- Kontokosta, C., B. Hong, and K. Korsberg. 2017. Equity in 311 reporting: Understanding socio-spatial differentials in the propensity to complain. arXiv arXiv 1710.02452. https://doi.org/10.48550/arXiv.1710.02452
- Lu, Q., and P. A. Johnson. 2016. Characterizing new channels of communication: A case study of municipal 311 requests in Edmonton, Canada. Urban Planning 1 (2):18–31. doi:10.17645/up.v1i2.621.
- Minkoff, S. L. 2016. NYC 311: A tract-level analysis of citizen–government contacting in New York City. Urban Affairs Review 52 (2):211–46. doi:10.1177/1078087415577796.
- O’Brien, D. T. 2016. 311 hotlines, territoriality, and the collaborative maintenance of the urban commons: Examining the intersection of a coproduction policy and evolved human behavior. Evolutionary Behavioral Sciences 10 (2):123. doi:10.1037/ebs0000063.
- Pamukcu, D., C. W. Zobel, and Y. G. Ge (2021). Analysis of Orange County, Florida 311 system service requests during the COVID-19 pandemic. 18th International Conference on Information Systems for Crisis Response and Management (ISCRAM), (pp. 208–17). Blacksburg, VA, USA.
- Pamukcu, D., and C. Zobel (2021). Characterizing 311 system reactions to a global health emergency. In Proceedings of the 54th International Conference on System Sciences, (pp. 2216–25). Hawaii, USA.
- Wang, L., C. Qian, P. Kats, C. Kontokosta, S. Sobolevsky, and Y. Chen. 2017. Structure of 311 service requests as a signature of urban location. PloS One 12 (10):e0186314. doi:10.1371/journal.pone.0186314.
- Wheeler, A. P. 2018. The effect of 311 calls for service on crime in DC at microplaces. Crime and Delinquency 64 (14):1882–903. doi:10.1177/0011128717714974.
- White, A., and K.-S. Trump. 2018. The promises and pitfalls of 311 data. Urban Affairs Review 54 (4):794–823. doi:10.1177/1078087416673202.
- Xu, L., M.-P. Kwan, S. McLafferty, and S. Wang. 2017. Predicting demand for 311 non-emergency municipal services: An adaptive space-time kernel approach. Applied Geography 89:133–41. doi:10.1016/j.apgeog.2017.10.012.
- Young, M. M. 2021. The impact of technological innovation on service delivery: Social media and smartphone integration in a 311 system. Public Management Review 1–25. doi:10.1177/0095399707311775.