
 ?Mathematical formulae have been encoded as MathML and are displayed in this HTML version using MathJax in order to improve their display. Uncheck the box to turn MathJax off. This feature requires Javascript. Click on a formula to zoom.
ABSTRACT
The probability of a single access point (AP) failure is very small. In addition, APs communicate with each other; therefore, it is considered that these failures have little impact on the wireless network. Only when a large number of APs are abnormal offline, do we consider that the wireless network is faulty and needs to be recovered immediately. Network breakdown, network congestion, and AP management software shutdown may cause numerous APs in aborted status. In this article, we utilize DBSCAN algorithm to detect abnormal Wi-Fi APs. Compared with other research works, our proposed unsupervised method can distinguish between normal and abnormal offline APs. This study proposes a new date dimension to calculate the number of online APs together with the time dimension, and it provides new insights to set up thresholds of online APs automatically. Experimental results show that this 3-D model based on date and time is more accurate than the traditional 2-D model only based on time. With regard to the sampling method of random forest, this paper carries out repetitive random sampling to form small sample sets and finally to obtain the mean feature plane, which can reduce the interference of abnormal points to our algorithm.
Introduction
Wi-Fi has a huge impact on the application of mobile computing, as people can access the wireless network anywhere, including airports, hotels, hospitals, schools, and centers for government affairs. Currently, there are two main methods for people to access the wireless network: through wireless access points (APs) or wireless routers. Compared with wireless routers, wireless APs have longer transmission distance, larger coverage area, stronger stability, and support more users. Therefore, wireless APs are generally used for wireless access in large public areas. With the widespread deployment of Wi-Fi APs, wireless networks have been perceived everywhere (Ducourthial, Mottelet, and Busson Citation2017). In the enterprises, a larger number of scattered APs are deployed in different hidden sites (Jia et al. Citation2020; Yang and Chen Citation2018); consequently, it is difficult to detect anomalous Wi-Fi APs by using the traditional manual method.
There are three major methods to detect an abnormal device: 1) Using SNMP protocol (Matousek, Rysavy, and Polcak Citation2021; Wang Citation2020), WMI protocol (Yeh, Lai, and Lin Citation2012), or other private API interfaces to communicate with the device. In this way, we can obtain the performance, alarm, and configuration information from the device, which supports these protocols, or API interfaces. 2) Using ping (Gezer and Warner Citation2019; Lima et al. Citation2019), or traceroute (Xie et al. Citation2020) to obtain the round-trip time (RTT) data (Hou et al. Citation2021; Mirkovic, Armitage, and Branch Citation2018) from the device. This method is used to detect whether the device is online. 3) Sending the syslog (Zhao et al. Citation2021b) or trap (Bretan Citation2017) messages to the network management system immediately when the device status is changed. These existing methods can detect the offline AP, but cannot distinguish between normal and abnormal offline APs. It is necessary to detect abnormal APs by a new intelligent method.
As numerous key businesses are running on servers, it is well known that the servers must be online at any time. It can lead to a great loss or even disastrous loss when the server breaks down accidentally. (Alqahtani et al. Citation2019; Jahani et al. Citation2020; Sharma et al. Citation2019). If a server is down, the business may be interrupted, and it must be recovered immediately. Because APs communicate with each other in the wireless network, we can connect another AP when one is abnormal offline. Only when a large number of APs are abnormal offline, do we consider that the wireless network is faulty and needs to be recovered. The reasons that numerous APs cannot be monitored are as follows: The AP management software (APMS) has broken down; the switch that an AP is connected to is faulty; numerous APs are shut down for online software update which leads to network congestion. In majority of the current publications, researchers focused on detection of a single abnormal AP. Different from these studies, we aim to detect abnormal interruptions caused by a large number of APs in a large-scale wireless network.
In this article, a 3-D coordinate system is established by time, date, and the number of online APs. A feature plane is drawn based on the number of online APs, which changes with date and time. The trend of the average number is displayed in the feature plane, though the threshold value could not be obtained. There are three steps for building the coordinating system. First, the feature plane function is obtained based on the Taylor expansion (Baric et al. Citation2021), and the parameters are calculated with the least square method (Romano and Wolf Citation2017) by multiple random sampling. The mean feature plane obtained is composed of the number of online APs based on date and time; the distances between sample points and the mean feature plane are produced at the same time. Second, these distances are divided into two groups: normal points and abnormal points. The normal points agree with the feature plane very well, and they can be sorted as a cluster. The abnormal points significantly deviate from the feature plane; therefore, abnormal points detection can be converted as a cluster problem. Finally, we use the Density-Based Spatial Clustering of Applications with Noise (DBSCAN) density cluster algorithm (Hahsler, Piekenbrock, and Doran Citation2019) to separate the abnormal points according to the distances. In addition, a new collection of data will be identified as abnormal points if they are far beyond the dynamic threshold, and a warning will be given simultaneously.
The major contributions of this article are summarized as follows:
(1) Compared with other research works, our proposed method can detect abnormal Wi-Fi access points by using DBSCAN algorithm.
(2) This article proposes a new date dimension to count the number of online APs together with the time dimension. To the best of our knowledge, our work is the first to utilize the date dimension to present the feature of online APs.
(3) This paper carries out repetitive random sampling to form small sample sets, and finally to obtain the mean feature plane. The method proposed in our article can reduce the interference of abnormal points and improve the generalization ability of the model.
The rest of this article is organized as follows: The related works are described in Section 2. We introduce the method of our model in Section 3. Section 4 describes the experimental results. Finally, the conclusion is presented in Section 5.
Related Works
In this article, we obtain the online status of each single AP, and then calculate the average number of online APs based on date and time. Finally, abnormal offline APs are detected by the DBSCAN algorithm.
Generally, there have been many studies that can detect a single abnormal network device by Syslog, RTT, Ping, SNMP. For example, some works used syslog messages to detect abnormal devices (Monteiro and Erbacher Citation2008; Vaarandi, Blumbergs, and Kont Citation2009; Zhang et al. Citation2020b; Zhao et al. Citation2021b). Round-trip time (RTT) can be used to measure whether the device is online or offline, and many studies on the measurement of RTT have been published. Kitisriworapan et al. used a simple walking strategy and round-trip time analysis to detect client-side rogue AP (Kitisriworapan, Jansang, and Phonphoem Citation2020). Hashem et al. implemented a Wi-Fi RTT-based indoor location determination system (Hashem, Harras, and Youssef Citation2021). Dong et al. predicted the RTT with a minimal gated unit based on recurrent neural networks (Dong, Du, and Yan, Citation2019). Garcia-Fernandez et al. proposed a method to estimate the Wi-Fi access point’s positions and hardware biases (Garcia-Fernandez et al. Citation2021). Luckie et al. detected that 2.71% and 0.76% of the links in the UDP and ICMP graphs were falsely inferred due to the presence of load-balancing (Luckie et al. Citation2011).
The probability of a single AP failure is very small, and this failure has little impact on the wireless network because APs communicate with each other. Therefore, reliability is an important metric to ensure network running, there are some research works for reliable wireless networks and service-level agreement of network. Reliability should come first before cost since no one wants a network that cannot work most of the time (Lyu et al. Citation2021). In order to ensure reliability, Kumar et al. proposed a reliable communication and deployment method in wireless sensor networks to monitor a remote environment (Boardman and Sullivan Citation2021; Kumar et al. Citation2020). Zhang et al. used the multi-path data transmission method to solve the problem of large data loss and transmission delay caused by collisions (Zhang et al. Citation2020a). Service-level agreement is another important evaluation index for continuity of service with sufficient resources (Shenoy, Gorinevsky, and Laptev Citation2019). Recently, a syntactical structure of SLA specification (Alqahtani et al. Citation2019) and semantic search engine platforms of cloud SLA (Saravanan and Radhakrishnan Citation2018) were proposed in the research works. In this article, we focus on detecting multiple anomalous APs that may lead to the breakdown of the wireless network. The wireless network must meet the continuity of service by SLA.
Network breakdown, network congestion, and AP management software shutdown may cause lots of aborted status of AP in the monitor system. We use the traditional detection method to detect each AP in the wireless network. The method proposed in this article can detect abnormal offline APs when the number of offline APs exceeds the threshold learned from the historical data. Taylor expansion is using a polynomial function to approximate a given function, and all nonlinear relations can be expanded by a Taylor formula. Taylor expansion is widely used in communication (Liu, Wu, and Ye Citation2018), IoT (Sun, Yang, and Zhi Citation2019), artificial intelligence (Guan et al. Citation2021), and electrical and electronic engineering (Zhao et al. Citation2021a), etc. We use Taylor expansion to express a feature plane based on the number of online APs, which changes with date and time. DBSCAN is a density-based spatial clustering algorithm, which divides regions with sufficient density into clusters. Compared with other clustering algorithms, such as k-means (Clark et al. Citation2021) and GMM (Chen and Cheng Citation2021), DBSCAN algorithm can find clustering clusters of arbitrary shapes. We use DBSCAN algorithm to detect anomalous APs from all of the offline APs in the study.
Methods
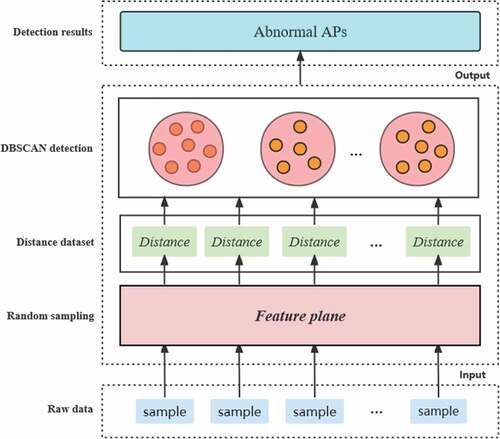
In this section, we describe the critical steps of the algorithm, as shown in . Firstly, we introduce the method of obtaining the feature plane in Section 3.1, and then computing the distance from sample point to feature plane in Section 3.2. In Section 3.3 we describe the method of detecting anomalous APs by using DBSCAN algorithm.
Figure 1. The framework of our model.
Obtain the Feature Plane
The number of normal devices is far more than abnormal devices in real application, so we can obtain a feature plane based on the probability distribution of the majority points. The feature plane is expressed as the following equation in a 3-D coordinate.
indicates the number of online APs at time t on day i. i is the ith day, j is time t on one day. We collect the data every 5 minutes, and there are totally 288 sampling points in a day.
Since the feature plane is an unknown non-linear plane, we write to a Taylor expansion.
In EquationEquation (2)(2)
(2) , k is the Taylor expansion series, that can be set in system running parameters, and
is written as:
Let:
Then can be expressed as:
Convert EquationEquation (4)(4)
(4) to a matrix expression..
(5)
Simplify Equation (5) to the following expression..
Feature plane reflects the common characteristics of all the normal sample points. Based on the probability distribution characteristic, the minimum sum of the bias between the sample data and the eigenvalue
can be found, so the loss function of the model is given:
Expand and simplify EquationEquation (7)(7)
(7)
Since
is a concave function with an upward opening, to find the minimum value of
, then
Compute the Distance from Sample Point to Feature Plane
The feature plane presents the predicted value of the amount of online AP at some time. The distance from sample point to feature plane presents the bias between current value and trend value. If the bias is too large, an abnormal wireless network should be considered. We compute the set of distances from the real value to the feature plane, and then plot these collections into a 3D-image.
Detect Anomalous APs by Using DBSCAN Algorithm
In the real environment, the running APs are online most of the time. So among all the distances between sample point which represents the number of online APs and the feature plane, the collection points representing the normal bias distance should be clustered together, and the density of them should be maximum. On the contrary, the density of outliers should be small. Therefore, we can use DBSCAN clustering algorithm based on density to separate normal points and abnormal points, as shown in .
Figure 2. The detection method of DBSCAN.
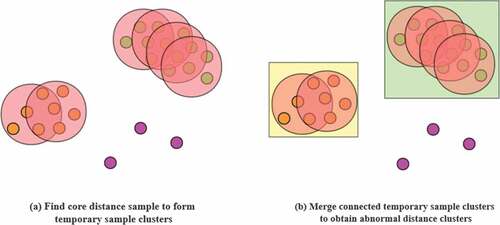
DBSCAN is a representative clustering algorithm based on density. Different from partition and hierarchical clustering, it defines the cluster as the maximum set of points connected by density, can divide the region with sufficient density into clusters, and can find arbitrary shape clustering in the spatial database of noise. We use DBSCAN clustering algorithm to classify abnormal points. Input the sample set ,
is the distance threshold of neighborhood, MinPts is the threshold of density, the algorithm is shown as Algorithm 1.
Table
Experimental Evaluation
In this section, we first describe the details of experiment dataset in Section 4.1 and Section 4.2, follow by the introduction of the result of abnormal detection in Section 4.3. We evaluate the stability of the method in Section 4.4. In the end, we compare the algorithm based on 3-D coordinate system with 2-D coordinate system in Section 4.5.
Experimental Setting
We collect the AP’s online status for about 13 weeks from the network data center of one enterprise, which supports all the customers throughout the country, and our goal is to give an early warning when lots of abnormal offline APs occur in a customer.
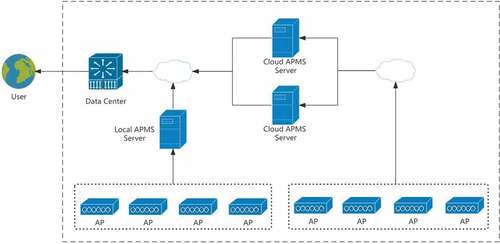
This enterprise serves 85 customers, and every customer has installed an APMS in the local server or cloud server, as shown in . In the local APMS server and cloud APMS server, we detect the TCP connection in real time in order to collect the information of online APs. We collect the number of online APs during a certain period of time and then calculate the tendency based on the date and time. APMS sample the value every one minute. After collecting raw online AP data, it is reported to the data center periodically. The data center and summarizes the number of online APs on the entire network at the sampling frequency of 5 minutes. So each AP has 288 sample points every day.
Figure 3. The deployment structure of APMS.
During data collection, a server halts for a short time or network break down will lead to the missed sample data of AP status. These incomplete data will inevitably affect the training of the model, so it is necessary to fill the missed data based on the history experience. There must be online APs in the whole network at every time. If collecting value is 0 or no data in a certain period, we conclude the collecting data is missed. We need to complete these data, and the completion value refers to the data collected recently on that day and the average value of the recent days within this period.
indicates the number of online APs at time t on day i.
indicates the filled data. m indicates the data in the last m days. m must be set in advance.
Experimental Steps
We need to train the samples to get the feature plane, and then screen abnormal points according to the distance between the samples and the feature plane. If there are abnormal points in the sample, the accuracy of the feature plane will be affected. Random sampling method (Breiman Citation2001; Iverson et al. Citation2008) can reduce the interference of abnormal points and improve the generalization ability of the model. Repetitive random sampling of the whole sample is carried out to form multiple sub-sample sets, and each sub-sample set can be calculated to obtain a feature plane. Finally, the mean value of the feature points at the same time is obtained. The detailed steps are as follows:
The data of the last n days are randomly selected at a ratio of 50%.
Solve the feature plane with the sample points according to the algorithm in this paper.
Repeat step 1 and step 2 m times to get m feature planes.
Take the average value of the m feature planes obtained in step 3 at each time, so as to obtain a mean feature plane.
Calculate the distance between each sample point and the feature plane, and classify these distance values by DBSCAN algorithm to distinguish the normal value and the abnormal value.
We screened out the set of abnormal points through clustering, eps was set to 15, and the threshold within the radius was set to 0.5 of the collecting days, as shown in .
Table 1. The parameters of the algorithm
Experimental Results
From the experimental results in , the number of online APs is small from 0:00 to 8:00 every day, the number of online APs reaches the peak from 8:00 to 17:00, and the number of online APs gradually decreases from 17:00 to 24:00. Since October 20, the number of online APs in has gradually increased due to the increase in the number of new APs.
Figure 4. The feature plane calculated from the sample data.
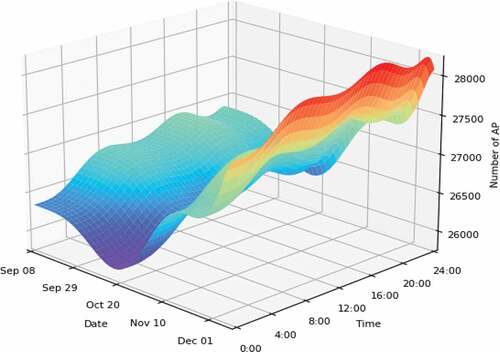
The reasons for the small number of online APs from 00:00 to 8:00 are as follows: 1) The branch management system upgrades from 00:00 to 4:00 in the morning. During the upgrade, APs are in offline state. 2) Lots of APs usually perform software upgrade from 00:00 to 08:00 and are halt in the update progress. 3) Many enterprises are powered off after 17:00 to save energy and reduce emissions, and APs are offline during this period.
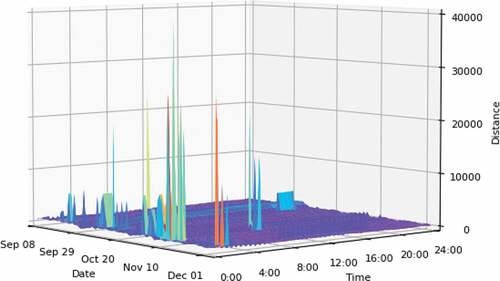
The distances between the sample points and the feature plane are expressed in a 3-D coordinate system, as shown in . Most of the normal points are in a relatively smooth plane, and those with spikes are abnormal points. When APs are offline normally, their values at the same time in the history of every day are also offline. Therefore, the distance between the sample points and the feature plane are very small, which is reflected as a smooth surface in 3-D coordinates. When a large number of APs are abnormally offline, the historical status values of these APs at the same time must be online, and the distances between the current collecting values and the feature plane must be large, which is represented as protruding burrs in the 3-D coordinate system. It can also be seen from that a large number of abnormal APs occur during 00:00 to 4:00 due to the upgrade of the management system or AP version.
Figure 5. The distance from sample to feature plane in 3-D coordinate system.
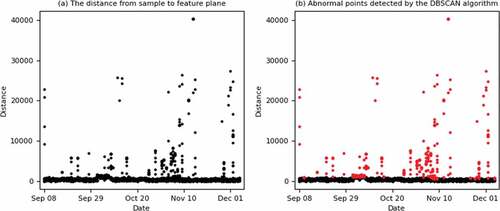
The distribution of distances with dates is shown in ), in which the x-axis is the date, and the y-axis is the distance from the sample point to the feature plane. These distances were classified by DBSCAN clustering algorithm to screen out normal distance and abnormal distance. The red points in ) are abnormal sample points. By comparing the historical values of abnormal sample points at the same time, we can locate the customer whose APs are offline abnormally and inform operation and management person to resolve the fault and recover wireless network in time.
Figure 6. The anomalous detection method based on the distance.
Algorithm Evaluation
Standard deviation is the arithmetic square root of variance, which reflects the degree of dispersion of a data set. Randomly sample m characteristic planes and take their mean to obtain the mean feature plane, represents a point on the mean feature plane at one time. Calculate m eigenvalues and
at each time to obtain the standard deviation, and the equation is as follow..
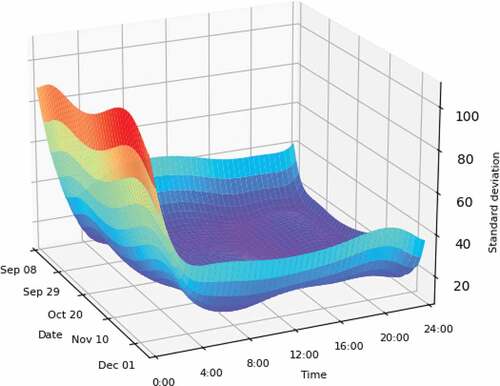
In this paper, 50 samples were taken to evaluate the stability of the model at different times according to standard deviation. As can be seen from , there are lots of abnormal offline APs during 00:00 to 4:00 every day, and the discrete degree of feature points is large, so wireless network faults are easy to occur. These abnormal points will inevitably affect the training of the model, so the stability of the model during this period is poor. From 4:00 to 24:00, the dispersion degree of feature points is small, the wireless network is relatively stable, and the stability of the model is relatively high.
Figure 7. Algorithm stability based on date and time.
Algorithm Comparison
This study proposed a new date dimension to statistic the number of online APs together with the time dimension. Compare the standard deviations of the 50 eigenvalues at each time between 3-D model based on date and time and 2-D model only base on time. As shown in , the standard deviation of the 3-D model is significantly lower than that of the 2-D model at every time, indicating that the integration degree of the feature points of the 3-D model is higher than that of the 2-D model and the algorithm based on 3-D model has better stability. At the same time, we can conclude that there is a correlation between the number of online APs and the date. For example, in the sample collected in this paper, as the number of APs maintained by enterprises increases, the 3-D model can better reflect the dynamic change of the number of online APs with the date.
Figure 8. The comparison of standard deviation between 2-D model and 3-D model.

There are 85 customers in our monitor system. We collect the AP’s online status with sampling frequency of 5 minutes during 89 days, so there are 25632 samples in the dataset. Two metrics are used to evaluate the accuracy of the model. When the wireless network status of one customer is abnormal, the model determines that there are abnormal APs in the monitor system, which is the evaluation metric 1. When the wireless network statuses of two or more customers are abnormal, the model determines that there are abnormal APs in the monitor system, which is the evaluation metric 2. We compared the accuracy of two models with two metrics, as shown in . The accuracy of 3-D model is able to reach as high as 84% with metric 1. The accuracy of 3-D model is able to reach as high as 97% with metric 2. The experimental results of 3-D models are better than 2-D model.
Table 2. The comparison of accuracy between 2-D model and 3-D model
Conclusion
Wi-Fi has had a huge impact on the application of mobile computing, when lots of the APs are abnormal offline, we concluded that the wireless network is faulty and need to recovery. In a majority of current papers, researchers have focused on anomalous detection of single AP. The probability of a single AP failure is very small. This failure has little impact on the wireless network because APs communicate with each other. This study, aimed to detect anomalous interruption caused by multiple APs in large-scale wireless network, which is different from other papers. This article presents an unsupervised learning algorithm for detecting multiple anomalous Wi-Fi access points to ensure the good running of wireless network. We proposed a new date dimension to statistic the number of online APs together with the time dimension, the fusion degree of feature points in 3-D model is higher than that in traditional 2-D model, and the model has better performance.
Disclosure statement
No potential conflict of interest was reported by the author(s).
Additional information
Funding
References
- Alqahtani, A., E. Solaiman, P. Patel, S. Dustdar, and R. Ranjan. 2019. Service level agreement specification for end-to-end IoT application ecosystems. Software-practice & Experience 49 (12):1689–693. doi:10.1002/spe.2747.
- Baric, J., L. Kvesic, J. Pecaric, and M. R. Penava. 2021. New bounds for generalized Taylor expansions. Mathematical Inequalities & Applications 24 (4):993–993. doi:10.7153/mia-2021-24-69.
- Boardman, N. T., and K. M. Sullivan. 2021. Time-based node deployment policies for reliable wireless sensor networks. IEEE Transactions on Reliability 70 (3):1204–17. doi:10.1109/TR.2020.3047757.
- Breiman, L. 2001. Random forests. 2001. Machine Learning 45 (1):5–32. doi:10.1023/A:1010933404324.
- Bretan, P. 2017. Trap analysis: An automated approach for deriving column height predictions in fault-bounded traps. Proceedings of 4th EAGE Conference on Fault and Top Seals, 59–69, Almeria, Spain. doi:10.1144/petgeo2016-022
- Chen, J. B., and S. L. Cheng. 2021. GMM estimation of a partially linear additive spatial error model. Mathematics 9 (6). doi: 10.1016/j.jnca.2017.03.001.
- Clark, A. Y., N. Blumenfeld, E. Lal, S. Darbari, S. Northwood, and A. Wadpey. 2021. Using K-means cluster analysis and decision trees to highlight significant factors leading to homelessness. Mathematics 9 (17). doi: 10.3390/math9172045.
- Dong, A., Z. J. Du, and Z. Y. Yan. 2019. Round trip time prediction using recurrent neural networks with minimal gated unit. IEEE Communications Letters 23 (4):584–87. doi:10.1109/LCOMM.2019.2899603.
- Ducourthial, B., S. Mottelet, and A. Busson. 2017. Improving fairness between close Wi-Fi access points. Journal of Network and Computer Applications 87:87–99. doi:10.1016/j.jnca.2017.03.001.
- Garcia-Fernandez, M., I. Hoyas-Ester, A. Lopez-Cruces, M. Siutkowska, and X. Banque-Casanovas. 2021. Accuracy in WiFi access point position estimation using round trip time. Sensors 21 (11):3828. doi:10.3390/s21113828.
- Gezer, A., and G. Warner. 2019. Exploitation of ICMP time exceeded packets for a large-scale router delay analysis. International Arab Journal of Information Technology 16 (6):1090–97.
- Guan, X., Y. Yang, J. J. Li, X. Xu, and H. T. Shen. 2021. Mind the remainder: taylor’s theorem view on recurrent neural networks. IEEE Transactions on Neural Networks and Learning Systems 33 (4): 1507–1519. doi:10.1109/TNNLS.2020.3042537.
- Hahsler, M., M. Piekenbrock, and D. Doran. 2019. dbscan: fast density-based clustering with R. Journal of Statistical Software 91 (1):1–30. doi:10.18637/jss.v091.i01.
- Hashem, O., K. A. Harras, and M. Youssef. 2021. Accurate indoor positioning using IEEE 802.11mc round trip time. Pervasive and Mobile Computing 75:101416. doi:10.1016/j.pmcj.2021.101416.
- Hou, B. N., C. S. Hou, T. Q. Zhou, Z. P. Cai, and F. Liu. 2021. Detection and characterization of network anomalies in large-scale RTT time series. IEEE Transactions on Network and Service Management 18 (1):793–806. doi:10.1109/TNSM.2021.3050495.
- Iverson, L. R., A. M. Prasad, S. N. Matthews, and M. Peters. 2008. Estimating potential habitat for 134 eastern US tree species under six climate scenarios. Forest Ecology and Management 254 (3):390–406. doi:10.1016/j.foreco.2007.07.023.
- Jahani, H., B. Abbasi, Z. Hosseinifard, M. Fadaki, and J. P. Minas. 2020. Disruption risk management in service-level agreements. International Journal of Production Research 59 (1):226–44. doi:10.1080/00207543.2020.1748248.
- Jia, M., S. B. Khattak, Q. Guo, X. M. Gu, and Y. Lin. 2020. Access point optimization for reliable indoor localization systems. IEEE Transactions on Reliability 69 (4):1424–36. doi:10.1109/TR.2019.2955748.
- Kitisriworapan, S., A. Jansang, and A. Phonphoem. 2020. Client-side rogue access-point detection using a simple walking strategy and round-trip time analysis. Eurasip Journal on Wireless Communications and Networking 1. doi:10.1186/s13638-020-01864-5.
- Kumar, S., S. Duttagupta, V. P. Rangan, and M. V. Ramesh. 2020. Reliable network connectivity in wireless sensor networks for remote monitoring of landslides. Wireless Networks 26 (3):2137–52. doi:10.1007/s11276-019-02059-7.
- Lima, F. H. M. S., L. F. M. Vieira, M. A. M. Vieira, A. B. Vieira, and M. Jose Augusto. 2019. Nacif. water ping: ICMP for the internet of underwater things. Computer Networks 152:54–63. doi:10.1016/j.comnet.2019.01.009.
- Liu, Z., B. Wu, and T. C. Ye. 2018. Improved turbo decoding with multivariable Taylor series expansion. IEEE Communications Letters 22 (1):37–40. doi:10.1109/LCOMM.2017.2705643.
- Luckie, M., A. Dhamdhere, K. C. Claffy, and D. Murrell. 2011. Measured impact of crooked traceroute. ACM Sigcomm Computer Communication Review 41 (1):15–21. doi:10.1145/1925861.1925864.
- Lyu, J. H., Y. R. Ren, Z. Abbas, and B. L. Zhang. 2021. Reliable route selection for wireless sensor networks with connection failure uncertainties. Sensors 21 (21):7254. doi:10.3390/s21217254.
- Matousek, P., O. Rysavy, and L. Polcak. 2021. Unified SNMP interface for iot monitoring. Proceedings of the IFIP/IEEE International Symposium on Integrated Network Management (IM), 938–43, Network.
- Mirkovic, D., G. Armitage, and P. Branch. 2018. A survey of round trip time prediction systems. IEEE Communications Surveys and Tutorials 20 (3):1758–76. doi:10.1109/COMST.2018.2816917.
- Monteiro, S. D. S., and R. F. Erbacher. 2008. Exemplifying attack identification and analysis in a novel forensically viable syslog model. Proceedings of the 3rd International Workshop on Systematic Approaches to Digital Forensic Engineering, 57–68, Berkeley, CA. doi:10.1109/SADFE.2008.14.
- Romano, J. P., and M. Wolf. 2017. Resurrecting weighted least squares. Journal of Econometrics 197 (1):1–19. doi:10.1016/j.jeconom.2016.10.003.
- Saravanan, K., and A. Radhakrishnan. 2018. Dynamic search engine platform for cloud service level agreements using semantic annotation. International Journal on Semantic Web and Information Systems 14 (3):70–98. doi:10.4018/IJSWIS.2018070104.
- Sharma, A., R. Kumar, M. W. Abu Talib, S. Srivastava, and R. Iqbal. 2019. Network modelling and computation of quickest path for service-level agreements using bi-objective optimization. International Journal of Distributed Sensor Networks 15 (10):155014771988111. doi:10.1177/1550147719881116.
- Shenoy, S., D. Gorinevsky, and N. Laptev. 2019. Probabilistic modeling of computing demand for service level agreement. IEEE Transactions on Services Computing 12 (6):987–93. doi:10.1109/TSC.2016.2637929.
- Sun, P., J. W. Yang, and Y. F. Zhi. 2019. Multi-attribute decision-making method based on Taylor expansion. International Journal of Distributed Sensor Networks 15 (3):155014771983607. doi:10.1177/1550147719836078.
- Vaarandi, R., B. Blumbergs, and M. Kont. 2009. An unsupervised framework for detecting anomalous messages from syslog log files. Proceedings of the 7th Annual Conference on Communication Networks and Services Research, 158–+, Moncton, Canada.
- Wang, H. 2020. Improvement and implementation of wireless network topology system based on SNMP protocol for router equipment. Computer Communications 51:10–18. doi:10.1016/j.comcom.2019.12.038.
- Xie, L. X., Y. Ding, H. Y. Yang, and Z. Hu. 2020. Mitigating LFA through segment rerouting in IoT environment with traceroute flow abnormality detection. Journal of Network and Computer Applications 164:102690. doi:10.1016/j.jnca.2020.102690.
- Yang, X. L., and B. Chen. 2018. A novel method for measurement points selection in access points localization. Wireless Networks 24 (1):257–70. doi:10.1007/s11276-016-1315-y.
- Yeh, M. H., Y. C. Lai, and J. W. Lin. 2012. An extendable web-based system of managing distributed servers using IPMI and WMI techniques. Pakistan Journal of Statistics 28 (5):551–64.
- Zhang, S. L., Y. Liu, W. B. Meng, J. H. Bu, S. Yang, Y. Q. Sun, et al. 2020b. Efficient and robust syslog parsing for network devices in datacenter networks. IEEE Access 8:30245–61. doi:10.1109/ACCESS.2020.2972691.
- Zhang, D. G., H. Wu, P. Z. Zhao, X. H. Liu, Y. Y. Cui, L. Chen, et al. 2020a. New approach of multi-path reliable transmission for marginal wireless sensor network. Wireless Networks 26 (2):1503–17. doi:10.1007/s11276-019-02216-y.
- Zhao, Z., T. Karvonen, R. Hostettler, and S. Sarkka. 2021a. Taylor moment expansion for continuous-discrete gaussian filtering. IEEE Transactions on Automatic Control 66 (9):4460–67. doi:10.1109/TAC.2020.3047367.
- Zhao, Z. F., W. N. Niu, X. S. Zhang, R. Z. Zhang, Z. Q. Yu, and C. Huang. 2021b. Trine: Syslog anomaly detection with three transformer encoders in one generative adversarial network. Applied Intelligence Advance online publication. doi:10.1007/s10489-021-02863-9.