
 ?Mathematical formulae have been encoded as MathML and are displayed in this HTML version using MathJax in order to improve their display. Uncheck the box to turn MathJax off. This feature requires Javascript. Click on a formula to zoom.
ABSTRACT
Solar activity has significant impacts on human activities and health. One most commonly used measure of solar activity is the sunspot number. This paper compares three important non-deep learning models, four popular deep learning models, and their five ensemble models in forecasting sunspot numbers. In particular, we propose an ensemble model called XGBoost-DL, which uses XGBoost as a two-level nonlinear ensemble method to combine the deep learning models. Our XGBoost-DL achieves the best forecasting performance (RMSE and MAE
) in the comparison, outperforming the best non-deep learning model SARIMA (RMSE
and MAE
), the best deep learning model Informer (RMSE
and MAE
) and the NASA’s forecast (RMSE
and MAE
). Our XGBoost-DL forecasts a peak sunspot number of 133.47 in May 2025 for Solar Cycle 25 and 164.62 in November 2035 for Solar Cycle 26, similar to but later than the NASA’s at 137.7 in October 2024 and 161.2 in December 2034. An open-source Python package of our XGBoost-DL for the sunspot number prediction is available at https://github.com/yd1008/ts_ensemble_sunspot.
Introduction
Human activities and various events on Earth are strongly intertwined with solar activity (Hathaway Citation2015; Pulkkinen Citation2007). An increase in solar activity includes increases in extreme ultraviolet and X-ray emissions from the Sun toward Earth, resulting in the atmospheric heating that can be harmful to spacecrafts, satellites and radars (Lybekk et al. Citation2012; Ruohoniemi and Greenwald Citation1997; Walterscheid Citation1989). Increased solar flares and coronal mass ejections due to high solar activity can damage the communication and power systems on Earth (Lewandowski Citation2015). The approximately 11-year cyclic pattern of solar activity seems easily predictable, but the cycle varies in both amplitude and duration (Cameron and Schüssler Citation2017). Accurate prediction of solar activity is thus of great interest to estimate the expected impact of space weather on space missions and societal technologies.
Solar cycles are also considered to impact many aspects of human health. Juckett and Rosenberg (Citation1993) observed longer human longevities during solar cycle minimums. Davis and Lowell (Citation2004) reported higher incidences of mental illness in chaotic solar cycles. Azcárate, Mendoza, and Levi (Citation2016) found larger fluctuations in blood pressure during ascending phases of solar cycles. Qu (Citation2016) concluded that most influenza pandemics occurred within one year of solar cycle peaks. Predictions of solar activity can hence assist people in taking the necessary precautions.
The number of the sunspots, which appear as dark areas on the solar disk, is the most commonly used measure of solar activity (Usoskin Citation2017). For one thing, the sunspot number is one directly visible characteristic of the Sun. For another, there is a publicly available record of sunspot numbers that can be traced back to as early as year 1749.
Prediction of sunspot numbers belongs to the scope of time-series forecasting that may be tackled by either non-deep learning or deep learning methods. Examples of popular non-deep learning methods in general time series forecasting are Auto-Regressive Moving Average (ARMA) models (Box and Jenkins Citation1976), Exponential Smoothing (Holt Citation1957; Winters Citation1960), and the Prophet model recently released by Facebook (Taylor and Letham Citation2018). Deep-learning time-series forecasting methods, mainly prevailing in natural language processing, include Long Short-Term Memory (LSTM; Hochreiter and Schmidhuber Citation1997), Gated Recurrent Unit (GRU; Cho et al. Citation2014; Chung et al. Citation2014), Transformer (Vaswani et al. Citation2017), and the recent Informer (Zhou et al. Citation2021). Non-deep learning methods often have restrictive theoretical assumptions that limit their performance on real-world time series data (Lara-Bentez, Carranza-Garca, and Riquelme Citation2021). Deep learning methods are generally superior over non-deep learning methods due to the capability of extracting complex data representations at high levels of abstraction (Han et al. Citation2019).
Although there have been many studies on predicting the sunspot number by using non-deep learning (Chattopadhyay, Jhajharia, and Chattopadhyay Citation2011; Hiremath Citation2008; Tabassum, Rabbani, and Tabassum Citation2020; Xu et al. Citation2008) or deep learning forecasting methods (Arfianti et al. Citation2021; Benson et al. Citation2020; Pala and Atici Citation2019; Prasad et al. Citation2022), most are based on ARMA models or deep learning methods like LSTM or GRU. Little work has been done on the more recent time-series models Prophet, Transformer, and Informer for the sunspot number prediction. Moreover, the ensemble learning methods (Kuncheva Citation2014) are rarely considered in this forecasting problem.
Ensemble learning is widely used in machine learning to boost the performance by combining results from multiple models. Since the ensemble result is often better than that of a single model, this technique has been increasingly applied to time series forecasting (Kaushik et al. Citation2020; Oliveira and Torgo Citation2015; Qiu et al. Citation2014; Wichard and Ogorzalek Citation2004). Basic ensemble methods simply use the average or median of predictions from all base models. More sophisticated methods assign different weights to base models, such as the error-based method and linear regression (Adhikari and Agrawal Citation2014).
Due to the regression nature of ensemble learning, any machine learning algorithm for regression can be used as an ensemble method. We thus propose to apply one state-of-the-art nonlinear method, Extreme Gradient Boosting (XGBoost; Chen and Guestrin Citation2016), to ensemble the predictions from multiple time-series forecasting models. XGBoost is a fast and accurate implementation of gradient boosted decision trees, which has recently been dominating applied machine learning for regression and classification tasks (Chang, Chang, and Chang Citation2018; Ogunleye and Wang Citation2019; Pan Citation2018; Zhong et al. Citation2018). The popularity of XGBoost mainly stems from its three modifications to traditional gradient boosted decision trees: the approximate greedy algorithm with weighted quantile sketch to fit large datasets, the sparsity-aware split finding algorithm to deal with missing values, and the cache-aware access technique to effectively utilize hardware resources. Besides these advantages, we essentially use XGBoost as a two-level ensemble method, because XGBoost itself is an ensemble of decision trees and each decision tree therein nonlinearly combines the forecasting models. The two-level nonlinear ensemble nature of our usage of XGBoost makes it potentially more powerful than single-level ensemble methods such as those aforementioned.
In this paper, we conduct a comparative study of non-deep learning and deep learning models as well as their ensemble models for the sunspot number prediction. We compare the three important non-deep learning models, Seasonal Auto-Regressive Integrated Moving Average (SARIMA; Box and Jenkins Citation1976), Exponential Smoothing, and Prophet, and the four popular deep learning models, LSTM, GRU, Transformer, and Informer. We also consider their ensemble models from basic ensembles, the error-based method, linear regression, and XGBoost.
The contributions of the paper are summarized below.
We compare three important non-deep learning models (SARIMA, Exponential Smoothing, and Prophet), four popular deep learning models (LSTM, GRU, Transformer, and Informer), and their five ensemble models (via mean, median, the error-based method, linear regression, and XGBoost) in predicting the sunspot number.
We propose to use XGBoost as a two-level nonlinear ensemble method to combine the results from time-series forecasting models. Our XGBoost-DL model, which uses XGBoost to ensemble the four deep learning models, has the best performance in comparison with other considered base and ensemble models as well as the prediction of the National Aeronautics and Space Administration (NASA).
We provide an open-source Python package of the XGBoost-DL model for the sunspot number prediction at https://github.com/yd1008/ts_ensemble_sunspot.
We use the proposed XGBoost-DL model to forecast the Solar Cycles 25 and 26, and compare the result with the NASA’s prediction.
The rest of this paper is organized as follows: Section 2 introduces the seven aforementioned time-series forecasting methods. Section 3 describes the five ensemble learning methods including the proposed XGBoost-based ensemble. Section 4 compares all considered base and ensemble models as well as NASA’s report for the sunspot number prediction. Section 5 makes concluding remarks.
Forecasting Methods
In this section, we introduce seven time-series forecasting methods that will be compared in our experiments for predicting sunspot numbers, including the three non-deep learning methods SARIMA, Exponential Smoothing, and Prophet, and the four deep learning methods LSTM, GRU, Transformer, and Informer. SARIMA and Exponential Smoothing are classical non-deep learning methods widely used for decades in forecasting seasonal time series (Box and Jenkins Citation1976; Holt Citation1957; Winters Citation1960). Facebook’s Prophet is relatively new compared to the former two but has been used internally in Facebook for years and also allows for seasonality (Taylor and Letham Citation2018). LSTM and its simpler variant GRU are two most popular deep-learning models based on gating mechanisms to tackle sequential prediction (Cho et al. Citation2014; Chung et al. Citation2014; Hochreiter and Schmidhuber Citation1997). Transformer is an innovative deep-learning network instead using a self-attention mechanism (Vaswani et al. Citation2017), and its variant Informer, the winner of AAAI-21 Outstanding Paper Award, improves Transformer on long-sequence time series forecasting (Zhou et al. Citation2021). We are aware of many other models (e.g., Beltagy, Peters, and Cohan Citation2020; Benson et al. Citation2020; Child et al. Citation2019; Tabassum, Rabbani, and Bin Omar Citation2020), most of which are similar to or variants of the above seven methods, but we only consider these seven methods that are most widely recognized in time series forecasting.
We denote a univariate time series by , where
is the observation at time
.
Non-deep Learning Methods
SARIMA
SARIMA (Box and Jenkins Citation1976), as an ARMA variant, is one most commonly used model in the past decades to forecast trend and seasonal time series. It uses a mix of autoregressive terms, moving average terms, and differencing procedures for both non-seasonal and seasonal components to represent the current value in a time series based on prior observations. Specifically, an SARIMA model is defined by
where and
are the parameters and the orders of the non-seasonal autoregressive, the non-seasonal moving average, the seasonal autoregressive, and the seasonal moving average terms, respectively,
is white noise,
is the lag operator,
is the order of non-seasonal differencing,
is the order of seasonal differencing,
is the span of the seasonality, and
is a constant.
Exponential Smoothing
Proposed in 1950s, Exponential Smoothing (Brown Citation1956; Holt Citation1957; Winters Citation1960) remains to be one of the widely used time series forecasting methods. Although there are several types of Exponential Smoothing, we focus on the Holt-Winters Exponential Smoothing method (Holt Citation1957; Winters Citation1960), which can model the trend and seasonality of a time series. The Holt-Winters method and SARIMA have shown comparable performances in a number of previous studies (Lidiema Citation2017; Liu et al. Citation2020; Rabbani et al. Citation2021).
Also known as Triple Exponential Smoothing, the Holt-Winters method comprises three smoothing equations for the level , the trend
, and the seasonality
, respectively. There are two main models of this method, the additive seasonal model
and the multiplicative seasonal model
where are smoothing parameters,
is the frequency of the seasonality, and
for
.
The two models differ in the nature of the seasonality. The additive model oughts to be considered when the seasonal variations are stable over time, while the multiplicative model is used when the seasonal variations are changing proportional to the level of the time series. Due to the variability of the amplitude of sunspot cycles, following Tabassum, Rabbani, and Bin Omar (Citation2020), we use the multiplicative model for the sunspot number prediction.
Prophet
Facebook’s Prophet (Taylor and Letham Citation2018) is a more recent time series forecasting algorithm compared to the previous two. Despite some commonalities with SARIMA and Exponential Smoothing, it provides a more intuitive approach to model the trend and seasonality of time series by incorporating more flexibilities in its configuration.
Prophet has three essential components: trend , seasonality
, and holiday
. The holiday option allows Prophet to adjust the forecast that may be affected by holidays or major events. The full model with a logistic trend term is
where is the error term,
is the carrying capacity that is the maximum value of the logistic curve,
is the growth rate that controls the steepness of the curve,
is an offset parameter corresponding to the curve’s midpoint, the seasonality
is expressed by a standard Fourier series with parameters
and a regular period
that the time series has,
is the set of dates for holidays, and
is the change in the forecast caused by holidays.
Deep Learning Methods
Although non-deep learning methods can handle a wide range of time series forecasting tasks, their theoretical limitations often prevent them from being directly applicable to data or modeling complex non-linearity in data, as well as computational complexity makes them impractical to large datasets. Therefore, deep learning techniques such as Rucurrent Neural Networks (RNNs) were introduced (Lara-Benítez, Carranza-García, and Riquelme Citation2021). RNNs have shown better performance than non-deep learning methods in time series forecasting due to the ability to deal with longer sequences and better capture complex temporal dependencies (Tsui et al. Citation1995; Zhang and Man Citation1998).
LSTM
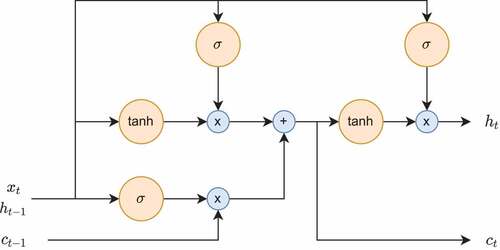
The LSTM network (Hochreiter and Schmidhuber Citation1997) is one most popular model in the RNN family. The vanilla RNN suffers from vanishing gradients and is not capable to achieve desirable results for long sequence data (Hochreiter Citation1998). The LSTM network mitigates this issue rising from long-term dependencies by introducing a gated memory cell architecture, which controlls the information flow with three gates: an input gate , an output gate
, and a forget gate
. The LSTM cell is formulated as follows:
where is the input which is the hidden state
from the previous layer and is
for the first hidden layer,
is the sigmoid function,
is the hyperbolic tangent function,
is the hidden state,
is the state of the memory cell,
is the candidate state of the memory cell, and
and
are the weights of the input and recurrent connections as well as
is bias with subscripts
,
,
and
for the input gate, forget gate, output gate, and memory cell, respectively.
In each hidden layer of the LSTM network, a sequence of LSTM cells are aligned side-by-side and input data are sequentially fed into each cell. LSTM’s capability of communicating across multiple cells comes from the hidden states and the cell states. The hidden state carries over information from the previous cell to the next and a new hidden state is generated from each LSTM cell, while the cell state selectively stores the past information. The input, output, and forget gates generate a new hidden state and update the cell state in the following procedure. The input gate determines whether new information will be added to the memory in two steps: uses a sigmoid function to decide which information needs to be updated, and
utilizes a hyperbolic tangent function to select new candidate information to be added to the memory. The forget gate decides what information should be discarded from the memory by applying a sigmoid function to the previous hidden state
and current input value
. The output of the forget gate ranges between 0 and 1, with 0 indicating complete removal of the previously learnt value and 1 indicating retention of all information. The output gate determines what will be generated as the output.
acts like a filter by selecting the relevant information from the memory with a sigmoid function to generate an output value, which is then multiplied with the cell state passing through a hyperbolic tangent function to form the representations in the hidden state. The structure of the LSTM cell is illustrated in .
Figure 1. The structure of the LSTM cell.
GRU
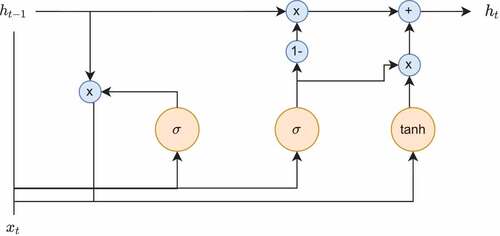
The GRU (Cho et al. Citation2014; Chung et al. Citation2014) network is another well-known RNN model using a gating mechanism similar to that in LSTM, but it has a simpler cell architecture and is computationally more efficient (Lara-Bentez, Carranza-Garca, and Riquelme Citation2021; Torres et al. Citation2021). The GRU cell only has two gates, an update gate and a reset gate
. The update gate decides the amount of previous information to be passed to the next state, helping capture long-term dependencies in the sequence. The reset gate determines how much of the past information to neglect and is responsible to learn short-term dependencies. The GRU cell is formulated by
where the notation is similar to that in (1). The functionalities of the gates used in GRU are also similar to those in LSTM. shows the structure of the GRU cell.
Figure 2. The structure of the GRU cell.
Transformer
Since introduced in 2017, Transformer (Vaswani et al. Citation2017), a solely self-attention based encoder-decoder network, has become the state-of-the-art model in natural language processing, along with a number of its variants (Devlin et al. Citation2018; Liu et al. Citation2019; Yang et al. Citation2019). Recently, Transformer and self-attention based models have gained increasing popularity in time series tasks (Wu et al. Citation2020; Li et al. Citation2019; Wen et al. Citation2020; Zhou et al. Citation2021). Transformer abandons the recurrent layers of RNNs that process data of the input sequence one after another. It instead uses a self-attention mechanism, which ditches the sequential operations and can access any part of the sequence, to capture global dependencies and enable parallel computation.
The core of Transformer is the scaled dot-product self-attention written as
where and
are matrices with the
-th rows being the
-th query, key and value vectors, and
is the dimension of the key vectors. In a self-attention layer, input data pass through three separate linear layers to form the query, key, and value matrices. Dot products of queries and keys are then calculated. In masked attention layers, a mask of the same size as the dot product matrix, with the upper triangle of the mask having values of
and
’s elsewhere, is added to the dot product to prevent values in a sequence from attending to succeeding ones. The dot product matrix scaled by
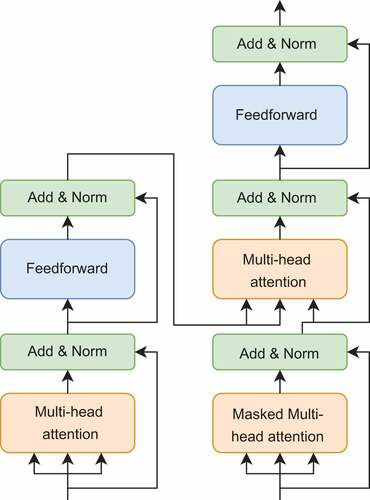
is then fed into the softmax function. The attention scores are calculated by the dot product between the output of the softmax function and the value matrix. In multi-head attention layers, multiple self-attention layers are stacked with each layer consisting of different sets of weights. The final attention scores are generated by combining attention scores calculated in parallel from each self-attention layer. To use the sequence-order information, Transformer adopts a positional encoding mechanism based on sine and cosine functions. The encoded values are added to the input data, indicating positional information of each value in the sequence, such that Transformer can distinguish values in one position from another without requiring specific order of the input data. illustrates Transformer’s encoder-decoder architecture.
Figure 3. Transformer’s encoder-decoder architecture. The left four blocks form an encoder layer and the right six blocks form a decoder layer. The encoder’s input is first passed through a multi-head attention block, followed by residual connection and layer normalization. The output then goes through a feedforward layer, followed by another residual connection and layer normalization. The decoder’s input is fed first into a masked multi-head attention block, then residual connection and layer normalization. The procedure for the next four blocks is the same as for the encoder, except that the encoder output is fed into the multi-head attention block with the decoder output from the second block.
Informer
The quadratic computational complexity of dot-product self-attention and the heavy memory usage in stacking layers are major concerns in dealing with long input sequences. There have been some attempts to address these issues (Beltagy, Peters, and Cohan Citation2020; Child et al. Citation2019; Shiyang et al. Citation2019; Zhou et al. Citation2021). We focus on the award-winning method Informer (Zhou et al. Citation2021).
Informer is proposed as an enhancement of Transformer on long-sequence time series forecasting. Informer adopts a ProbSparse self-attention mechanism which selects only the most dominant queries for each key to attend to:
where only contains the top-
queries chosen under the query sparsity measurement with Kullback–Leibler divergence which is further approximated efficiently with random sampling. The ProbSparse self-attention allows Informer to reduce both time complexity and memory usage from
down to
for input length
. In addition, Informer allows longer input sequences by using the self-attention distilling:
where is the attention block,
is the
-th sequence in the
-th attention layer, MaxPool
is a max-pooling layer with stride 2, ELU
is the ELU activation function, and Conv1d
is a 1-D convolutional filter with kernel size of 3. By distilling, a more condensed feature map is passed from one attention layer to the next, while information is largely preserved. The corresponding memory usage is
instead of
for
-stacking layers, where
is a small number.
Ensemble Learning Methods
Ensemble learning combines the results from multiple models to produce predictions (Dong et al. Citation2020). The combined results usually exhibit better performance because ensemble methods can often decrease the likelihood of overfitting, reduce the chance of being trapped in a local minimum, and extend the size of the search space (Sagi and Rokach Citation2018). In time series forecasting tasks, commonly used ensemble methods include basic ensemble methods, error-based method, and machine learning methods. In the following sections, denotes the matrix of predictions from
forecasting models at
time points,
is the predicted value from the
-th model at the
-th time point, and
is the final prediction at the
-th time point.
Basic Ensemble Methods
Basic ensemble methods combine the predictions from all base models by some simple functions such as mean and median:
Although these methods are straightforward and simple to comprehend, they ignore the possible relationship among base models and thus are not adequate for combining nonstationary models (Allende and Valle Citation2017).
Error-based Method
Unlike the mean ensemble method that weighs all base models equally, error-based method assigns weights inversely proportional to forecast errors (Adhikari and Agrawal Citation2014). Specifically, the data is divided into training and validation sets. A specific evaluation metric is selected to compute the forecast error on the validation set for the
-th base model fitted on the training set, and then the model’s weight is
The final prediction of this method is
The error-based method improves the mean ensemble method by allowing different weights for base models, but its performance is still highly dependent on the forecasting performance of each base model.
Linear Regression
The mean, median, and error-based ensemble methods are all linear ensemble methods in the form of (3). The linear ensemble problem can be written as the linear model:
where the forecasts of base models are the features, and the true observation
is the target. Linear regression, or the least squares method, provides the optimal weights that minimize the sum of squared errors
. Formulate (4) in the matrix form
The optimal weight vector given by linear regression is with
the Moore-Penrose pseudo-inverse of
(Penrose Citation1956).
XGBoost
As ensemble learning is essentially a regression problem with features and target
, any machine learning algorithm for regression is applicable as an ensemble method. In addition to linear regression, there are many nonlinear regression methods such as kernel regression (Li and Racine Citation2007), support vector regression (Cherkassky and Ma Citation2004), and tree-based regression algorithms (Breiman Citation2001; Breiman et al. Citation1984; Friedman Citation2001).
We consider the state-of-the-art nonlinear method, XGBoost (Chen and Guestrin Citation2016), a highly efficient and effective implementation of gradient boosted decision trees. XGBoost aims to solve the objective function
where is a differentiable convex loss function that measures the difference between the prediction
and the target
,
is the vector of input features,
are decision trees, and
is the penalty term with tuning parameters
and
to control the model complexity in which
and
are the number of leaves and the leaf weights in the tree. The first term is the objective of the traditional gradient tree boosting, while the second term added by XGBoost is to prevent overfitting.
To apply XGBoost to ensemble multiple forecasting models, we simply let the input vector be the predictions of the base forecasting models, that is,
This is an innovative use of XGBoost, in contrast to its ordinary usage in supervised learning where explicit features are ready to be the input. In other words, XGBoost can not be directly applied to predict the time series , since we only have the time series itself and the associated time. If time is used as the input, then the XGBoost model is approximately equivalent to a high-order polynomial of time, which is not recommended in time-series literature because the resulting forecast is often unrealistic when the model is extrapolated (Hyndman and Athanasopoulos Citation2018). Alternatively, if observations at previous time steps are the input, the XGBoost model resembles the autoregressive model that only captures short-range temporal dependence (Brockwell and Davis Citation1991). Instead of building a XGBoost-based time series model from scratch, we use XGBoost to ensemble the predictions from existing forecasting methods.
We intrinsically use XGBoost as a two-level ensemble method here to combine the predictions of multiple forecasting methods. As shown in (5), XGBoost itself is an ensemble method that sums the results of decision trees, each of which is a base model. In addition to the ensemble nature of XGBoost, each decision tree therein nonlinearly ensembles the forecasts of base time-series models. The entire procedure turns out to be an ensemble model that has two levels of ensembles, which is expected to perform better than single-level ensemble methods such as those mentioned above.
We thus propose a model called XGBoost-DL, which uses XGBoost to ensemble the predictions from the four deep learning models LSTM, GRU, Transformer and Informer. Our XGBoost-DL is simple yet novel and effective, because it takes advantage of our innovative use of XGBoost as a two-level nonlinear ensemble method and the superior performance of these deep learning models in time-series forecasting, and indeed achieves the best result in our experiment.
Experiments
Data Description
The sunspot number dataset is obtained from the website of World Data Center SILSO, Royal Observatory of Belgium, Brussels.Footnote1 The dataset contains 3277 records of monthly averaged total sunspot number from January 1749 to January 2022. We also consider NASA’s past forecast (from April 1999 to January 2022) and most recent forecast (from February 2022 to October 2041) obtained from its websiteFootnote2 for comparison with considered methods. NASA uses a linear regression model based on the 13-month smoothed and Lagrangian interpolated data to predict sunspot numbers, for which a brief description is given in Suggs (Citation2017) but detailed implementation and computer code are not disclosed.
The observed sunspot number data is split in chronological order into training (2160 records from January 1749 to December 1928), validation (843 records from January 1929 to March 1999), and testing (274 records from April 1999 to January 2022) sets. The validation set monitors the training for hyperparameter tuning. The testing set evaluates the performance of each trained model on unseen data. The ratio of training and validation sets is 7/3, and the testing set is concurrent with NASA’s past forecast. The best model will be used to predict sunspot numbers from February 2022 to October 2041, covering the remaining portion of current Solar Cycle 25 and the coming Solar Cycle 26, in alignment with NASA’s current forecasting time range.
Implementation Details
We compare the three non-deep learning models, SARIMA, Holt-Winters multiplicative Exponential Smoothing, and Prophet, and the four deep learning models, LSTM, GRU, Transformer, and Informer. We also consider their ensemble models from the mean and median ensemble methods, the error-based method, linear regression, and our proposed ensemble method via XGBoost.
We adopt the two evaluation metrics, the root mean squared error (RMSE) and the mean absolute error (MAE), which are widely used in time series forecasting problems (Hyndman and Athanasopoulos Citation2018), to assess the prediction performance of considered methods:
where and
are the predicted value and the true value, respectively, and
is the number of predictions.
All the experiments are performed in Python 3.8 (Van Rossum and Drake Citation2009) environment. All deep learning methods are implemented with Pytorch 1.9.0 (Paszke et al. Citation2019). SARIMA, basic ensemble methods, and the error-based ensemble method are implemented with Merlion 1.0.0 (Bhatnagar et al. Citation2021). Exponential Smoothing and the linear regression ensemble method are performed with Darts 0.15.0 (Herzen et al. Citation2021). The XGBoost ensemble method is carried out using xgboost 1.5.1 (Chen and Guestrin Citation2016). Models are trained on two NVIDIA RTX8000 GPUs. We use Tune (Liaw et al. Citation2018) in Ray API 1.9.0 (Moritz et al. Citation2018) for tuning hyperparameters with best values chosen as the minimizers of the RMSE on the validation set. All deep learning models are trained up to 200 epochs by the AdamW optimizer, and early-stopping is used to prevent overfitting. Source codes with pre-trained models, tuning ranges of model-specific hyperparameters, and best configurations for all models used in this study can be found at our GitHub repository.Footnote3
All ensemble methods are applied independently to ensemble the forecast outputs of the three non-deep learning models, the four deep learning models, and all the seven models, respectively. For basic ensemble methods, training is not required and performance is evaluated directly on the testing set. The ensemble weights from the error-based method are calculated by the inverse of the mean squared error (MSE) of each base model on the validation set. The linear-regression ensemble method computes the weights from the training and validation sets. MSE is chosen as the loss function for training XGBoost-based ensemble models.
Results
In-sample Forecast
presents the performance results of the seven base models on the testing set. All the four deep learning models outperform the three non-deep learning models. The two attention-based deep learning models (Transformer and Informer) exhibit better performance than the two RNN models (LSTM and GRU). In particular, Informer achieves the lowest RMSE and MAE with values 29.90 and 22.35, respectively. All the deep learning models except LSTM show more accurate results than NASA with Informer having lower RMSE and
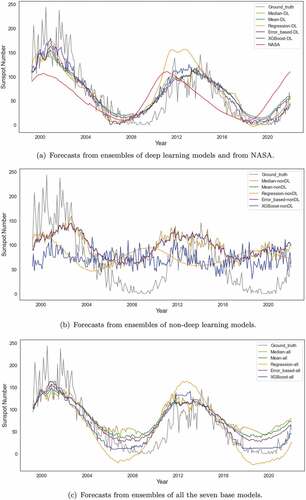
lower MAE. displays the true sunspot numbers and their estimates from deep learning models and NASA for the testing set. It is observed that predictions of deep learning models generally follow along patterns in the ground truth data, while the LSTM and NASA have large deviations around years 2003 and 2020. shows the forecasts from non-deep learning models. The three models fail to predict the true trend of the series due to highly inaccurate forecasts of the peaks and troughs, albeit have an approximately 11-year cycle. With the lowest RMSE and MAE among the three models, the estimates from SARIMA are rather accurate at the beginning of the testing time horizon but notably deviate from the actual values thereafter.
Table 1. Results of base models on the testing set of sunspot numbers
Figure 4. Forecasts of sunspot numbers from base models for the testing set.
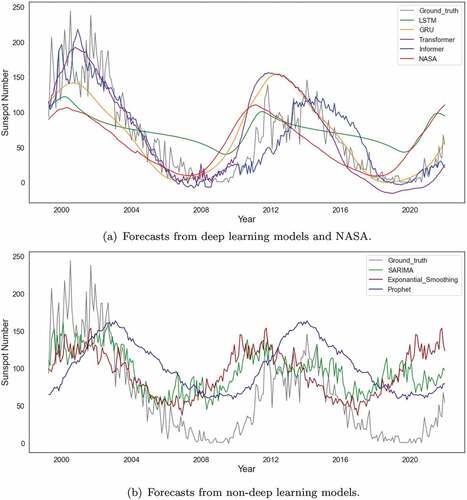
The improved performance of deep learning methods over non-deep learning ones can be attributed in part to the formers’ ability to effectively capture non-linearities, as observed in the complex variations in solar cycles, whereas the latters primarily use linear combinations. Furthermore, the two attention-based methods (Transformer and Informer) appear to better capture the trend by using self-attention mechanisms that allow dependencies over a longer period of time to be included into forecasts.
summarizes the testing results from the ensemble models. With larger MAE or RMSE compared to those in , all ensembles of non-deep learning models and those of all base models fail to improve the performance of SARIMA and Informer, respectively, since non-deep learning models are highly inaccurate in predicting the peaks and troughs of the time series as shown in . All ensembles of deep learning models perform better than those of non-deep learning models due to the solid base on the well-performing deep learning models, and ensembles of all base models have performances between those of the former two.
Table 2. Results of ensemble models on the testing set of sunspot numbers
Figure 5. Forecasts of sunspot numbers from ensemble models for the testing set.
In particular, the best ensemble model, our XGBoost-DL model, i.e., the XGBoost ensemble of deep learning models, significantly boosts the performance, with the smallest RMSE of 25.70 and MAE of 19.82 which are and
lower than those of the best base model Informer. illustrates the forecasts from the three types of ensemble models. All deep-learning ensemble models show strong forecasting abilities in capturing the true trend and seasonality of the series.
Future Forecast
We further consider the prediction of future sunspot numbers in current Solar Cycle 25 and the coming Solar Cycle 26. For conciseness of presentation, we only consider XGBoost-DL and NASA for the future forecast, because XGBoost-DL is the best model for the in-sample forecast in Section 4.3.1, and NASA is the authority in this field, whose forecast serves as the benchmark here due to no ground truth available. We fine-tune our XGBoost-DL model using the entire sunspot number data with a new training and validation split of ratio 7/3 (data from January 1749 to February 1940 for training and the rest for validation).
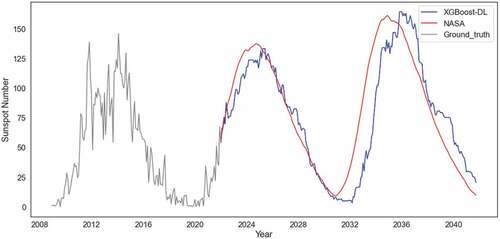
shows the forecast from our XGBoost-DL model in comparison with NASA’s. Our forecast indicates that the Solar Cycle 25 will reach a peak sunspot number of 133.47 in May 2025 and Solar Cycle 26 will have a peak number of 164.62 in November 2035. According to our prediction, the two Solar Cycles will be overall stronger than the past Solar Cycle 24. NASA’s forecast shows similar but earlier peak values of 137.7 for Solar Cycle 25 in October 2024 and 161.2 for Solar Cycle 26 in December 2034. The similarity of the peaks predicted by XGBoost-DL and NASA moderately shows the plausibility of our XGBoost-DL. But the slightly different time of their predicted peaks is noteworthy to researchers who use NASA’s prediction because it is inferior to XGBoost-DL in the in-sample forecast shown in Section 4.3.1.
Figure 6. Sunspot number forecast from February 2022 to October 2041.
Although little work has been done on the sunspot number forecast for Solar Cycle 26, there are a number of recent forecasts for Solar Cycle 25 in the literature with the peak sunspot number ranging from to
and occurring between 2022 and 2026. Our forecast is around the middle of the receptive ranges of magnitude and time. Labonville, Charbonneau, and Lemerle (Citation2019) used a dynamo-based model and forecasted a weak Solar Cycle 25 with a maximum sunspot number of
in
. Covas, Peixinho, and Fernandes (Citation2019) applied a feed-forward neural network and obtained a weaker Solar Cycle 25 with the peak sunspot number of
in about 2022–2023. Han and Yin (Citation2019) predicted a high peak value of
around
years using the Vondrak smoothing method. Pala and Atici (Citation2019) used the LSTM model and predicted a maximum sunspot number of 167.3 in July 2022. Benson et al. (Citation2020) estimated the peak sunspot number in Solar Cycle 25 to be
around March 2025
1 year by using a combination of the LSTM and WaveNet methods. Xiong et al. (Citation2021) predicted with multiple regression a peak of 140.2 in March 2024. Prasad et al. (Citation2022) used a stacked LSTM and predicted the cycle peak with value
in around August 2023
2 months.
Conclusion
We compare three non-deep learning models (SARIMA, Exponential Smoothing, and Prophet) and four deep learning models (LSTM, GRU, Transformer, and Informer) to forecast sunspot numbers in this study. The deep learning models outperform the non-deep learning models with lower RMSE and MAE. The deep learning models use deep neural networks, which theoretically can approximate any sophisticated nonlinear functions (Haykin Citation2009), to better model the complex nonlinear temporal dependencies in time series, in contrast to the non-deep learning models that primarily use linear combinations of time series patterns. In particular, Transformer and its variant Informer are superior over LSTM and GRU, since the former two can capture global dependencies in time series by adopting self-attention mechanisms which ditch the sequential operations of the recurrent layers in the latter two and thus provide access to any part of the sequence. The best-performing deep learning model, Informer, enhances Transformer on long-sequence time series forecasting by using the ProbSparse self-attention mechanism and the self-attention distilling operation.
Additionally, five ensemble learning methods (via mean, median, the error-based method, linear regression, and XGBoost) are applied to the forecast results of non-deep learning models, deep learning models, and all base models, separately. Ensemble models based on deep learning models have more accurate predictions than those based on non-deep learning models or all base models. Our proposed XGBoost-DL model that uses XGBoost to ensemble the four deep learning models achieves the best performance among all base and ensemble models as well as NASA’s forecast. The outstanding result of our XGBoost-DL is owing to its strong two-level nonlinear ensemble architecture formed by decision trees built upon deep learning models. Our prediction indicates that Solar Cycles 25 and 26 will be overall stronger than the most recent Solar Cycle 24, and will have the peak sunspot number of 133.47 in May 2025 and 164.62 in November 2035, respectively, which are similar to but later than the peaks forecast by NASA at 137.7 in October 2024 and 161.2 in December 2034.
There is still room to improve our current work. Our study only considers the point forecasting without taking into account the prediction intervals of the forecasted values. Prediction intervals quantify the forecast uncertainty and are useful in decision making by providing more information to mitigate the risk associated with point forecasts. Although accurate computation of prediction intervals for non-deep learning or deep learning methods is available, e.g., by using quantile regression (Wen et al. Citation2017), the precise estimation method of prediction intervals for ensemble learning is lacking. Besides, some researchers (Labonville, Charbonneau, and Lemerle Citation2019; Prasad et al. Citation2022) investigate the sunspot number prediction by only considering the 13-month smoothed monthly sunspot number series instead of its original monthly mean sunspot number series which is used in our study and many others (Benson et al. Citation2020; Pala and Atici Citation2019; Tabassum, Rabbani, and Bin Omar Citation2020). The original monthly data has relatively large fluctuations and thus is more challenging to predict than the smoothed data. However, it may be interesting to see whether ensembling the deep learning models trained from smoothed data together with those trained from original monthly data will enhance the forecasting performance. We leave them for our future work.
Disclosure Statement
No potential conflict of interest was reported by the author(s).
Additional information
Funding
Notes
References
- Adhikari, R., and R. K. Agrawal. 2014. Performance evaluation of weights selection schemes for linear combination of multiple forecasts. Artificial Intelligence Review 42 (4):529–926. doi:10.1007/s10462-012-9361-z.
- Allende, H., and C. Valle. 2017. Ensemble methods for time series forecasting. In Claudio moraga: A passion for multi-valued logic and soft computing, ed. Rudolf Seising and Héctor Allende-Cid, 217–32. Cham, Switzerland: Springer.
- Arfianti, U. I., D. Candra Rini Novitasari, N. Widodo, M. Hafiyusholeh, and W. Dianita Utami. 2021. Sunspot number prediction using Gated Recurrent Unit (GRU) algorithm. IJCCS (Indonesian Journal of Computing and Cybernetics Systems) 15 (2):141–52. doi:10.22146/ijccs.63676.
- Azcárate, T., B. Mendoza, and J. R. Levi. 2016. Influence of geomagnetic activity and atmospheric pressure on human arterial pressure during the solar cycle 24. Advances in Space Research 58 (10):2116–25. doi:10.1016/j.asr.2016.05.048.
- Beltagy, I., M. E. Peters, and A. Cohan. 2020. Longformer: The long-document transformer. arXiv preprint arXiv:2004.05150.
- Benson, B., W. D. Pan, A. Prasad, G. A. Gary, and Q. Hu. 2020. Forecasting solar cycle 25 using deep neural networks. Solar Physics 295 (5):1–15. doi:10.1007/s11207-020-01634-y.
- Bhatnagar, A., P. Kassianik, C. Liu, T. Lan, W. Yang, R. Cassius, D. Sahoo, et al. 2021. Merlion: A machine learning library for time series. arXiv preprint arXiv:2109.09265.
- Box, G. E. P., and G. M. Jenkins. 1976. Time series analysis: Forecasting and control. In Holden-day series in time series analysis, Revised ed. San Francisco: Holden-Day.
- Breiman, L., J. H. Friedman, R. A. Olshen, and C. J. Stone. 1984. Classification and regression trees. Belmont, CA: Wadsworth International Group.
- Breiman, L. 2001. Random forests. Machine Learning 45 (1):5–32. doi:10.1023/A:1010933404324.
- Brockwell, P. J., and R. A. Davis. 1991. Time series: Theory and methods. In Springer series in statistics, 2nd ed. New York: Springer-Verlag. https://doi.org/10.1007/978-1-4419-0320-4
- Brown, R. G. 1956. Exponential smoothing for predicting demand. D. Arthur. Cambridge, MA, USA: Little Inc. https://www.industrydocuments.ucsf.edu/tobacco/docs/#id=jzlc0130
- Cameron, R. H., and M. Schüssler. 2017. Understanding solar cycle variability. The Astrophysical Journal 843 (2):111. doi:10.3847/1538-4357/aa767a.
- Chang, Y.-C., K.-H. Chang, and W. Guan-Jhih. 2018. Application of eXtreme gradient boosting trees in the construction of credit risk assessment models for financial institutions. Applied Soft Computing 73:914–20. doi:10.1016/j.asoc.2018.09.029.
- Chattopadhyay, S., D. Jhajharia, and G. Chattopadhyay. 2011. Trend estimation and univariate forecast of the sunspot numbers: Development and comparison of ARMA, ARIMA and autoregressive neural network models. Comptes Rendus Geoscience 343 (7):433–42. doi:10.1016/j.crte.2011.07.008.
- Chen, T., and C. Guestrin. 2016. Xgboost: A scalable tree boosting system. In Proceedings of the 22nd acm sigkdd international conference on knowledge discovery and data mining, San Francisco, CA, USA, 785–94.
- Cherkassky, V., and Y. Ma. 2004. Practical selection of SVM parameters and noise estimation for SVM regression. Neural Networks 17 (1):113–26. doi:10.1016/S0893-6080(03)00169-2.
- Child, R., S. Gray, A. Radford, and I. Sutskever. 2019. Generating long sequences with sparse transformers. arXiv preprint arXiv:1904.10509.
- Cho, K., B. van Merriënboer, D. Bahdanau, and Y. Bengio. 2014. On the properties of neural machine translation: encoder–decoder approaches. In Proceedings of SSST-8, Eighth Workshop on Syntax, Semantics and Structure in Statistical Translation, Doha, Qatar, Association for Computational Linguistics, 103–11.
- Chung, J., C. Gulcehre, K. Cho, and Y. Bengio. 2014. Empirical evaluation of gated recurrent neural networks on sequence modeling. In NIPS 2014 Workshop on Deep Learning, Montreal, Canada. ArXiv preprint arXiv:1412. 3555.
- Covas, E., N. Peixinho, and J. Fernandes. 2019. Neural network forecast of the sunspot butterfly diagram. Solar Physics 294 (3):1–15. doi:10.1007/s11207-019-1412-z.
- Davis, G. E., Jr, and W. E. Lowell. 2004. Chaotic solar cycles modulate the incidence and severity of mental illness. Medical Hypotheses 62 (2):207–14. doi:10.1016/j.mehy.2003.11.006.
- Devlin, J., M.-W. Chang, K. Lee, and K. Toutanova. 2018. Bert: Pre-training of deep bidirectional transformers for language understanding. arXiv preprint arXiv:1810.04805.
- Dong, X., Y. Zhiwen, W. Cao, Y. Shi, and M. Qianli. 2020. A survey on ensemble learning. Frontiers of Computer Science 14 (2):241–58. doi:10.1007/s11704-019-8208-z.
- Friedman, J. H. 2001. Greedy function approximation: A gradient boosting machine. Annals of Statistics 29 (5):1189–232.
- Han, Y. B., and Z. Q. Yin. 2019. A decline phase modeling for the prediction of solar cycle 25. Solar Physics 294 (8):1–14. doi:10.1007/s11207-019-1494-7.
- Han, Z., J. Zhao, H. Leung, M. King Fai, and W. Wang. 2019. A review of deep learning models for time series prediction. IEEE Sensors Journal 21 (6):7833–48. doi:10.1109/JSEN.2019.2923982.
- Hathaway, D. H. 2015. The solar cycle. Living Reviews in Solar Physics 12 (1):4. doi:10.1007/lrsp-2015-4.
- Haykin, S. 2009. Neural networks and learning machines. 3rd ed. New York: Prentice Hall.
- Herzen, J., F. Lässig, S. Giuliano Piazzetta, T. Neuer, L. Tafti, G. Raille, T. Van Pottelbergh, et al. 2021. Darts: User-friendly modern machine learning for time series. arXiv preprint arXiv:2110.03224 .
- Hiremath, K. M. 2008. Prediction of solar cycle 24 and beyond. Astrophysics and Space Science 314 (1):45–49. doi:10.1007/s10509-007-9728-9.
- Hochreiter, S., and J. Schmidhuber. 1997. Long short-term memory. Neural Computation 9 (8):1735–80. doi:10.1162/neco.1997.9.8.1735.
- Hochreiter, S. 1998. The vanishing gradient problem during learning recurrent neural nets and problem solutions. International Journal of Uncertainty, Fuzziness and Knowledge-Based Systems 6 (2):107–16. doi:10.1142/S0218488598000094.
- Holt, C. C. 1957. Office of Naval Research Memorandum No. 52. Pittsburgh, PA, USA: Carnegie Institute of Technology.
- Hyndman, R. J., and G. Athanasopoulos. 2018. Forecasting: Principles and practice. 2nd ed. Melbourne, Australia: OTexts.
- Juckett, D. A., and B. Rosenberg. 1993. Correlation of human longevity oscillations with sunspot cycles. Radiation Research 133 (3):312–20. doi:10.2307/3578215.
- Kaushik, S., A. Choudhury, P. Kumar Sheron, N. Dasgupta, S. Natarajan, L. A. Pickett, and V. Dutt. 2020. AI in healthcare: Time-series forecasting using statistical, neural, and ensemble architectures. Frontiers in Big Data 3:4. doi:10.3389/fdata.2020.00004.
- Kuncheva, L. I. 2014. Combining pattern classifiers: Methods and algorithms. 2nd ed. Hoboken, NJ, USA: John Wiley & Sons.
- Labonville, F., P. Charbonneau, and A. Lemerle. 2019. A dynamo-based forecast of solar cycle 25. Solar Physics 294 (6):1–14. doi:10.1007/s11207-019-1480-0.
- Lara-Bentez, P., M. Carranza-Garca, and J. C. Riquelme. 2021. An experimental review on deep learning architectures for time series forecasting. arXiv preprint arXiv:2103.12057 .
- Lewandowski, K. 2015. Massive electricity and communications blackouts on Earth as effect of change the Sun activity. Journal of Polish Safety and Reliability Association 6 (3):91–98.
- Li, Q., and J. S. Racine. 2007. Nonparametric econometrics: Theory and practice. Princeton, NJ, USA: Princeton University Press.
- Li, S., X. Jin, Y. Xuan, X. Zhou, W. Chen, Y.-X. Wang, and X. Yan. 2019. Enhancing the locality and breaking the memory bottleneck of transformer on time series forecasting. Advances in Neural Information Processing Systems 32:5243–53.
- Liaw, R., E. Liang, R. Nishihara, P. Moritz, J. E. Gonzalez, and I. Stoica. 2018. Tune: A research platform for distributed model selection and training. arXiv preprint arXiv:1807.05118.
- Lidiema, C. 2017. Modelling and forecasting inflation rate in kenya using sarima and holt-winters triple exponential smoothing. American Journal of Theoretical and Applied Statistics 6 (3):161–69. doi:10.11648/j.ajtas.20170603.15.
- Liu, Y., M. Ott, N. Goyal, J. Du, M. Joshi, D. Chen, O. Levy, M. Lewis, L. Zettlemoyer, and V. Stoyanov. 2019. Roberta: A robustly optimized bert pretraining approach. arXiv preprint arXiv:1907.11692.
- Liu, H., C. Li, Y. Shao, X. Zhang, Z. Zhai, X. Wang, X. Qi, J. Wang, Y. Hao, Q. Wu, M. Jiao. 2020. Forecast of the trend in incidence of acute hemorrhagic conjunctivitis in China from 2011–2019 using the Seasonal Autoregressive Integrated Moving Average (SARIMA) and Exponential Smoothing (ETS) models. Journal of Infection and Public Health. 13(2):287–94. doi:10.1016/j.jiph.2019.12.008.
- Lybekk, B., A. Pedersen, S. Haaland, K. Svenes, A. N. Fazakerley, A. Masson, M. G. G. T. Taylor, and J.-G. Trotignon. 2012. Solar cycle variations of the Cluster spacecraft potential and its use for electron density estimations. Journal of Geophysical Research: Space Physics 117 (A1). doi:10.1029/2011JA016969.
- Moritz, P., R. Nishihara, S. Wang, A. Tumanov, R. Liaw, E. Liang, M. Elibol, et al. 2018. Ray: A distributed framework for emerging AI applications. In 13th USENIX Symposium on Operating Systems Design and Implementation (OSDI 18), Carlsbad, CA, USA, 561–77.
- Ogunleye, A., and Q.-G. Wang. 2019. XGBoost model for chronic kidney disease diagnosis. IEEE/ACM Transactions on Computational Biology and Bioinformatics 17 (6):2131–40. doi:10.1109/TCBB.2019.2911071.
- Oliveira, M., and L. Torgo. 2015. Ensembles for time series forecasting. In Asian Conference on Machine Learning, 360–70. Hong Kong: PMLR.
- Pala, Z., and R. Atici. 2019. Forecasting sunspot time series using deep learning methods. Solar Physics 294 (5):1–14. doi:10.1007/s11207-019-1434-6.
- Pan, B. 2018. Application of XGBoost algorithm in hourly PM2. 5 concentration prediction. In 3rd International Conference on Advances in Energy Resources and Environment Engineering, Harbin, China, Vol. 113, 012127. IOP publishing. https://iopscience.iop.org/article/10.1088/1755-1315/113/1/012127
- Paszke, A., S. Gross, F. Massa, A. Lerer, J. Bradbury, G. Chanan, T. Killeen, et al. 2019. Pytorch: An imperative style, high-performance deep learning library. Advances in Neural Information Processing Systems 32:8026–37.
- Penrose, R. 1956. On best approximate solutions of linear matrix equations. In Mathematical Proceedings of the Cambridge Philosophical Society, Cambridge University Press, Vol. 52(1), 17–19.
- Prasad, A., S. Roy, A. Sarkar, S. Chandra Panja, and S. Narayan Patra. 2022. Prediction of solar cycle 25 using deep learning based long short-term memory forecasting technique. Advances in Space Research 69 (1):798–813. doi:10.1016/j.asr.2021.10.047.
- Pulkkinen, T. 2007. Space weather: Terrestrial perspective. Living Reviews in Solar Physics 4 (1):1–60. doi:10.12942/lrsp-2007-1.
- Qiu, X., L. Zhang, Y. Ren, P. N. Suganthan, and G. Amaratunga. 2014. Ensemble deep learning for regression and time series forecasting. In 2014 IEEE symposium on computational intelligence in ensemble learning (CIEL), Orlando, FL, USA, IEEE, 1–6.
- Qu, J. 2016. Is sunspot activity a factor in influenza pandemics? Reviews in Medical Virology 26 (5):309–13. doi:10.1002/rmv.1887.
- Rabbani, M. B. A., M. Ali Musarat, W. Salah Alaloul, M. Shoaib Rabbani, A. Maqsoom, S. Ayub, H. Bukhari, and M. Altaf. 2021. A comparison between Seasonal Autoregressive Integrated Moving Average (SARIMA) and Exponential Smoothing (ES) based on time series model for forecasting road accidents. Arabian Journal for Science and Engineering 46 (11):11113–38. doi:10.1007/s13369-021-05650-3.
- Ruohoniemi, J. M., and R. A. Greenwald. 1997. Rates of scattering occurrence in routine HF radar observations during solar cycle maximum. Radio Science 32 (3):1051–70. doi:10.1029/97RS00116.
- Sagi, O., and L. Rokach. 2018. Ensemble learning: A survey. Wiley Interdisciplinary Reviews. Data Mining and Knowledge Discovery 8 (4):e1249.
- Suggs, R. J. 2017. The MSFC Solar Activity Future Estimation (MSAFE) model. In The Applied Space Environments Conference, Huntsville, AL, USA, M17–6038.
- Tabassum, A., M. Rabbani, and S. Bin Omar. 2020. An Approach to Study on MA, ES, AR for Sunspot Number (SN) prediction and to forecast SN with seasonal variations along with trend component of time series analysis using Moving Average (MA) and Exponential Smoothing (ES). In Advances in electrical and computer technologies, ed. T. Sengodan, M. Murugappan and S. Misra, 373–86. Singapore: Springer.
- Taylor, S. J., and B. Letham. 2018. Forecasting at scale. The American Statistician 72 (1):37–45. doi:10.1080/00031305.2017.1380080.
- Torres, J. F., D. Hadjout, A. Sebaa, F. Martnez-Álvarez, and A. Troncoso. 2021. Deep learning for time series forecasting: A survey. Big Data 9 (1):3–21. doi:10.1089/big.2020.0159.
- Tsui, F.-C., M. Sun, L. Ching-Chung, and R. J. Sclabassi. 1995. Recurrent neural networks and discrete wavelet transform for time series modeling and prediction. In 1995 International Conference on Acoustics, Speech, and Signal Processing, Detroit, MI, USA, IEEE, Vol. 5, 3359–62.
- Usoskin, I. G. 2017. A history of solar activity over millennia. Living Reviews in Solar Physics 14 (1):1–97.
- Van Rossum, G., and F. L. Drake. 2009. Python 3 Reference Manual. Scotts Valley, CA: CreateSpace.
- Vaswani, A., N. Shazeer, N. Parmar, J. Uszkoreit, L. Jones, A. N. Gomez, Ł. Kaiser, and I. Polosukhin. 2017. Attention is all you need. Advances in Neural Information Processing Systems 30:5998–6008.
- Walterscheid, R. L. 1989. Solar cycle effects on the upper atmosphere-Implications for satellite drag. Journal of Spacecraft and Rockets 26 (6):439–44. doi:10.2514/3.26089.
- Wen, R., K. Torkkola, B. Narayanaswamy, and D. Madeka. 2017. A multi-horizon quantile recurrent forecaster. arXiv preprint arXiv:1711.11053.
- Wen, Q., L. Sun, F. Yang, X. Song, J. Gao, X. Wang, and X. Huan 2020. Time series data augmentation for deep learning: A survey. arXiv preprint arXiv:2002.12478.
- Wichard, J. D., and M. Ogorzalek. 2004. Time series prediction with ensemble models. In 2004 IEEE International Joint Conference on Neural Networks (IEEE Cat. No. 04CH37541), Budapest, Hungary, IEEE. Vol. 2, 1625–30.
- Winters, P. R. 1960. Forecasting sales by exponentially weighted moving averages. Management Science 6 (3):324–42. doi:10.1287/mnsc.6.3.324.
- Wu, N., B. Green, X. Ben, and S. O’Banion. 2020. Deep transformer models for time series forecasting: The influenza prevalence case. arXiv preprint arXiv:2001.08317.
- Xiong, Y., L. Jianyong, K. Zhao, M. Sun, and Y. Gao. 2021. Forecasting Solar Cycle 25 using comprehensive precursor combination and multiple regression technique. Monthly Notices of the Royal Astronomical Society 505 (1):1046–52. doi:10.1093/mnras/stab1159.
- Xu, T., W. Jian, W. Zhen-Sen, and L. Qiang. 2008. Long-term sunspot number prediction based on EMD analysis and AR model. Chinese Journal of Astronomy and Astrophysics 8 (3):337. doi:10.1088/1009-9271/8/3/10.
- Yang, Z., Z. Dai, Y. Yang, J. Carbonell, R. R. Salakhutdinov, and Q. V. Le. 2019. Xlnet: Generalized autoregressive pretraining for language understanding. Advances in Neural Information Processing Systems 32:5753–5763.
- Zhang, J., and K.-F. Man. 1998. Time series prediction using RNN in multi-dimension embedding phase space. In SMC’98 Conference Proceedings. 1998 IEEE International Conference on Systems, Man, and Cybernetics (Cat. No. 98CH36218) San Diego, CA, USA, IEEE, Vol. 2, 1868–73.
- Zhong, J., Y. Sun, W. Peng, M. Xie, J. Yang, and X. Tang. 2018. XGBFEMF: An XGBoost-based framework for essential protein prediction. IEEE Transactions on Nanobioscience 17 (3):243–50. doi:10.1109/TNB.2018.2842219.
- Zhou, H., S. Zhang, J. Peng, S. Zhang, L. Jianxin, H. Xiong, and W. Zhang. 2021. Informer: beyond efficient transformer for long sequence time-series forecasting. In The Thirty-Fifth AAAI Conference on Artificial Intelligence, AAAI 2021, Virtual Conference, AAAI Press, Vol. 35, 11106–15.