
 ?Mathematical formulae have been encoded as MathML and are displayed in this HTML version using MathJax in order to improve their display. Uncheck the box to turn MathJax off. This feature requires Javascript. Click on a formula to zoom.
ABSTRACT
Diabetes is a disease that requires long-term monitoring, and noninvasive glucose detection effectively reduces patient self-monitor resistance. Traditional noninvasive blood glucose methods are limited by many aspects, such as equipment, environment, and safety, which are not suitable for practical use. Aiming at this problem, propose a lightweight network called Group Asymmetric Convolution Shuffle Network (GACSNet) for noninvasive blood glucose detection: use infrared imaging to acquire human metabolic heat and construct a dataset, combine asymmetric convolution with channel shuffle unit, the novel convolution neural network is designed, and extract metabolic heat and cool-heat deviation features in thermal imaging. The test set was analyzed and compared using Clarke’s error grid. The current neural network showed an mean absolute percentage error of 9.17%, with a training time of 2 min 54 s and a inference time of 1.35 ms, which was superior to several traditional convolution neural networks’ accuracy, training cost, and real-time performance in the blood glucose region 3.9–9 mmol/L, and provided new insights into noninvasive blood glucose detection.
Introduction
In recent years, the degree of aging has gradually deepened. Improving the quality of life for diabetic patients has become one of the critical concerns of society (Roncon et al. Citation2020; Speight et al. Citation2020), especially the blood glucose detection (Wu et al. Citation2020). Up to now, diabetes is a hazardous disease that is impossible to cure. The medical industry is very compatible with artificial intelligence due to its high knowledge reserve. For example, the use of deep learning models to diagnose lung cancer can achieve 97% accuracy (Wahab, Khan, and Lee (Citation2019)).
The majority of studies on noninvasive blood glucose detection focus on spectral detection, metabolic heat integration detection, and tissue fluid detection (Delbeck et al. Citation2019; Tang et al. Citation2020).
Spectral detection is based on the absorption and refractive index of the glucose in the blood. Sim et al. (Citation2018) used photoacoustic spectroscopic analysis in conjunction with microscopic skin data to determine an acceptable skin region for noninvasive blood glucose monitoring. Tissue fluid detection employs sensors to detect glucose and its secondary products in bodily fluids such as saliva, tears, and perspiration, therefore determining blood glucose indirectly. Using nano-gold sensors, Zhai et al. (Citation2019) effectively established noninvasive bimodal glucose and strain detection in sweat.
The metabolic heat integration detection, which is based on the law of energy conservation, monitors blood glucose by detecting the metabolic heat generated by the human body. Seidman et al. (Citation1991) started to investigate the effect of glucose on metabolic heat. Zhao and Myllylä (Citation2005) later demonstrated the in vitro and in vivo detection of blood glucose. Cho et al. (Citation2004) suggested a noninvasive approach for detecting blood glucose using metabolic heat.
This study uses thermal imaging for noninvasive blood glucose detection. Infrared thermal imaging has been applied in numerous fields. Nasiri et al. (Citation2019) used Convolutional Neural Network (CNN) to assess and identify the infrared image defect of the radiator. Infrared thermal imaging is also widely used in clinical diagnosis, including pain diagnosis, fever diagnosis, inflammation diagnosis, etc. (Ring and Ammer (Citation2012)). In addition, infrared thermal imaging is also used to diagnose local myocardial ischemia (Ornek, Ceylan, and Ervural (Citation2019)). Currently, infrared thermal imaging may assess whether a patient has diabetes (Selvarani and Suresh (Citation2019); Sun, Li, and Song (Citation2018)).
Based on the metabolic heat integration method, using infrared thermal imaging to obtain human metabolic heat (He, Wu, and Yang. (Citation2019)). The human body may be approximated as a black body. Metabolic heat is closely related to thermal radiation. Infrared thermal imaging acquires the energy radiated from objects, which may reduce the interference of visible light, acquire the thermal radiation data of the major facial arteries and veins, and then perform noninvasive blood glucose detection.
A lightweight network is proposed as follows: Group Asymmetric Convolution Shuffle Network (GACSNet). In order to emphasize the difference between cold and heat deviations in facial thermal imaging, the dataset is transformed into iron rainbow pseudo-color images using the gray-scale features of infrared images. We constructed the neural network using the asymmetric convolution and shuffling unit. The results reveal that this network is as accurate as classical networks while requiring fewer training and hardware resources, providing a novel noninvasive blood glucose detection method.
Related Works
Convolutional Neural Network
Convolutional neural network (CNN) is a representative network in the field of deep learning (Yao, Lei, and Zhong Citation2019). Before its development, image features were mainly extracted by inefficient manual perceptrons. CNN has been widely used in facial recognition, motion detection, and medical image processing in recent years.
Medical images are characterized by low resolution, and traditional diagnosis requires a large number of doctor resources to be effective. CNN has been widely used in radiology and cell biology (Nagendran et al. Citation2020; Yamashita et al. Citation2018), and there have been some achievements in the research of lung and liver diseases diagnosis (Frid-Adar et al. Citation2018; Schlemper et al. Citation2019).
When performing noninvasive blood glucose detection, the traditional metabolic thermal integration method uses a large number of sensors for data acquisition. This method has complex equipment and is not suitable for practical use. This paper collects infrared thermal imaging to study the human body’s metabolic heat and the cool-heat deviation features extracted by deep learning.
Lightweight Network
In practical engineering applications, a lightweight network overcomes the issue of limited hardware resources (Zhou et al. Citation2020). With the development of neural networks, the rise in network accuracy is often followed by a growth in scale and computation, which conflicts with the restricted store capacity and processing capability of embedded devices, impairing the performance of real-time engineering.
Therefore, the lightweight of the network has become the focus. The characteristic of lightweight networks is the extensive use of group convolution, point convolution, and other algorithms that optimize the convolution process, then designing the multiplex structures, reducing parameters to improve real-time performance. These are the necessary steps for traditional neural network deployment.
Shuffle Unit
Zhang et al. (Citation2018) proposed ShuffleNet, a lightweight network that is mainly used to solve the computing resource shortage on mobile platforms. In the field of lightweight networks, ShuffleNet uses group point convolution and proposes channel shuffling, which solves the problem of the lack of information exchange among groups, as with MobileNet’s depthwise convolution, and increases the network’s efficiency. The group convolution and channel shuffling are shown in .
Figure 1. Group convolution and channel shuffling.
Assuming that the convolution layer has G groups and G*N output channels, the output channels are first restructured into (G,N), then transposed into (N,G), and flattened into (1,G*N). As seen in , when g = 3 and n = 4, G1, G2, and G3 are restructured into three rows and four columns, respectively, and then transposed into four rows and three columns. Channel shuffling is accomplished after flattened.
Figure 2. Architecture of channel shuffle.
The majority of traditional networks deploy using a compression strategy, which significantly influences accuracy. ShuffleNet, like MobileNet, is a lightweight network that optimizes the convolution structure. Furthermore, compared to networks such as ResNet, it can reduce the number of parameters while increasing network performance, avoiding the lack of information exchange among groups.
Asymmetric Convolution
Asymmetric convolution is an optimization method in InceptionV3 (Li et al. Citation2021; Szegedy et al. Citation2016). In the previous version, the network used 3 3 convolution instead of 5
5 and 7
7 convolution. In the V3, the convolution is decomposed into asymmetric convolution. That is, 3
1 and 1
3 convolution are used instead of 3
3 convolution. The structure is shown in .
Figure 3. Architecture of asymmetric convolution.
Asymmetric convolution reduced the computation cost and increased the network’s depth via decomposition. EquationEquation (1)(1)
(1) shows the optimization efficiency:
Simplified as
where is defined as the percentage of the optimized computation from original,
is the size of the kernel,
is the image height,
is the image width,
is the number of input channels, and
is the number of output channels. In this paper, asymmetric convolution is used to optimize 3
3 convolution. From EquationEquation (2)
(2)
(2) , it can be seen that one-thirds reduce the computation amount of convolution. Meanwhile, the number of convolution layers is increased, which improves the nonlinearity of the network.
The Proposed Method
Dataset Acquisition
A thermographic camera is used to capture human metabolic heat from the face, including arteriovenous heat radiation from the facial, supraorbital, medial canthal, superficial temporal, etc., to detect cool-heat deviations (Sun, Li, and Song Citation2018).
The acquisition equipment included a thermographic camera with a resolution of 320 240 pixels and thermal sensitivity of less than 0.07°C, as well as a blood glucose meter with a testing range of 0.6–33.3 mmol/L. During the acquisition process, subjects must have an empty stomach and be in a stable body condition at room temperature, with no external heat source or shielding interference. As shown in , blood samples are taken after disinfecting the region to be acquired, and thermal imaging is taken as quickly as feasible within 1 min.
Figure 4. Process of acquisition.
Volunteers were recruited in cooperation with the hospital for this data acquisition. Each subject had their data acquired once to guarantee sample variety, resulting in 604 sets of data. Then, it was divided into the training set, validation set, and test set as shown in :
Table 1. Information of blood glucose dataset
Data Augmentation
The data distribution of the training set is imbalanced. Therefore, we designed a data augmentation method to improve the data imbalance. Wavelet Sample Pairing Fusion (WSPF) is used in this study to perform data augmentation. The process is shown in :
Figure 5. Process of data augmentation.

Wavelet transform is a typical fusion method that decomposes each picture into high- and low-frequency components using the wavelet function. It performs high-pass filtering in order to preserve details, low-pass filtering in order to eliminate noise, and information reconstruction in order to obtain the fusion image. The wavelet transform of the discrete image is shown in EquationEquation (3)(3)
(3) :
where and
represent high-pass filters and
and
represent low-pass filters.
and
represent the image’s rows and columns.
represents the image’s low-frequency component, and
,
, and
represent the image’s high-frequency component. They are referred to as
,
,
, and
. The reconstruction algorithm is shown in EquationEquation (4)
(4)
(4) :
The original Sample Pairing algorithm is a data augmentation method proposed by Inoue (Citation2018), which is suitable for medical images. Using two randomly selected images, A and B, with different labels as an example. Channel fusion is done on each channel of the two images to construct a new image C with the label A or B. Sample Pairing may cause some oscillations during the fine-tuning stage, but the accuracy is obviously increased at the convergence stage. This method has no label restrictions for the issue examined in this study, making it easier to transfer from classification to regression problems.
The WSPF algorithm was used to process the image fusion in this study with 5-level filtering based on the sym4 wavelet, and the blood glucose value was interpolated to reduce the impact of data imbalance. The results are shown in :
Table 2. Information of data augmentation
Network Structure
When constructing GACSNet, asymmetric convolution is used to optimize the convolution process of the shuffle unit, and the 3 3 convolution in the grouped convolution is decomposed into 3
1 and 1
3 convolutions to reduce the amount of computation. The improved network is divided into two modules, Block A and Block B, and its structure is shown in :
Figure 6. Architecture of Block A and B.
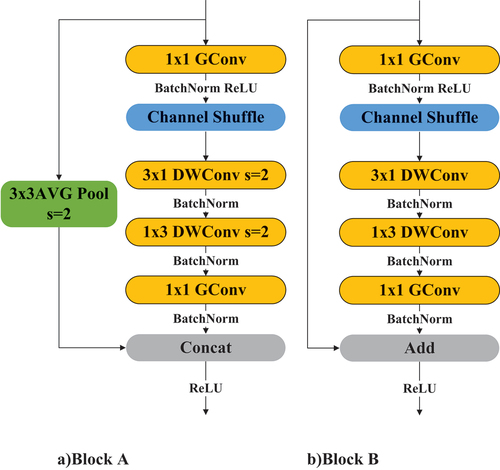
where Block A is an improved connection unit, and Block B is an improved Shuffle unit. When constructing GACSNet. Channel resizing and feature extraction are performed in Block A, while the Block B only performs feature extraction.
Besides the optimization of asymmetric convolution, it is necessary to consider the effect of BatchNorm on the GACSNet constructed in this paper, as showed in EquationEquation (5)(5)
(5) :
Simplified as
where is the optimization rate after considering the calculation of BatchNorm, and
is the number of output channels. EquationEquation (6)
(6)
(6) reveals that the more input data channels, the closer to the conclusion in EquationEquation (2)
(2)
(2) . The optimization rate of the GACSNet structure for ordinary convolution is between 66.7% and 80%.
GACSNet first uses traditional convolution to increase the dimension of the input image. The network input uses the iron rainbow pseudo-color image with the size of 224 224
3. Compared with gray images, it can strengthen the difference between the thermal imaging facial cool-heat deviation, and facilitate features extraction. The
in the entire process is 32, 128, 256, and 512. EquationEquation (6)
(6)
(6) reveals that the goal of optimizing the network and reducing the amount of calculation can be achieved. The GACSNet structure is shown in and :
Figure 7. Architecture of GACSNet.
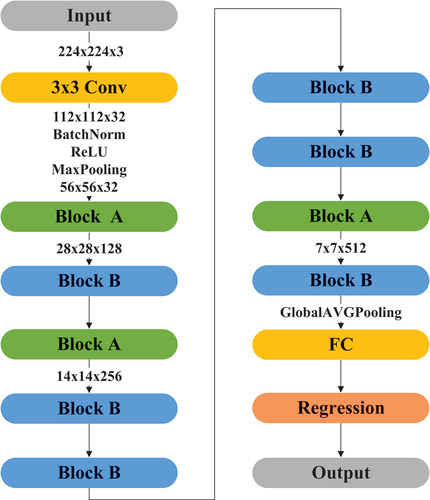
Table 3. Architecture of GACSNet
We construct GACSNet by using Block A to reduce the channel size and Block A, B to extract features, with 2, 4, and 2 blocks for the stage of 128, 256, and 512 output channels, respectively. The method can efficiently reduce computation time, increase the depth, improve the nonlinearity, and reduce the over-fitting of the network.
Additionally, the total number of layers in GACSNet is relatively few, improving the network in two aspects: computation cost and network depth. Finally, the global pooling layer, the fully connected layer, and the regression layer are used to obtain blood glucose detection data.
Evaluation Metric
Mean Absolute Percentage Error
This study analyzes the performance of networks through mean absolute percentage error (MAPE). As shown in EquationEquation (7)(7)
(7) , first, take the absolute value of each percentage error, then average it as one of the evaluation metrics.
where is the total number of test samples,
is the sample number,
is the true value of the sample, and
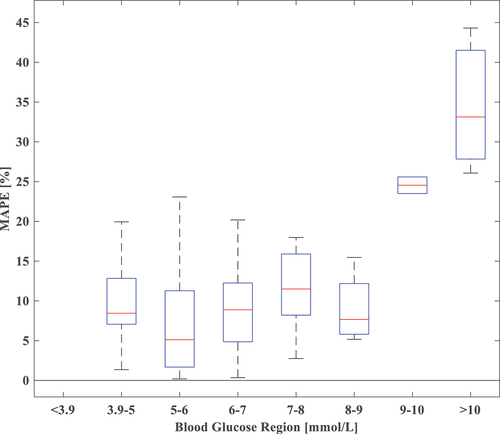
is the predicted value of the sample. The MAPE of GACSNet is shown in .
Figure 8. MAPE of GACSNet.
Clarke’s Error Grid Analysis
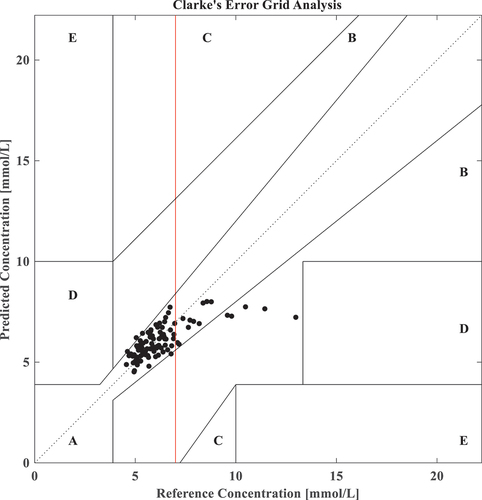
Clarke’s error grid analysis (CEGA) is a gold standard for blood glucose detection accuracy (Li and Jia Citation2017; Sengupta et al. Citation2022). CEGA considers the percentage error, the absolute value, and the difference between the two, which has an excellent clinical application value. Clarke error grid is split into five zones: A, B, C, D, and E, with A and B being clinically acceptable while C, D, and E are not owing to high inaccuracies.
Zone A (acceptable) represents the glucose values that deviate from the reference values by 20% or are in the hypoglycemic region ( mmol/L) when the reference is also within the hypoglycemic range. The values within this range are clinically exact and are thus characterized by correct clinical treatment. Zone B (benign errors) is located above and below Zone A; this Zone represents those values that deviate from the reference values. The values that fall within Zones A and B are clinically acceptable. The dotted line in the middle is the image of the y = x function, which means that the detected value is equal to the actual value. This paper uses the test set and takes the percentage of the detected data in Zone A and B as the result of CEGA to evaluate the network’s anti-interference ability and clinical safety. The CEGA of GACSNet is shown in , which has a red line at 7 mmol/L meaning the start of the hyperglycemic region on an empty stomach.
Figure 9. CEGA of GACSNet.
Experiments and Results
In order to verify the performance of GACSNet in noninvasive blood glucose detection, this paper designed two experiments for comparison. We trained models on Ge-Force RTX 2060 by using transfer learning for 1000 iterations with a mini-batch of 30 images and the initial learning rate of 0.001, which is decreased by a drop-factor of 0.1 at 400 and 800 iterations, respectively. First, different activation functions ReLU and ELU, were used to test the GACSNet and ShuffleNet. Second, GACSNet is compared with other neural network algorithms. The models were evaluated using MAPE, CEGA, training time, and inference time.
Additionally, an inference experiment and embedded device deployment are performed in this study to verify GACSNet’s deployment performance. GACSNet is evaluated by the model size and inference time on Raspberry PI 4B.
Effect of Negative Region Features
The experiment used GACSNet and ShuffleNet, the Shuffle unit’s original networks, to analyze whether the negative region features were discarded or not on the network performance. The ELU with the same positive region as ReLU was selected for comparison. GACSNet constructs Model 1; GACSNet constructs Model 2 with ELU; ShuffleNet constructs Model 3; ShuffleNet constructs Model 4 with ELU. The experimental results are shown in :
Table 4. Performance comparison of the effect in negative region
shows that the GEGA performance of several models is almost the same. GACSNet’s performance on MAPE is 1.01% better than ShuffleNet, and the training time is much lower than ShuffleNet, saving a lot of training resources. The inference time is 1.35 ms, reduced by 17%, saving hardware resources, improving real-time performance, and is easy to deploy on embedded devices.
After replacing the activation function with ELU, the performance of GACSNet decreases and ShuffleNet improves, but the training time increases significantly; in terms of inference time, GACSNet still outperforms ShuffleNet. Through experimental comparison, it is evident that GACSNet slightly outperforms ShuffleNet in terms of performance and significantly lower resource consumption than ShuffleNet, which is more lightweight.
Network Performance Comparison
GACSNet was compared with ResNet-50 (He et al. Citation2016), InceptionV3 (Szegedy et al. Citation2016), and MobileNetV2 (Sandler et al. Citation2018) in this experiment. ResNet-50ʹs residual structure, InceptionV3ʹs asymmetric convolution, and MobileNetV2ʹs depth-separable convolution are all represented to some extent in GACSNet and are therefore suitable for comparison.
The results of comparing other networks are shown in . GACSNet’s accuracy is lower than ResNet-50, but it uses nearly three times the resources; InceptionV3 is less effective, and experimental results indicate that it does not apply to the noninvasive blood glucose detection problem, even though it also uses asymmetric convolution; we can see that GACSNet outperforms MobileNetV2 in both accuracy and resource consumption.
Table 5. Performance comparison of the GACSNet with others
Inference on Embedded Device
GACSNet lightens the network to facilitate its use on embedded devices. In this paper, we use Raspberry Pi 4B to test the inference time of each network and compare its model size, and the results are shown in .
Table 6. Performance of inference on embedded device
GACSNet has the tiniest model size and the fastest inference time, in line with the conclusions obtained on Ge-Force RTX 2060. It reveals that GACSNet has advantages in model deployment for embedded devices with small storage space and low computing capacity.
Discussion
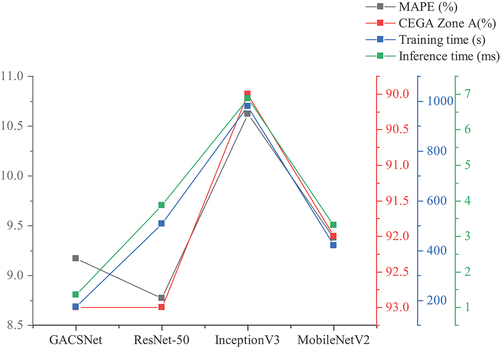
We use asymmetric convolution in the shuffle unit and design the network structure in this paper to optimize the network’s computation cost and depth. The overall process is based on the metabolic heat integration method, which uses infrared imaging to acquire human metabolic heat. Converts grayscale images to iron rainbow pseudo-color images and performs noninvasive blood glucose detection by analyzing the metabolic heat features implied by the grayscale and facial cool-heat deviation features. The CEGA Zone A area’s corresponding axes in were inverted to unify the line chart judgment criteria, i.e., the closer to the X-axis, the better the network performance. Additionally, since all data are contained in Zones A and B, the comparison results about Zone B are ignored.
Figure 10. Performance analysis of the effect in negative region.
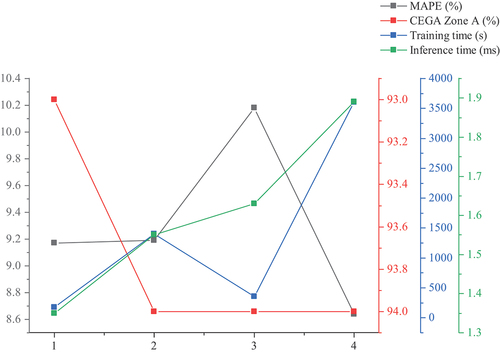
Figure 11. Performance analysis of the GACSNet with others.
The experiment in this paper first studies the effect of negative region features, and the results are shown in : The ShuffleNet with the ELU activation function performs better than other networks. However, due to its characteristic of exponential operation, it consumes more hardware resources. It requires times the training time, indicating that the ELU activation function is more suitable for the noninvasive blood glucose problem when considering only the accuracy. Thermal imaging’s grayscale and cool-heat deviation features are more sensitive to gradients, but the negative region of the ReLU function is a dead zone, which means the output is zero, discarding too many features and providing lower accuracy than ELU. However, ReLU is more suitable for lightweight network by lowering the number of operations, making it more acceptable to employ ReLU for GACSNet.
A comparative study between GACSNet and others was also conducted, as shown in : InceptionV3 has the worst performance in all aspects because the grayscale feature interval of the thermal images is 0–255, with a resolution of 320 240 pixels, and the multi-branch structure of InceptionV3 is too redundant for this problem, and it does not apply to the study in this paper. In addition, MobileNetV2 is better than ResNet-50 in terms of lightweight but has poor accuracy. Meanwhile, the GACSNet proposed in this paper only has a 0.44% disadvantage of MAPE compared with ResNet-50. However, the training and inference time are faster than other networks, revealing that the GACSNet is lightweight.
As shown in , we list the MAPE in segments to discuss the imbalance of the data set. All networks perform with high accuracy in the normoglycemic region and low accuracy in the hyperglycemic region, which reveals that the study in this paper is more applicable to the blood glucose region 3.9–9 mmol/L, with some limitations and poorer performance in the blood glucose region >9 mmol/L. As shown in , the original blood glucose data are almost distributed in the blood glucose region 3.9–7 mmol/L, the normoglycemic region on an empty stomach, and after data augmentation, the networks also had some reliability in the blood glucose region 7–9 mmol/L.
Table 7. MAPE of different blood glucose regions
It can be seen from the experiments that GACSNet outperforms the other networks and takes up fewer resources. The resource consumption advantage of GACSNet outweighs the accuracy disadvantage. The GACSNet’s model size in the inference test is the tiniest, and the expected inference time advantage was consistent with the previous experiment. It reveals that GACSNet has relatively better performance.
Conclusions
This paper proposed the GACSNet based on group shuffle and asymmetric convolution, which is trained with data augmentation for the training set, and the trained GACSNet performs well on embedded devices for noninvasive blood glucose detection. GACSNet effectively reduces the computation of the model and the resource consumption of embedded devices. At the same time, the comparison results with other networks reveal that GACSNet has relatively better performance and is a new method for noninvasive blood glucose detection. However, the data set collected in this paper is not balanced, and the dataset is fewer in the hyperglycemic region. The performance in the hyperglycemic region is lower than that in the normoglycemic region despite the use of data augmentation to improve it, which has its limitations. This study will continue to collect data in the future to solve the data imbalance problem.
Acknowledgments
This research was funded by Beijing Natural Science Foundation (4202026); and Qin Xin Talents Cultivation Program, Beijing Information Science & Technology University (QXTCP A202102).
Disclosure Statement
No potential conflict of interest was reported by the author(s).
Additional information
Funding
References
- Cho, O. K., Y. O. Kim, H. Mitsumaki, and K. Kuwa. 2004. Noninvasive measurement of glucose by metabolic heat conformation method. Clinical Chemistry 50 (10):1894–1116. doi:10.1373/clinchem.2004.036954.
- Delbeck, S., T. Vahlsing, S. Leonhardt, G. Steiner, and H. M. Heise. 2019. Non-invasive monitoring of blood glucose using optical methods for skin spectroscopy—opportunities and recent advances. Analytical and Bioanalytical Chemistry 411 (1):63–77. doi:10.1007/s00216-018-1395-x.
- Frid-Adar, M., I. Diamant, E. Klang, M. Amitai, J. Goldberger, and H. Greenspan. 2018. GAN-based synthetic medical image augmentation for increased CNN performance in liver lesion classification. Neurocomputing 321:321–31. doi:10.1016/j.neucom.2018.09.013.
- He, K., X. Zhang, S. Ren, and J. Sun. 2016. Deep residual learning for image recognition. In Proceedings of the IEEE Conference on Computer Vision and Pattern Recognition (CVPR) Las Vegas, NV, USA, 770–78. IEEE.
- He, M., Y. Wu, and R. Yang. 2019. Research on nondestructive blood glucose cloud detection system based on improved deep regression network. Journal of System Simulation 31 (11):2492. doi:10.16182/j.1004731x.joss.19-FZ0357.
- Inoue, H. 2018. Data Augmentation by Pairing Samples for Images Classification. arXiv preprint arXiv:1801.02929. http://arxiv.org/abs/1801.02929.
- Li, D., and S. Jia. 2017. Application of BP artificial neural network in blood glucose prediction based on multi-spectrum. Laser & Optoelectronics Progress 54 (3):031703. doi:10.3788/lop54.031703.
- Li, Y., X. Li, C. Xiao, H. Li, and W. Zhang. 2021. EACNet: enhanced asymmetric convolution for real-time semantic segmentation. IEEE Signal Processing Letters 28:234–38. doi:10.1109/LSP.2021.3051845.
- Nagendran, M., Y. Chen, C. A. Lovejoy, A. C. Gordon, M. Komorowski, H. Harvey, E. J. Topol, J. P. A. Ioannidis, G. S. Collins, and S. Maruthappu. 2020. Artificial intelligence versus clinicians: Systematic review of design, reporting standards, and claims of deep learning studies. BMJ368. doi:10.1136/bmj.m689.
- Nasiri, A., A. Taheri-Garavand, M. Omid, and G. M. Carlomagno. 2019. Intelligent fault diagnosis of cooling radiator based on deep learning analysis of infrared thermal images. Applied Thermal Engineering 163:114410. doi:10.1016/j.applthermaleng.2019.114410.
- Ornek, A. H., M. Ceylan, and S. Ervural. 2019. Health status detection of neonates using infrared thermography and deep convolutional neural networks. Infrared Physics & Technology 103 (103044):103044. doi:10.1016/j.infrared.2019.103044.
- Ring, E. F. J., and K. Ammer. 2012. Infrared thermal imaging in medicine. Physiological Measurement 33 (3):R33. doi:10.1088/0967-3334/33/3/r33.
- Roncon, L., M. Zuin, G. Rigatelli, and G. Zuliani. 2020. Diabetic patients with COVID-19 infection are at higher risk of ICU admission and poor short-term outcome. Journal of Clinical Virology 127:104354. doi:10.1016/j.jcv.2020.104354.
- Sandler, M., A. Howard, M. Zhu, A. Zhmoginov, and L.-C. Chen. 2018. MobileNetV2: Inverted Residuals and Linear Bottlenecks. In Proceedings of the IEEE Conference on Computer Vision and Pattern Recognition (CVPR) Salt Lake City, UT, USA, 4510–20. IEEE.
- Schlemper, J., O. Oktay, M. Schaap, M. Heinrich, B. Kainz, B. Glocker, and D. Rueckert. 2019. Attention gated networks: Learning to leverage salient regions in medical images. Medical Image Analysis 53 (53):197–207. doi:10.1016/j.media.2019.01.012.
- Seidman, D. S., I. Ashkenazi, R. Arnon, Y. Shapiro, and Y. Epstein. 1991. The effects of glucose polymer beverage ingestion during prolonged outdoor exercise in the heat. Medicine and Science in Sports and Exercise 23 (4):458–62. doi:10.1249/00005768-199104000-00011.
- Selvarani, A., and G. R. Suresh. 2019. Infrared thermal imaging for diabetes detection and measurement. Journal of Medical Systems. Journal of Medical Systems 43 (2):1–11. doi:10.1007/s10916-018-1140-1.
- Sengupta, S., A. Handoo, I. Haq, K. Dahiya, S. Mehta, and M. Kaushik. 2022. Clarke error grid analysis for performance evaluation of glucometers in a tertiary care referral hospital. Indian Journal of Clinical Biochemistry 37 (2):199–205. doi:10.1007/s12291-021-00971-4.
- Sim, J. Y., C.-G. Ahn, E.-J. Jeong, and B. K. Kim. 2018. In vivo microscopic photoacoustic spectroscopy for non-invasive glucose monitoring invulnerable to skin secretion products. Scientific Reports 8 (1):1–11. doi:10.1038/s41598-018-19340-y.
- Speight, J., E. Holmes‐Truscott, C. Hendrieckx, S. Skovlund, and D. Cooke. 2020. Assessing the impact of diabetes on quality of life: What have the past 25 years taught us? Diabetic Medicine 37 (3):483–92. doi:10.1111/dme.14196.
- Sun, T., H. Li, and W. Song. 2018. Sub-health infrared thermal imaging evaluation. Beijing: China Traditional Chinese Medicine Publishing House.
- Szegedy, C., V. Vanhoucke, S. Ioffe, J. Shlens, and Z. Wojna. 2016. Rethinking the inception architecture for computer vision. In Proceedings of the IEEE Conference on Computer Vision and Pattern Recognition (CVPR) Las Vegas, NV, USA, 2818–26. IEEE.
- Tang, L., S. J. Chang, C. J. Chen, and J. T. Liu. 2020. Non-invasive blood glucose monitoring technology: A review. Sensors 20 (23):6925. doi:10.3390/S20236925.
- Wahab, N., A. Khan, and Y. S. Lee. 2019. Transfer learning based deep CNN for segmentation and detection of mitoses in breast cancer histopathological images. Microscopy 68 (3):216–33. doi:10.1093/jmicro/dfz002.
- Wu, X., P. Wu, M. Gu, and J. Xue. 2020. Ratiometric fluorescent probe based on AuNCs induced AIE for quantification and visual sensing of glucose. Analytica Chimica Acta 1104:140–46. doi:10.1016/j.aca.2020.01.004.
- Yamashita, R., M. Nishio, R. K. G. Do, and K. Togashi. 2018. Convolutional neural networks: An overview and application in radiology. Insights into Imaging 9 (4):611–29. doi:10.1007/s13244-018-0639-9.
- Yao, G., T. Lei, and J. Zhong. 2019. A review of convolutional-neural-network-based action recognition. Pattern Recognition Letters 118:14–22. doi:10.1016/j.patrec.2018.05.018.
- Zhai, Q., S. Gong, Y. Wang, Q. Lyu, Y. Liu, Y. Ling, J. Wang, G. P. Simon, and W. Cheng. 2019. Enokitake mushroom-like standing gold nanowires toward wearable noninvasive bimodal glucose and strain sensing. ACS Applied Materials & Interfaces 11 (10):9724–29. doi:10.1021/acsami.8b19383.
- Zhang, X., X. Zhou, M. Lin, and J. Sun. 2018. Shufflenet: An extremely efficient convolutional neural network for mobile devices. In Proceedings of the IEEE Conference on Computer Vision and Pattern Recognition (CVPR) Salt Lake City, UT, USA, 6848–56. IEEE.
- Zhao, Z., and R. Myllylä. 2005. Measuring the optical parameters of weakly absorbing, highly turbid suspensions by a new technique: Photoacoustic detection of scattered light. Applied Optics 44 (36):7845–52. doi:10.1364/AO.44.007845.
- Zhou, Y., S. Chen, Y. Wang, and W. Huan. 2020. Review of research on lightweight convolutional neural networks. In 2020 IEEE 5th Information Technology and Mechatronics Engineering Conference (ITOEC) Seattle, WA, USA, 1713–20. IEEE.