
 ?Mathematical formulae have been encoded as MathML and are displayed in this HTML version using MathJax in order to improve their display. Uncheck the box to turn MathJax off. This feature requires Javascript. Click on a formula to zoom.
ABSTRACT
Drill-in-fluids create what are known as filter cakes. Filter cakes, in some cases, lead to well abandonment because they prevent hydrocarbons from flowing freely from the formation into the wellbore. Cake removal is essential to avoid formation damage. A previous study on filter cake breakers was considered for computational fluid dynamic (CFD) validation. Matlab-CFD and Navier-Stokes equations aimed at predicting and validating visual, multiphase flow under finite element analysis (FEA). The interactions of separate chemical breakers and drill-in-fluid such as ethylenediaminetetraacetic acid (EDTA), silica-nanoparticle (SiO2), and biodegradable synthetic-based mud drill-in-fluid (BSBMDIF) were monitored under a particle size distribution, viscosity, density, and pressure. Predicting return permeability of filter cake was considered under a simple filtration process. The particles’ deposition created pore spaces between them; barite 74 μm, nano-silica 150 nm, and EDTA 10 μm generally closed up the pores of the filtration medium. Under extreme drilling conditions, barite formed thicker regions, and EDTA chemical properties easily disjointed these particles, while SiO2 entirely did not. The experimented results of (EDTA) and SiO2 for return permeability were in full force agreeable with the 2D simulation. A hybrid computational analysis considering CFD under discrete element analysis and neural network can be employed for further research validations.
Introduction
Filter cakes are the medium or seals to prevent the influx of formation fluids into the wellbore. Multiphase fluids are often separated using filtration, which is most common in industries. A medium like a ceramic disc is notable for the laboratory separation of solids and liquids (Picabea et al. Citation2022; Puhan et al. Citation2021). In most cases, filter cakes are formed (Fink Citation2021). During this process, pressure and temperature are influencers of the separation processes. The reduction of pressure determines the energy the process of filtration consumes over time. The resistance of the transition pressure is a result of the physical interactions of the filter cakes to the breakers or the interactions of the solid particles (Jahari et al. Citation2021) with liquids. Hence, the interactions of ethylenediaminetetraacetic acid (EDTA) and silica nanoparticles (SiO2) with filter cakes are essential for defining the energy parameters associated and visually explaining the micromechanics involved. The process of validating the fluid micro-processes can be aided by 2D computational fluid dynamics using the Navier Stokes equations for multiphase flow (Ramadanet al. Citation2021; Sören and Jürgen Citation2012) as it explains why some chemical breakers (Al-Ibrahim et al. Citation2015) enhance return permeability. In literal terms, return permeability is the ability of the porous media to recover its damaged pore throats. However, it is worth noting that the interfacial reactions, whose solid-liquid particle flow separation effects are aggregated rather than by their sizes, impact the general fluid flow principle. Electrostatic force and Van-der- Waals forces influence these particles’ repellences.
The data obtained (Wayo Citation2022) in are from a carefully designed filter cake that was formulated using a biodegradable synthetic (Candler et al. Citation1993) based mud drill-in-fluid (BSBMDIF) which consists of barite (Siddig, Mahmoud, and Elkatatny Citation2020; Tariq et al. Citation2021), synthetic base oil, guar gum, sodium tridecyl ether sulfate, bentonite, caustic soda, calcium chloride, graphene powder, and freshwater. This filter cake interacted with chemical breakers or washers (Irawan et al. Citation2022) composed of main constituents of EDTA and SiO2 to ensure a higher yield of return permeability.
Figure 1. Filter cake from BSBMDIF (a), Chemical Breakers; EDTA (b), SiO2 (c) (Wayo Citation2022).
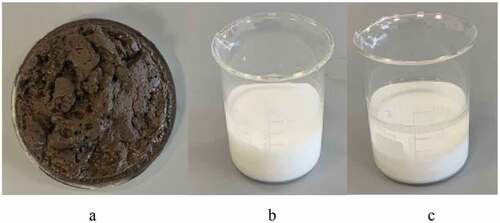
According to Al-Ibrahim, the removal process of filter cakes by EDTA had an incredible 93% efficiency (Al-Ibrahim et al. Citation2015). However, mixing this chelating agent with filter cakes from oil-based mud (Khodja et al. Citation2022; Ofei, Lund, and Saasen Citation2021) was free from emulsions, and the process over time took a maximum of 90 hours for such efficiency. Apart from barite (Bageri et al. Citation2017), calcium carbonate also poses a considerable threat (Bageri et al. Citation2019; Mahmoud et al. Citation2020) to the formation. Shaughnessy expresses a scientific view of reducing formation damage with EDTA; it effectively dissolves the metal ions in the cakes (Shaughnessy and Kline Citation1983). A previous study (Mcelfresh, Olguin, and Ector Citation2012) also examined the dispersion of nanofluids (Mohammadpour et al. Citation2022) for paraffin removal. The authors’ findings demonstrated how skin damage could be minimized by an aqueous (Yao et al. Citation2014) dispersion of nanofluids (Amanullah and Al-Tahini Citation2009; Chengara et al. Citation2004). The formulated additive was noted to have disjoined or dissolved forces that had caused the flow of formation fluid into the wellbore.
A further numerical and experimental analysis from a previous experiment (Shojaei and Ghazanfari Citation2022) demonstrated an elastic investigation of nanoparticle hydrophobicity in reducing formation damage. A weight per cent of 0.2 hydrophobic nano-silica had been observed to increase return permeability at 68.4%.
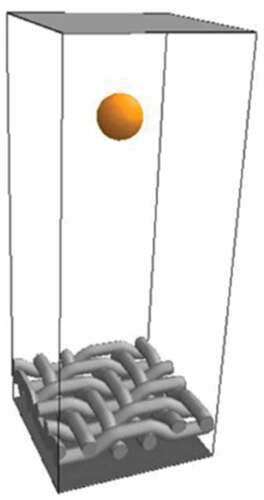
Nonetheless, sticking particles are assumed to have close contact with the starchy cakes as a result of the adhesive nature of the cakes. This mechanism of particle deformation is not further examined in this study. However, it is possible to consider particles under a gaseous state and their contact with strands because there is a high certainty of particles detaching (Puderbach, Schmidt, and Antonyuk Citation2021) themselves from the polymeric strands, as indicated in .
Figure 2. Detachment of particles from strands (Puderbach, Schmidt, and Antonyuk Citation2021).
The dispersivity of particles in the filter cake medium is of greater interest, and EDTA and SiO2 are intended to saturate the surface of the cakes to continually deform and separate particles from their original state and position. Though particle movement (Cundall and Strack Citation1979) and restructuring are best for the formation of cakes (Wakeman Citation2007), to increase the said permeability return (Tran, Abousleiman, and Nguyen Citation2010) using the chemical breakers, it is necessary to focus on particle dispersivity. Particle suspension, deformation, and dispersion under fluid flow concepts can be predicted and validated by the available data.
More so, the dynamics of particles and their kinematics can be validated using a computational fluid dynamic approach from MATLAB FEA Tool Multiphysics software under Navier Stokes equations to define the behavioral trends of particles interacting with chemical fluids to enhance permeability. In this context, numerical simulation (Guo and Curtis Citation2015) and the computer manipulation of data (Hussain and Sharif Citation2000) are capable of simulating particle motions under the effect of pressure.
Methods
Experimental Data
The dispersivity of chemical breakers on the surfaces of the filter cakes was crucial for the experiment conducted to attain the efficacy for return permeability. In , EDTA and SiO2 were independently formulated (Wayo Citation2022) using additives such as NaCl, Deionized Water, Surfactant (Dioctyl Sulf. Sodium Salt), and Mutual solvent (1-Butanol), according to the author’s laboratory assessment. provides a detailed chemical breakdown of the biodegradable synthetic-based mud drill-in fluid utilized to make the polymeric strand slurry necessary for determining the return permeability with interactions from formation pores and chemical breakers.
Table 1. Influence of EDTA and SiO2 on return permeability (Wayo Citation2022).
Table 2. Composition of filter cake buildup (Biodegradable Synthetic-Based Mud DIF) (Wayo Citation2022).
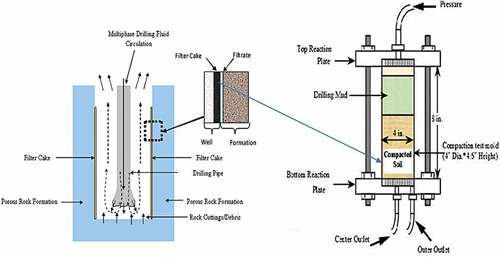
Filter cake buildup (Sauki et al. Citation2020) in was obtained by using the filtration medium (ceramic disc), high-pressure high-temperature (HPHT) filter press, nitrogen gas, and temperature. The cakes were subject to rigorous serial tests, including a soaking test, where chemical breakers get into close contact with the filter cake for different periods.
Figure 3. Experimental flow procedure to attaining data (Wayo Citation2022).
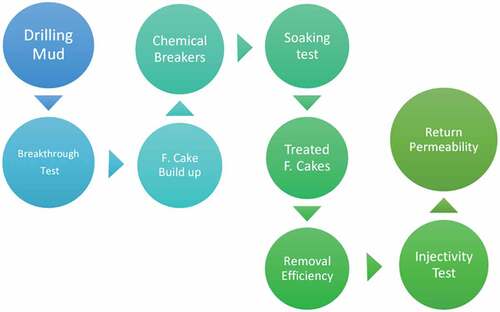
As per the record in , at 24 and 42 hours, the return permeability of the treated cakes numbered 1,2,5, and 6 gave a promising result indicating the effectiveness of chemical breakers. Even though the study’s concern is to identify and validate the reactions of these chemical breakers and filter cakes, the data will be reprocessed and presented in a mathematical formula under finite element analysis for validation.
Governing Equations for Fluid Flow
This approach filters the flow patterns of solid-liquid particles with the nanopore ceramic disc (Liu et al. Citation2019). The escape of the liquid phase (fluid base) of the drilling mud (Chilingar and Vorabutr Citation1981) invading the formation is termed filtration (Parn-anurak and Engler Citation2005). However, chemical breakers that made contact with the mud cakes underwent a rigorous process of filtration to break polymer strands of the buildup cakes. Under the fluid dynamic validation approach, a general Navier Stokes equation was used to govern the filtration process.
More so, fluids under porous media considered for this simulation process employed Darcy’s Law (Fisher et al. Citation2000).
The volume flow rate is directly proportional to the effective permeability tensor
but inversely proportional to the viscosity
; however, the fluid potential
is calculated by the differences between the pressure,
, and the product of fluid density,
, gravity, g and height, z. A further mathematical probe was made to define the relationship between fluid saturation,
and the porosity of the medium
;
EquationEq. (4)(4)
(4) describes the wetting fluid saturation, where
is the capillary pressure and
is the irreducible wetting saturation. The difference between the non-wetting and wetting fluid pressures is known as capillary pressure (Fisher et al. Citation2000), and
is denoted as pore size distribution.
The modeling of relative permeability and Darcy’s law dived considering the equations relating to wetting and non-wetting
fluids as presented in EquationEq. (5)
(5)
(5) and (Equation6
(6)
(6) ).
Modeling Filtration
The resistivity of the free passage of liquid particles into the formation is characterized by the effects of the filtration medium and the filter cakes. A mathematical probe into finding the resistance or the pressure drop across this simulation is written as (Puderbach, Schmidt, and Antonyuk Citation2021);
Whiles in EquationEq. (7(7)
(7) ),
denotes the pressure drops,
and
are the respective resistance of the filter cake and the filter medium. Where is the velocity of flow (Ozofor et al. Citation2021), and
is the viscosity of the liquid. EquationEq. (8)
(8)
(8) further explains the resistivity of the layered cakes; the sectioned equation has
as the pure filter medium resistance and
as the interference resistance.
For the purposes of flow dynamics, numerical simulations considered from experimental data (Wayo Citation2022) would be limited to calculations involving the filtrate’s velocity (Puderbach, Schmidt, and Antonyuk Citation2021) under the influence of the filter cake and medium. However, to understand the flow geometry and pattern, the flow equations must be considered linear (Hund et al. Citation2020), as shown in EquationEq. (9(9)
(9) ), where
is the filtration volume, t is the filtration time,
, filtration constant,
, filter cake resistance and A is the filtration area.
CFD Simulation
The deposition of chemical particles on the filter cakes and the flow of nitrogen gas across the carrier cell of the filter press are simulated under a finite element analysis tool in MATLAB. This Model supports the interpretation of non-Newtonian properties, yet, the Model’s premise explains that the particle trajectory flow follows the same pattern whether the particles are solid or liquid. This porous medium analysis from a laboratory experiment would represent the actual conditions in the reservoir. Also, the filter cake is a replica of the entire residual slurry (Zhang et al. Citation2019) circulated in the wellbore, while the base of the ceramic disc represents the walls of the formation. Filter cake or chemical breakers also represent large volumes that would be used for wellbore circulation. Simulation for the fluid dynamic procedures is simplified under the illustration in .
Figure 4. CFD algorithm.
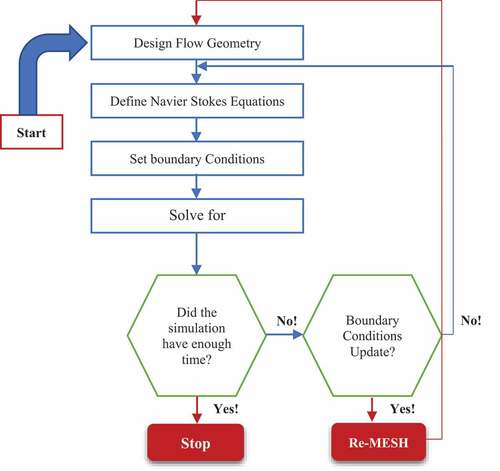
The algorithm for the simulation states that, after an identified equation is proposed to solve the flow validation, the first to begin with is to set the geometry of the filter press or the formation, then verify the mathematical representation of the fluid flow as in the case of Navier Stokes equation. In the third step, a boundary condition is set before the final computational analysis is drawn. Suppose the simulations are impeded by the thickness of the medium or by the pore spaces. In that case, the geometry can be readjusted to start the process again since the initial calculations would not be relevant to the results.
Assumptions
The effect of chemical breakers on the filter cakes was assumed to have similar physiochemical properties. Solid-liquid particles, at best, were considered to have flown and interacted axially in a vertical order of magnitude (Kabir and Gamwo Citation2011). The filter cake thickness of all samples was considered the same, and the porous medium from the same manufacturer was used as the benchmark for filtration. For an effective degradation of synthetic-based filter cake, the flow rate was determined using a constant pressure of 20 psi from nitrogen gas, as demonstrated in . There might be a tolerance level for inaccuracy since the pressure regulators could have been screwed more or less at their initial experimental stages.
Figure 5. Field and Laboratory illustration of slurry invasion/filter cakes (Shehadeh et al. Citation2021).
Particle Sizes
This study solely focuses on the presence of mud samples in and chemical breakers in that were formulated from earlier literature (Wayo Citation2022). The biodegradable mud contained some ingredients pertinent to its suitability for protecting the formation from damage. Barite was used as the main constituent of the formulation in conjunction with guar gum. Other particles (Fred Fu and Dempsey Citation1998) from chemical breakers were considered to be silica nanoparticles (Medhi et al. Citation2021) and EDTA; as each of these made contact with the sample mud after a period of treatment, oil was applied, and under pressure, the size of the solid particles under a ceramic disc was made to define recovery (Khan et al. Citation2021). Barite, Silica nanoparticles (Ahmadabadi, Haghshenasfard, and Esfahany Citation2020) and EDTA are considered the main spherical-solid (Deshpande, Antonyuk, and Iliev Citation2020) particles for the CFD simulation. Researchers (Rabbani and Salehi Citation2017) in their study further explain the rheological (Baba Hamed & Belhadri, Citation2009) and particle distribution (Feng et al. Citation2020) of barite and calcium carbonate in and .
Table 3. Sampled drilling fluid’s rheology for cake buildup (Wayo Citation2022).
Table 4. Chemical breakers (Wayo Citation2022).
Table 5. Barite rheology (Rabbani and Salehi Citation2017).
Table 6. Rabbani’s fluid particle size distribution (Rabbani and Salehi Citation2017).
The physical distribution of these particles to increase the chances of return permeability is of more significant concern. examines the size of particles for the simulation.
Table 7. Mud and breaker particle sizes.
Geometry
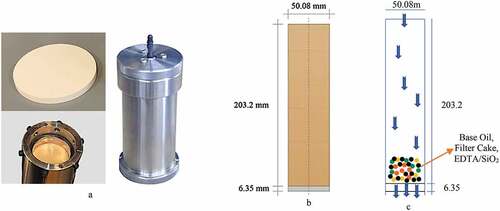
Simulating the above-experimented test results, an HPHT filter press carrier cell (Aging Cell, OFITE Style, 500 ML – OFI Testing Equipment, Inc., n.d.) and a ceramic disc, as illustrated in , were the laboratory materials used for creating the geometry. The pressure flow goes through the carrier cell’s inlet to the outlet. A further probe into Salehi’s Model of filtration experiment in indicates the exact measurement was considered suitable for the current computation. The current geometric models demonstrate a cylindrical pipe with excess vacuum denoted as white and a multicolored dot as the multiphase phase fluid (6.35 mm filter cake) with a porous base medium; ceramic disc with a mean pore throat of about 12 and permeability of 850mD using the new API standard (Filters ; Salehi, Madani, and Kiran Citation2016).
Figure 6. Laboratory materials for return permeability (a) Salehi’s geometry model (b) Current geometry and flow navigation (c).
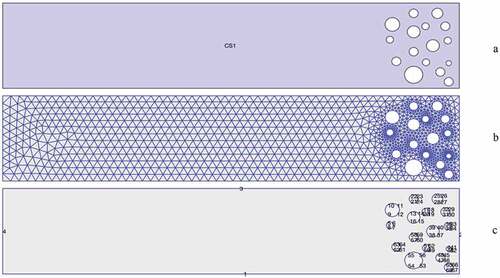
Mesh and Boundary
Multiphysics FEATool from MATLAB was used to draw out the 2-D geometry, mesh, and boundaries. A pressure of 20 psi injected into the cylinder had nitrogen gas circulated in a limited boundary. The mesh created had four outer boundaries and sixty-four interior boundaries. However, the flow was further restricted by the spherical solids-liquid particles (Hund et al. Citation2020) in the cylinder and the thickness of the filter cakes (Falahati, Chellappah, and Routh Citation2021) chemical breakers and oil. In , the inlet pressure was set at boundary four and the outlet pressure at boundary two. More so, for a smooth flow simulation, the velocity was assumed as superficial velocity, pressure and fluid density were made the main module for defining Navier-Stokes (Elman, Silvester, and Wathen Citation2014) fluid model.
Figure 7. Geometry (a), Mesh (b), Boundary (c).
Equations Summary
Mirroring the effects of flow results from cake formation and slurry invasion (Zhang et al. Citation2019) using the HPHT filter press were applied using theories from Navier-Stokes and other related equations. EquationEquation 6(6)
(6) simply refers to permeability and the probability of particles to nanoparticles colliding under specific force, the very means to determine the mechanical deposition (Rabbani and Salehi Citation2017) of particles under pressure, as illustrated in . Also, EquationEq. 9
(9)
(9) also defines the resistivity of the porous media and the filter cake thickness. The initial conditions of velocity and pressure were set to zero for the mathematical Model in Eq. 10. However, in the analysis of finite elements for this Model, fluid density, viscosity, and pressure were measured at 120 kg/m3, 97 cP, and 20 psi, respectively.
Figure 8. Probable mechanical dispersion of particles considered for simulation (Rabbani and Salehi Citation2017).
Results and Discussions
Filtration
The primary objective of defining return permeability under experimental analysis was subjected to HPHT filter press, treated filter cakes, treatments from chemical breakers; silica (Shafian et al. Citation2020) and EDTA and base oil. The experiment conducted in the previous work explains that oil under exerted force or pressure must tend to flow through the treated cakes without any impediment; indeed, there is resistance to flow, and pressure drops for this analysis (Liu et al. Citation2019) were further calculated in records of volume over time in . However, the oil filtration or oil recovery under this simulation is calculated using EquationEq. 6(6)
(6) .
Figure 9. Filtration volume over time.
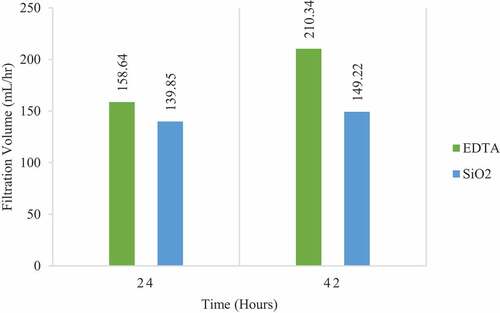
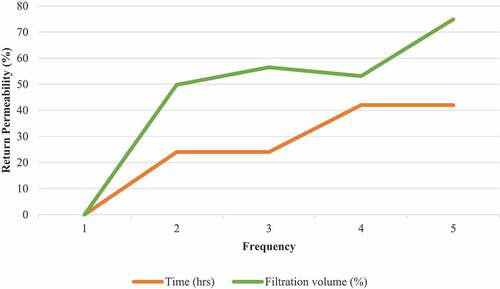
Filtration impedance (Elkatatny, Mahmoud, and Nasr-El-Din Citation2011; Fakhreldin and Sharji Citation2010; Farahani et al. Citation2014; Salehi et al. Citation2015) was noted to be under the influence of particle size; barite, nanoparticles, pore sizes of the ceramic disc, and thickness of cakes. The current Model’s consideration in EquationEq. 9(9)
(9) supports the understanding of permeability. The four treated cakes in under the experiment had undergone a filtration process for 24 hours and 42 hours of surveillance. To this effect, the filtration volume over time is shown in in percentages depicting the permeability return. More so, the experimental and analytical results were compared with Rabbani and Kabir’s Model of filtration volume; the current CFD and empirical models are for filter cakes after treatments. The correlation between the present CFD and experimental models is slight variations, whereas the present CFD is significantly below the experimental Model. This is mainly due to the uneven distribution of particles which were seen heavily packed near the surface of the ceramic disc and loosely packed on the surface of the treated filter cake. However, the analytical analysis assumes particle distribution was relatively dispersed (Kabir and Gamwo Citation2011).
Figure 10. Quantum of filtration predicting rate of permeability.
In the Model from these authors (Rabbani and Salehi Citation2017), as measured in , the CFD model concentrated on an aspect relating to mud cake deposition using filtration; this Model considered four different rock samples (Rabbani et al. Citation2016) and made use of filter press and ceramic disc. demonstrates barite particle distribution, and their results further explain why using barite for formulating drilling mud is more suitable than any other weighting material; barite under CFD analysis explains the large particle size and the loose compact nature of the weighting material. Hence, an increase in permeability (Acharya, van der Zee, and Leijnse Citation2004) is more visible in this essence. This research explains the efficacy of the present CFD simulation of barite particle simulation.
Figure 11. Filter cake thickness under comparative models.
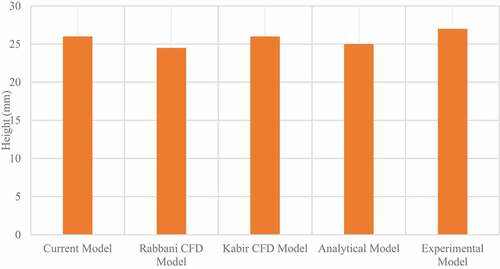
Figure 12. Barite particle distribution (a) (Rabbani and Salehi Citation2017). Filtration of barite particles in shallow and deep wells (b) (Kabir and Gamwo Citation2011).
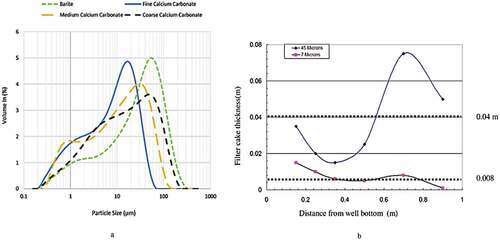
Nonetheless, Kabir’s CFD model in also expounds on the importance of understanding how filter cakes are formed in deep and shallow vertical wells. The researcher’s computer-aided design predicts a non-uniform particle dispersion in the wells; for a better description, the results show that in deep wells, the filter cake (Elkatatny, Mahmoud, and Nasr-El-Din Citation2011) thickness is greater than that of the shallow wells, high pressure and temperatures are denoted as the influencers. However, Kabir’s CFD model forcefully agrees with Rabbani’s Model, which describes that the effects of an increased thickness of filter cakes in deep wells are a result of larger particle sizes. However, barite was experimented with larger particle sizes and considered suitable for drilling fluid formulation.
Particles in Simulation
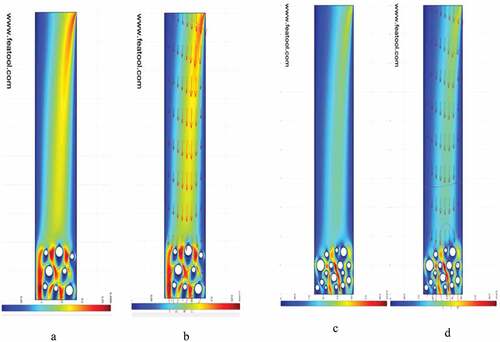
Filter cakes that were treated with EDTA chemical breakers had fewer cakes on the ceramic disc as compared to those that were treated with nano-silica (Khalil et al. Citation2020). The flow of oil under the colliding forces of particles was simulated using CFD. The dispersion of EDTA particles on the surface of the filter cake efficiently dissolved the interlocking bonds that had increased the velocity of fluids in . The pressure and velocity fields (Zitoun, Sastry, and Guezennec Citation2001) of the oil recovery in illustrate the direction of flow of nitrogen gas from the inlet valve to the bottom; the red and light green deviations foretell the maneuvering of fluids through particles and their density. The hydrodynamic effects of nanoparticles in a collision (Shafian et al. Citation2021) with weighting materials, as demonstrated in , were heavily dense, and the reaction of the flow of oil in this system was impeded by its thickness; hence a significant pressure drop is seen; this demonstration represents the effects of nano-silica treated filter cake. Moreover, from its experimented results, the average degradation of the weighting material was significantly appreciable but had more compact particles. Simulating these results in , the pressure and velocity profile indicate that the density of the particles restricted flow optimum.
Figure 13. Particle sizes in simulation to determine permeability return.
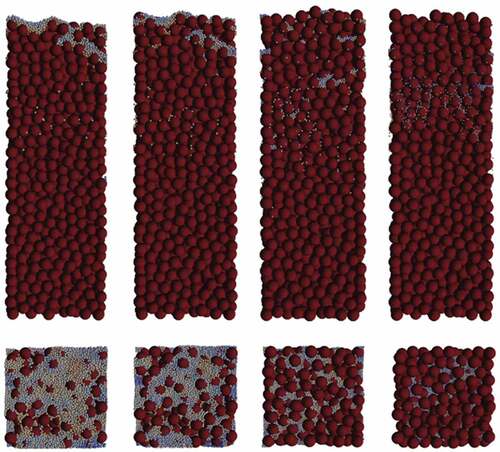
To further understand the simulation results, a fairer comparison is made with researchers who, to a greater extent, explain simulated particle migration relative to their size and behavior in porous media. Feng (Feng et al. Citation2020), on the other hand, placed granular particles in a rectangular box under free gravity fall. These particles were simulated using a discrete element method, and the suspension of these particles was observed to have migrated through a media by fluid flow whose initial velocity was set to zero in . However, what this explains in this study is that the pore throats of the ceramic disc and the migration of the particle’s advances are heavily dependent on the particle-to-particle bridging and the existence of pressure from the inlet.
Figure 14. Particle sizes and dispersion (Feng et al. Citation2020).
Discussions and Conclusions
This current study elaborates on the effects of pressure, liquid viscosity, and density to discretize particles for the enhancement of return permeability under filtration; this study was further modeled by using the Navier-Stokes equation from Multiphysics FEATool in MATLAB to validate experimental results from previous work which was used as the basis for the simulation.
Particle size distribution from barite, EDTA, and silica in showcases the nature of the particles in metric form. Nanoparticles (SiO2) are considered smaller than microparticles. Yet, the particles from EDTA (micro) containing an organic acid revealed their more significant potential for degrading the synthetic-based mud drill-in-fluid.
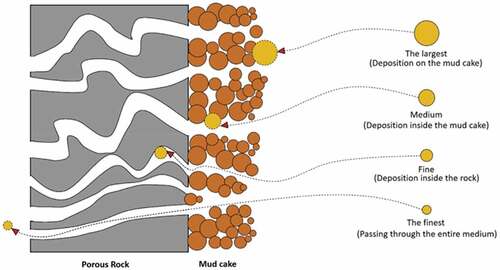
The larger the particles under surveillance, the greater the pore throats it creates in between particles, while the smaller the particles, the smaller the pore throats. Simulating , the composition of the particles were barites and EDTA, which defines the experimental results from the previous studies, and explains why the EDTA was seen to have the highest return permeability value.
Silica, on the other hand, had closed up the gaps (pore throats in between particles and the ceramic disc), allowing fluid passage difficult to penetrate. This under simulation in shows how compacted particles are distributed, and return permeability for this simulation is not remarkably achieved, validating the previous experimental work.
It is empirical to note that the density and viscosity of the treated filter cakes under an established constant pressure showed a high-volume flow rate under EDTA treated filter cakes and a low-volume flow rate under nano-silica treated filter cakes over a predetermined period. It also explains that, at the same pressure, the solid particle lose-packed of the treated filter cakes started to expand, leading to particle-to-particle collisions.
At a longer duration, the excretion of fluid through the tiny pores axially flowed through the ceramic disc into the graduated cylinder. Filtration under EDTA was better off than nano-silica; by this analysis, the return permeability from this perspective validates the experimental results from the previous work (Wayo Citation2022).
The Matlab-CFD analysis validates the experimental work done in the previous study. Pressure, viscosity, density, and particle distributions are in force agreeable to the simulation analysis conducted.
Chemical breakers’ interactions with the BSBMDIF reveal the industry’s propensity to use EDTA and SiO2 in environmentally acceptable ways.
Acronyms and Nomenclature
Latin letters
| CFD | = | Computational Fluid Dynamic |
| EDTA | = | Ethylenediaminetetraacetic Acid |
| BSBMDIF | = | Biodegradable Synthetic-Based Mud Drill-in-Fluid |
| FEA | = | Finite Element Analysis |
| SiO2 | = | Silica Nanoparticles |
| HPHT | = | High-pressure High-temperature |
| = | Volume flow rate, m/s | |
| = | Effective permeability tensor, m2 | |
| = | Pressure, Pa | |
| g | = | Gravity, ms−2 |
| z | = | Height, mm |
| S | = | Fluid saturation |
| = | Capillary pressure, Pa | |
| = | Irreducible wetting saturation | |
| = | Relative permeability of the wetting fluid | |
| = | Relative permeability of the non-wetting fluid | |
| = | Pressure drops, Pa | |
| = | Resistance of the filter cake | |
| = | Filter medium | |
| = | Velocity of flow, m/s | |
| = | Filter medium resistance | |
| = | Interference resistance | |
| = | Filtration volume | |
| t | = | Time of filtration, s |
| = | Filtration constant | |
| = | Filter cake resistance | |
| A | = | Filtration area, mm2 |
Greek letters
| = | Viscosity of the liquid, Pa s | |
| = | Porosity of the medium | |
| = | Fluid density, kgm−3 | |
| = | Fluid potential, Pa | |
| = | Distribution of pore size |
Authorship Contribution
Dennis Delali Kwesi Wayo and Sonny Irawan designed the experimental work and generated the data. Dennis Delali Kwesi Wayo computed the simulation flow and wrote the manuscript. The methods and results of the manuscripts were reviewed by Sonny Irawan, Javed Akbar Khan and Fitrianti.
Data Availability
The primary data that supports the findings of this study are openly available in [Nazarbayev University Repository] at [http://nur.nu.edu.kz/handle/123456789/6132], and others are duly referenced.
Acknowledgments
We are thankful to Nazarbayev University for the opportunity given us to further share our piece of work under the competitive grant in the School of Mining and Geosciences. Notwithstanding, we passionately acknowledge all authors cited in this piece of work; we are most grateful for their extensive research work that supports knowledge transfer.
Disclosure Statement
We hereby state that no known competing financial interests or personal ties could have influenced the research presented in this study.
Additional information
Funding
References
- Acharya, R. C., S. E. A. T. M. van der Zee, and A. Leijnse. 2004. Porosity–permeability properties generated with a new 2-parameter 3D hydraulic pore-network model for consolidated and unconsolidated porous media. Advances in Water Resources 27 (7):707–3099. doi:10.1016/J.ADVWATRES.2004.05.002.
- Aging Cell, OFITE Style, 500 mL - OFI Testing Equipment, Inc. (n.d.). Retrieved May 10, 2022, from https://www.ofite.com/products/drilling-fluids/product/2393-aging-cell-ofite-style-500-ml
- Ahmadabadi, E. F., M. Haghshenasfard, and M. N. Esfahany. 2020. CFD simulation and experimental validation of nanoparticles fluidization in a conical spouted bed. Chemical Engineering Research & Design 160:476–85. doi:10.1016/j.cherd.2020.06.018.
- Al-Ibrahim, H., T. Al Mubarak, M. Almubarak, P. Osode, M. Bataweel, and A. Al-Yami (2015). Chelating agent for uniform filter cake removal in horizontal and multilateral wells: Laboratory analysis and formation damage diagnosis. Society of Petroleum Engineers - SPE Saudi Arabia Section Annual Technical Symposium and Exhibition Al-Khobar, Saudi Arabia. 10.2118/177982-ms
- Amanullah, M., and A. M. Al-Tahini (2009). Nano-technology- its significance in smart fluid development for oil and gas field application. Society of Petroleum Engineers - SPE Saudi Arabia Section Technical Symposium 2009 AlKhobar, Saudi Arabia. 10.2118/126102-ms
- Baba Hamed, S., and M. Belhadri. 2009. Rheological properties of biopolymers drilling fluids. Journal of Petroleum Science and Engineering 67 (3–4):84–90. doi:10.1016/J.PETROL.2009.04.001.
- Bageri, B. S., A. R. Adebayo, A. Barri, J. Al Jaberi, S. Patil, S. R. Hussaini, and R. S. Babu. 2019. Evaluation of secondary formation damage caused by the interaction of chelated barite with formation rocks during filter cake removal. Journal of Petroleum Science and Engineering 183 (August):106395. doi:10.1016/j.petrol.2019.106395.
- Bageri, B. S., M. Mahmoud, A. Abdulraheem, S. H. Al-Mutairi, S. M. Elkatatny, and R. A. Shawabkeh. 2017 December. Single stage filter cake removal of barite weighted water based drilling fluid. Journal of Petroleum Science and Engineering 149(2015):476–84. doi:10.1016/j.petrol.2016.10.059.
- Candler, J. E., J. H. Rushing, A. J. J. Leuterman, and M. D. F. Co. 1993. Synthetic-based mud systems offer environmental benefits over traditional mud systems this paper addresses critical issues concerning the. Society of Petroleum Engineers SPE 25993 SPE 25993.
- Chengara, A., A. D. Nikolov, D. T. Wasan, A. Trokhymchuk, and D. Henderson. 2004. Spreading of nanofluids driven by the structural disjoining pressure gradient. Journal of Colloid and Interface Science 280 (1):192–201. doi:10.1016/J.JCIS.2004.07.005.
- Chilingar, G. V., and P. Vorabutr. 1981. Drilling and drilling fluids Developments in petroleum science 11 . .
- Cundall, P. A., and O. D. L. Strack. 1979. A discrete numerical model for granular assemblies. Geotechnique 29 (1):47–65. doi:10.1680/GEOT.1979.29.1.47.
- Deshpande, R., S. Antonyuk, and O. Iliev. 2020. DEM-CFD study of the filter cake formation process due to non-spherical particles. Particuology 53:48–57. doi:10.1016/j.partic.2020.01.003.
- Elkatatny, S. M., M. A. Mahmoud, and H. A. Nasr-El-Din (2011). A new technique to characterize drilling fluid filter cake. Society of Petroleum Engineers - 9th European Formation Damage Conference 2011 Noordwijk, The Netherlands, 2, 879–92. 10.2118/144098-ms
- Elman, H. C., D. J. Silvester, and A. J. Wathen. 2014. The Navier–Stokes Equations. Finite Elements and Fast Iterative Solvers 333–58. doi:10.1093/acprof:oso/9780199678792.003.0009.
- Fakhreldin, Y., and H. Sharji (2010). Novel fluid formulations to remove mud filter-cake without affecting rock mineralogy. SPE Production and Operations Symposium, Proceedings Tunis, Tunisia, 538–59. 10.2118/136093-ms
- Falahati, N., K. Chellappah, and A. F. Routh. 2021. Assessing filter cake strength via discrete element method simulations. Chemical Engineering Research & Design 173 (2020):215–23. doi:10.1016/j.cherd.2021.07.016.
- Farahani, M. V., R. Soleimani, S. Jamshidi, and S. Salehi (2014). Development of a dynamic model for drilling fluid’s filtration: Implications to prevent formation damage. SPE - European Formation Damage Conference, Proceedings, EFDC Lafayette, Louisiana, USA, 1, 396–411. 10.2118/168151-ms
- Feng, Q., L. Cha, C. Dai, G. Zhao, and S. Wang. 2020. Effect of particle size and concentration on the migration behavior in porous media by coupling computational fluid dynamics and discrete element method. Powder Technology 360:704–14. doi:10.1016/j.powtec.2019.10.011.
- Fink, J. 2021. Filter cake removal. Petroleum Engineer’s Guide to Oil Field Chemicals and Fluids 419–39. doi:10.1016/b978-0-323-85438-2.00009-8.
- Fisher, K. A., R. J. Wakeman, T. W. Chiu, and O. F. J. Meuric. 2000. Numerical modelling of cake formation and fluid loss from non-Newtonian muds during drilling using eccentric/concentric drill strings with/without rotation. Chemical Engineering Research & Design 78 (5):707–14. doi:10.1205/026387600527888.
- Fred Fu, L., and B. A. Dempsey. 1998. Modeling the effect of particle size and charge on the structure of the filter cake in ultrafiltration. Journal of Membrane Science 149 (2):221–40. doi:10.1016/S0376-7388(98)00169-0.
- Guo, Y., and J. S. Curtis. 2015. Discrete element method simulations for complex granular flows Annual Review of Fluid Mechanics . 47:21–46. doi:10.1146/ANNUREV-FLUID-010814-014644.
- Hund, D., P. Lösch, M. Kerner, S. Ripperger, and S. Antonyuk. 2020. CFD-DEM study of bridging mechanisms at the static solid-liquid surface filtration. Powder Technology 361:600–09. doi:10.1016/j.powtec.2019.11.072.
- Hussain, Q. E., and M. A. R. Sharif. 2000. Numerical modeling of helical flow of viscoplastic fluids in eccentric annuli. AIChE Journal 46 (10):1937–46. doi:10.1002/AIC.690461006.
- Irawan, S., S. Khaleeda, M. Shakeel, and M. Taufiq Fathaddin. 2022. Maximizing well productivity by using filter cake breaker for synthetic-based mud drill-in fluid (SBMDIF) system. Upstream Oil and Gas Technology 9 (August 2021):100075. doi:10.1016/j.upstre.2022.100075.
- Jahari, A. F., S. R. M. Shafian, H. Husin, N. Razali, and S. Irawan. 2021. Quantification method of suspended solids in micromodel using image analysis. Journal of Petroleum Exploration and Production 11 (5):2271–86. doi:10.1007/s13202-021-01153-x.
- Kabir, M. A., and I. K. Gamwo. 2011. Filter cake formation on the vertical well at high temperature and high pressure: Computational fluid dynamics modeling and simulations. Journal of Petroleum and Gas Engineering 2 (7):146–64. doi:10.5897/JPGE11.026.
- Khalil, M., A. Amanda, R. T. Yunarti, B. M. Jan, and S. Irawan. 2020. Synthesis and application of mesoporous silica nanoparticles as gas migration control additive in oil and gas cement. Journal of Petroleum Science and Engineering 195 (July):107660. doi:10.1016/j.petrol.2020.107660.
- Khan, M. K. A., J. A. Khan, H. Ullah, H. H. Al-Kayiem, S. Irawan, M. Irfan, A. Glowacz, H. Liu, W. Glowacz, and S. Rahman. 2021. De-emulsification and gravity separation of micro-emulsion produced with enhanced oil recovery chemicals flooding. Energies 14 (8):1–14. doi:10.3390/en14082249.
- Khodja, M., H. Debih, H. Lebtahi, and M. B. Amish. 2022. New HTHP fluid loss control agent for oil-based drilling fluid from pharmaceutical waste. Cleaner Engineering and Technology 8 (March 2021):100476. doi:10.1016/j.clet.2022.100476.
- Liu, K., Y. Zhao, L. Jia, R. Hao, and D. Fu. 2019. A novel CFD-based method for predicting pressure drop and dust cake distribution of ceramic filter during filtration process at macro-scale. Powder Technology 353:27–40. doi:10.1016/j.powtec.2019.05.014.
- Mahmoud, H., A. Hamza, M. S. Nasser, I. A. Hussein, R. Ahmed, and H. Karami. 2020 September. Hole cleaning and drilling fluid sweeps in horizontal and deviated wells: Comprehensive review. Journal of Petroleum Science and Engineering 186(2019):106748. doi:10.1016/j.petrol.2019.106748.
- Mcelfresh, P., C. Olguin, and D. Ector (2012). The application of nanoparticle dispersions to remove paraffin and polymer filter cake damage. Proceedings - SPE International Symposium on Formation Damage Control Lafayette, Louisiana, USA, 2, 1035–41. 10.2118/151848-ms
- Medhi, S., S. Chowdhury, N. Bhatt, D. K. Gupta, S. Rana, and J. S. Sangwai. 2021. Analysis of high performing graphene oxide nanosheets based non-damaging drilling fluids through rheological measurements and CFD studies. Powder Technology 377:379–95. doi:10.1016/j.powtec.2020.08.053.
- Mohammadpour, J., S. Husain, F. Salehi, and A. Lee. 2022. Machine learning regression-CFD models for the nanofluid heat transfer of a microchannel heat sink with double synthetic jets. International Communications in Heat and Mass Transfer 130:105808. doi:10.1016/j.icheatmasstransfer.2021.105808.
- Ofei, T. N., B. Lund, and A. Saasen. 2021. Effect of particle number density on rheological properties and barite sag in oil-based drilling fluids. Journal of Petroleum Science and Engineering 206 (January):108908. doi:10.1016/j.petrol.2021.108908.
- Ozofor, I. H., V. V. Tarabara, A. R. da Costa, and A. N. Morse. 2021. Analysis of microstructural properties of ultrafiltration cake layer during its early stage formation and growth. Journal of Membrane Science 620 (July 2020):118903. doi:10.1016/j.memsci.2020.118903.
- Parn-anurak, S., and T. W. Engler. 2005. Modeling of fluid filtration and near-wellbore damage along a horizontal well. Journal of Petroleum Science and Engineering 46 (3):149–60. doi:10.1016/J.PETROL.2004.12.003.
- Picabea, J., M. Maestri, M. Cassanello, G. Salierno, C. de Blasio, M. A. Cardona, D. Hojman, and H. Somacal. 2022. Validation of CFD-DEM simulation of a liquid–solid fluidized bed by dynamic analysis of time series. Particuology 68:75–87. doi:10.1016/j.partic.2021.11.003.
- Puderbach, V., K. Schmidt, and S. Antonyuk. 2021. A coupled CFD-DEM model for resolved simulation of filter cake formation during solid-liquid separation. Processes 9 (5):826. doi:10.3390/pr9050826.
- Puhan, P., A. Awasthi, A. K. Mukherjee, and A. Atta. 2021. CFD modeling of segregation in binary solid-liquid fluidized beds: Influence of liquid viscosity and density. Chemical Engineering Science 246:116965. doi:10.1016/j.ces.2021.116965.
- Rabbani, A., S. Ayatollahi, R. Kharrat, and N. Dashti. 2016. Estimation of 3-D pore network coordination number of rocks from watershed segmentation of a single 2-D image. Advances in Water Resources 94:264–77. doi:10.1016/j.advwatres.2016.05.020.
- Rabbani, A., and S. Salehi. 2017. Dynamic modeling of the formation damage and mud cake deposition using filtration theories coupled with SEM image processing. Journal of Natural Gas Science and Engineering 42:157–68. doi:10.1016/j.jngse.2017.02.047.
- Ramadan, A. M., Shehadeh, M. F., Shehata, A. I., Mehanna, A. 2021. Filter Cake Formation on Deep Vertical Well Under High Pressure and Temperature Conditions Computational Fluid Dynamics Modeling and Simulations 16 (Research India Publications) . April.
- Salehi, S., A. Ghalambor, F. K. Saleh, H. Jabbari, and S. Hussmann (2015). Study of filtrate and mud cake characterization in HPHT: Implications for formation damage control. SPE - European Formation Damage Conference, Proceedings, EFDC, 2015-Janua Budapest, Hungary, 1241–49. 10.2118/174273-ms
- Salehi, S., S. A. Madani, and R. Kiran. 2016. Characterization of drilling fluids filtration through integrated laboratory experiments and CFD modeling. Journal of Natural Gas Science and Engineering 29:462–68. doi:10.1016/j.jngse.2016.01.017.
- Sauki, A., P. N. F. M. Khamaruddin, S. Irawan, I. Kinif, and S. Ridha. 2020. Statistical relationship of drilled solid concentration on drilling mud rheology. Journal of Advanced Research in Fluid Mechanics and Thermal Sciences 69 (1):122–36. doi:10.37934/ARFMTS.69.1.122136.
- Shafian, S. R. M., N. Razali, S. Irawan, A. F. Jahari, I. K. Salleh, and J. M. M. Ibrahim. 2020. Controlling fines migration by enhancing fines attachment using nanosilica. International Journal of Advanced Science and Technology 29 (1):318–31.
- Shafian, S. R. M., I. M. Saaid, N. Razali, I. K. Salleh, and S. Irawan. 2021. Experimental investigation of colloidal silica nanoparticles (C-SNPs) for fines migration control application. Applied Nanoscience (Switzerland) 11 (7):1993–2008. doi:10.1007/S13204-021-01894-5.
- Shaughnessy, C. M., and W. E. Kline. 1983. EDTA removes formation damage at Prudhoe Bay. Journal of Petroleum Technology 35 (10):1783–91. doi:10.2118/11188-PA.
- Shojaei, N., and M. H. Ghazanfari. 2022. Reduction of formation damage in horizontal wellbores by application of nano-enhanced drilling fluids: Experimental and modeling study. Journal of Petroleum Science and Engineering 210 (December 2021):110075. doi:10.1016/j.petrol.2021.110075.
- Siddig, O., A. A. Mahmoud, and S. Elkatatny. 2020. A review of different approaches for water-based drilling fluid filter cake removal. Journal of Petroleum Science and Engineering 192 (December 2019):107346. doi:10.1016/j.petrol.2020.107346.
- Sören, S., and T. Jürgen. 2012. Simulation of a Filtration Process by DEM and CFD. International Journal of Mechanical Engineering and Mechatronics 1 (1). doi: 10.11159/ijmem.2012.004.
- Tariq, Z., M. S. Kamal, M. Mahmoud, O. Alade, and A. Al-Nakhli. 2021. Self-destructive barite filter cake in water-based and oil-based drilling fluids. Journal of Petroleum Science and Engineering 197 (June 2020):107963. doi:10.1016/j.petrol.2020.107963.
- Tran, M. H., Y. N. Abousleiman, and V. X. Nguyen (2010). The effects of low-permeability mudcake on time-dependent wellbore failure analyses. Society of Petroleum Engineers - IADC/SPE Asia Pacific Drilling Technology Conference Ho Chi Minh City, Vietnam 2010, 499–513. 10.2118/135893-ms
- Wakeman, R. 2007. The influence of particle properties on filtration. Separation and Purification Technology 58 (2):234–41. doi:10.1016/J.SEPPUR.2007.03.018.
- Wayo, D. D. K. (2022). Primary evaluation of filter cake breaker in biodegradable synthetic-based drill-in-fluid (Issue April). MSc Thesis, Nazarbayev University. http://nur.nu.edu.kz/handle/123456789/6132
- Yao, R., G. Jiang, W. Li, T. Deng, and H. Zhang. 2014. Effect of water-based drilling fluid components on filter cake structure. Powder Technology 262:51–61. doi:10.1016/J.POWTEC.2014.04.060.
- Zhang, Z., T. Yin, X. Huang, and D. Dias. 2019. Slurry filtration process and filter cake formation during shield tunnelling: Insight from coupled CFD-DEM simulations of slurry filtration column test. Tunnelling and Underground Space Technology 87 (February):64–77. doi:10.1016/j.tust.2019.02.001.
- Zitoun, K. B., S. K. Sastry, and Y. Guezennec. 2001. Investigation of three dimensional interstitial velocity, solids motion, and orientation in solid-liquid flow using particle tracking velocimetry. International Journal of Multiphase Flow 27 (8):1397–414. doi:10.1016/S0301-9322(01)00011-8.