
 ?Mathematical formulae have been encoded as MathML and are displayed in this HTML version using MathJax in order to improve their display. Uncheck the box to turn MathJax off. This feature requires Javascript. Click on a formula to zoom.
ABSTRACT
In medical field, accurate decisions are very important as they risk human lives. decision support system (DSS) plays important role in making accurate decisions and used for classification/prediction. In gene expression analysis, genes are not only inflated by the external environmental conditions but also the expression values of certain genes are affected (like cancer, obesity etc). in this study, various traditional (Support Vector Machine, Decision Trees, and Linear Discriminant Analysis, naïve Bayes, logistic regression, and multilayer perceptron) and proposed methods (combination of traditional with ensemble and probabilistic classifiers) are used in order to perform the classification and prediction analysis. In this study we used the publicly available datasets comprised of Lymphoid, Leukemia and Colon Cancer. The classification performance on Colon dataset with traditional methods was obtained with accuracy (56%) and proposed probabilistic ensemble methods with accuracy (88%). For dataset, Leukemia, the accuracy was obtained using traditional methods (78%) and proposed methods (92%). Similarly, on Lymphoid dataset, the traditional methods yielded accuracy (75%) and proposed methods (87%). The results revealed that proposed methods yielded the improved detection performance. The proposed methods can be used as a better predictor for early diagnosis and improved diagnosis to improve the healthcare systems.
Introduction
A Decision Support System (DSS) is developed in order to gather critical information from raw data (e.g., medical documents) which as a result helps in solving clinical decisions in an objective, accurate, rational, and fast way (Bates et al. Citation2001). An accurate DSS helps in reducing cost, improves safety of patients, makes the selection of medical treatment easy, improves defensive care, and reduces errors (Kotsiantis, Zaharakis, and Pintelas Citation2007). A highly accurate DSS is of main concern in different fields of sciences such as healthcare, engineering, bio-informatics, and other disciplines (Yu et al. Citation2007).
Generally, a DSS depends on data about the problem to be addressed and on a mechanism to extract information from data (algorithm for example). In healthcare, we may have two major types of data. First: clinical data (e.g., results of medical diagnostic tests) and second: gene expression profile.
Genes contain proteins and play an important role in the daily life of humans by involving in biochemical processes (Hanczar and Dougherty Citation2008). Gene expressions represent the changes in thousands of genes (Man et al. Citation2004; Zhou and Mao Citation2005). Genes are affected by different environmental factors both internal to body (diseased for example) and external factors (e.g., habitual changes). Therefore, analyses of gene expressions may reveal useful information about different diseases and may be helpful to suggest appropriate medicines or treatments and also for prediction of the survival time of patient (Golub et al. Citation1999). Several non-probabilistic machine learning methods have been proposed, including Diagonal Linear Discriminate Analysis- DLDA (Park and Park Citation2005), k-Nearest Neighbors-kNN (Cover et al., Cover and Hart Citation1967), Support Vector Machine-SVM (Vapnik Citation1999), and Random Forests-RF (Breiman Citation2001), which are generally used for microarray classification and prediction.
The major issue in case of gene expression microarray is that the number of samples remains very few remarkably in case of the experiments where human genome is involved (Veer et al. Citation2002). This disparity can be tackled using machine learning techniques such as boosting (Wiering and van Citation2007).
Traditional boosting methods work by finding many weak and inaccurate “rules of thumb” to create a more accurate classifier based on voting. The traditional boosting method utilize exponential and logarithmic functions to compute weights and classification accuracy which increases the running time of the boosting, and it does not take marginal accuracy (the accuracy with which classifier classifies the samples which are misclassified by the previous weak rule of thumb) to its account. In this paper, we proposed a robust probabilistic boosting algorithm which utilizes the posterior probability to compute the weights for each sample. Probabilistic boosting is efficient in classification and gives more accurate predictions/classification than the traditional boosting and simple classification methods.
Boosting to Improve Classification
Boosting is a machine learning technique based on the idea of creating a more accurate predictor by combining many weak and inaccurate “rules of thumb” (Bartlett et al. Citation1998). To make the boosting approach workable, the method has to focus on the samples which are difficult to predict/classify and to increase the weights of these samples in such a way that these misclassified samples would be included in the next iteration to make them predictable. Finally, the predictions about unseen samples are made by aggregating the predictions of all the weak rules based on their accuracy with a hope that the aggregate is better than using a single prediction rule. A remarkable rich theory has evolved around boosting, with connections to a range of topics, including statistics, game theory, convex optimization, information geometry, and medicine (Breiman Citation2001). Performance of a classifier can be measured through the accuracy with which it predicts the class of a given sample. But in some complex experiments, classification and prediction problems based on microarray data do not provide desired accuracy. In such cases, researchers and experts search for different techniques to improve the classification accuracy of a classifier. Boosting is one of the methods as discussed above that is also used to improve the accuracy of DSS’s. In this paper, probability-based boosting method is proposed for improving the accuracy for classification/prediction.
The effectiveness of probabilistic approach in boosting and its usefulness using reject option is explored in this study. Literature regarding cancer classification involves the traditional machine learning algorithms or deep learning methods, but the use of these methods with boosting techniques is missing. Therefore, the effects of boosting methods in the field of cancer classification need to be explored. Furthermore, the concept of rejection window, which focuses on the samples lies on the edges of separator, is also used to predict the sample accuracy more effectively.
There are methods in which the classification performed using traditional methods and the samples which lies near to the boundary line/separation line might be misclassified in either side where it is not belonged to, then it would be drastic for that sample to consider it in a class from where it is not to be. Therefore, the proposed method in combination with a reject option is used to classify/predict the samples more accurately than existing methods by creating a rejection region.
Proposed Methodology
Machine learning offers automatic techniques to make predictions based on past observations. Boosting works with finding many rules of thumb using subset of the training examples by sampling repeatedly from the available distribution. In each iteration a new rule is generated using the subset of training examples. To make this approach workable, we focused on the hardest samples (misclassified samples during each iteration). The weights of such samples were increased in a way that enables it to be predictable in the next iteration. Finally, we predicted the new unlabeled samples by aggregating the predictions of all weak rules based on voting with the hope that aggregated prediction is much better than using a single prediction rule. The simulation plan for probabilistic boosting method is shown in .
Figure 1. Probabilistic Boosting Method.
Algorithm 1:
Traditional Adaboost Algorithm
Boosting works as follows (Freund and Schapire Citation1997)
1. Initialize
2. Do for m = 1 to M
Fit a weak base classifier let
using the current weights and the distribution
Compute:
Compute:
3. Output:
Algorithm 2:
Proposed Probabilistic Boosting Method
Input where
1. Divide the dataset in to two subset that is the
2. Make a classification/prediction rule
3. Initialize
4. Do
Fit a classifier using sampling with replacement using current weights and distribution
Predict the
Compute
Compute
i. Wrong_Predictions=
ii. Predict Wrong_Predictions using Current
iii.
(e) Update Weights
i.
ii.
iii.
iv.
v.
vi.
vii.
5. Output: (
Probabilistic boosting method performs classification by utilizing the posterior probability which is returned by any base classifier. The method starts by assigning the equal weights to all the training examples and then sampling with replacement is performed using the current weights on the training distribution to get the subset of the training data and then using this training data a weak rule of thumb is generated using any base classifier, e.g., SVM, DTs. The posterior probabilities returned by the weak base classifier is used to update the weights.. For example consider two classes {t, n}, if the predictions of the weak classifier is {t, t, n, n} but originally they are {t, n, n, t}; here there are two misclassifications, but as the base learner predicts that second example should be labeled as “t,” it means that the posterior probability of getting “t” is higher than getting “n” and also in the fourth training example the posterior probability of getting “n” is higher than getting “t.”
The weights should be updated in a manner that the weight of the second training example be the posterior probability of “t” and the weight of the fourth training example be the posterior probability of “n.” By repeating the same procedure above in each iteration weights of examples which are misclassified increase dramatically, but the weights of the correct training examples remain the same or decrease. Thus, in the next iteration when the new subset is taken from the training examples with sampling using the updated weights, the training examples which are misclassified included in the subset of training set from which the new weak classifier is built and again the same procedure is repeated as described above to update the weights. While the weights are being calculated the classification accuracy of the current weak learner that how much it accurately classifies the data is acquired and also the marginal accuracy by which we determine how much it accurately classifies the training examples that are misclassified by the previous weak learner. So, by using these weak learners and the marginal accuracy of these weak learners, we predicted the unlabeled examples such that any weak classifier’s accuracy is the different percentage of classifier total accuracy and marginal accuracy, e.g., 70% totally accurate and 30% marginally accurate, so by using these calculations the results of different weak classifiers are aggregated using voting to predict the unlabeled training examples.
Training/Testing Data Formulation
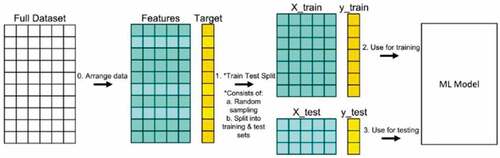
The dataset splits into two pieces: a training set and a testing set. This consists of random sampling without replacement about 75% of the rows (you can vary this) and putting them into your training set. The remaining 25% is put into your test set as reflected in .
Figure 2. Data Split Methodology.
Results and Discussions
In this section, we present results by applying our probabilistic boosting method on different data sets and compute the classification accuracy using different classification algorithm as a base learner. In the last section, we present the discussion based on our results.
Analysis of Proposed Boosting Method Using Colon Cancer Data
In this analysis, we used Colon cancer dataset (Alon et al., Citation1999), which contains the genetic profiles of 39 patients with a colon cancer and 23 non-affected patients. For analysis, we split our dataset into train and test sets in such a way that the test set is independent of the train set as mentioned above.
shows the classification accuracy of our probabilistic boosting method with the traditional method using tree as a base classifier and simple tree classifier. On the x-axis, we have different classifiers, and on the y-axis, we have accuracy. The above figure shows that the proposed boosting method outperforms than all the other methods in terms of accuracy. On the same dataset, the traditional classifier performs classification and gets the accuracy of about 56%, the simple tree method gets the classification accuracy of about 63%, and our proposed probabilistic boosting method gets the accuracy of about 88%. All these statistics show that our probabilistic boosting method outperforms than the traditional and simple classification method using tree classifier as a base learner.
Figure 3. Comparison of Classification Accuracy of Proposed Method with traditional method and simple Tree base classifier using Colon Cancer Data.
Analysis of Proposed, Traditional Boosting Method, Simple Tree Classifier Using Leukemia Data
In this experiment, we used Gene expression microarray data of leukemia (Golub et al. Citation1999). The dataset contains the expression of 7129 genes common to all 72 subjects (47 subjects with acute lymphoblastic leukemia (ALL) and 25 subjects of acute myeloid leukemia (AML)) of the study. Here, we have to distinguish between acute myeloid leukemia (AML) and acute lymphoblastic leukemia (ALL).
For this purpose, we randomly split our dataset in to two subsets such as train set and test set in such a way that 75% of the data set is randomly chosen as a train set and 25% of the dataset is chosen as the test set and also test set is independent of train set. Next, we performed probabilistic boosting method on the train set and acquired all the weak classifiers with their accuracy along with marginal accuracy. In this analysis, we compared our probabilistic boosting method using tree classifier as base learner, traditional boosting method with tree as a base learner, and simple tree classifier without boosting. Results show that our probabilistic boosting method outperforms the other methods.
shows the classification accuracy of our probabilistic boosting method with the traditional boosting method and simple tree classifier. On the x-axis, we have different classifiers and on the y-axis, we have accuracy. We used tree classifier as a base learner in both of our probabilistic boosting method and traditional method. The above figure shows that the proposed method outperforms than all the other methods in terms of accuracy. On the same dataset, the traditional classifier performs classification and gets the accuracy of about 78%, the simple tree method gets the classification accuracy of about 90%, whereas our proposed probabilistic boosting method gets the accuracy of about 92%. All these statistics show that our probabilistic boosting method outperforms the traditional and simple classification method with tree classifier as a base learner.
Figure 4. Comparison of Classification Accuracy of Proposed Method with traditional method and simple Tree base classifier using Leukemia Data.
Analysis of Proposed Boosting Method Using Lymphoid Cancer Data with SVM as a Base Learner
In this analysis, the gene expression microarray data of lymphoid cancer (Shipp et al. Citation2002) is used. This dataset contains data about the patients of diffuse large B-cell lymphoma (DLBCL) and follicular lymphoma (FL) patients. The dataset contains information for 58 DLBCL patients and 19 FL patients. For analysis, we split our dataset into train and test sets in such a way that the test set is independent of the train set as mentioned above.
shows the classification accuracy of our probabilistic boosting method with the traditional method using SVM as a base classifier and simple SVM classifier. On the x-axis, we have different classifiers and on the y-axis, we have accuracy. The above figure shows that the proposed method outperforms than all the other methods in terms of accuracy. On the same dataset, the traditional classifier performs classification and gets the accuracy of about 75%, the simple SVM method gets the classification accuracy of about 71%, and our proposed probabilistic boosting method gets the accuracy of about 87.5%. All these statistics show that our probabilistic boosting method outperforms the traditional and simple classification method with tree base classifier.
Figure 5. Comparison of Classification Accuracy of Proposed Method with traditional method using SVM as a base Classifier and simple SVM base classifier using lymphoid cancer Data.
Analysis of Proposed, Traditional Boosting Method, Simple Tree Classifier Using Lymphoid Cancer Data
shows the classification accuracy of our probabilistic boosting method with the traditional method using tree as a base classifier and simple tree classifier. On the x-axis, we have different classifiers, and on the y-axis, we have accuracy. The above figure shows that using our proposed boosting method outperforms all the other methods in terms of accuracy. On the same dataset the traditional classifier performs classification and gets the accuracy of about 62%, the simple tree method gets the classification accuracy of about 64%, and our proposed probabilistic boosting method gets the accuracy of about 68%. All these statistics show that our probabilistic boosting method outperforms the traditional and simple classification method with tree classifier as a base learner.
Figure 6. Comparison of Classification Accuracy of Proposed Method with traditional method using SVM as a base classifier and simple SVM base classifier using lymphoid cancer data.
Analysis of Proposed Method, Traditional and Simple Tree Method Using Leukemia Data with Accuracy Rejection Curves
In this analysis we compare our proposed method with the traditional method and simple tree classifier using Accuracy Rejection Curves.
shows the accuracy rejection curves of proposed probabilistic boosting method, traditional boosting method using tree classifier as a base learner and simple tree classifier. On the x-axis, we have rejection rate, and on the y-axis, we have accuracy. While using our proposed method at only the rejection rate of zero percent, we obtained the accuracy of about 88%, at the rejection rate of 30%, we got an accuracy of about 90%, and so on. Using traditional methods, at the rejection rate of zero percent, we got the accuracy of 63%, at the rejection rate of 30%, we got the accuracy of about 72%, and at the rejection rate of 70%, we obtained the accuracy of about 86%. Using simple tree classifier at the rejection rate of zero percent, we got the accuracy of about 68%, at the rejection rate of 30%, we got the accuracy of about 76%, at the rejection rate of 88%, we got the accuracy of about 85%.
Figure 7. Analysis of proposed method with other methods using Leukemia Data.
Analysis of Proposed Method and Simple Svm Classifier with Accuracy Rejection Curves
In this analysis we compare our proposed method using Svm as a base classifier and simple Svm using ARC’s. Our results are summarized below.
shows the accuracy rejection curves of the proposed probabilistic boosting method, traditional boosting method using SVM classifier as a base learner, and traditional boosting method using SVM as a base learner. On the x-axis, we have rejection rate, and on the y-axis, we have accuracy. While using our proposed method at only the rejection rate of zero percent, we got the accuracy of about 92%, at the rejection rate of 20%, we got the accuracy of about 98%, and so on. Using traditional simple SVM method at the rejection rate of zero percent, we got the accuracy of 77%, at the rejection rate of 20%, we got the accuracy of about 91%, and at the rejection rate of 70%, we got the accuracy of about 72%. All the above statistics show that our probabilistic boosting method outperformed than the traditional method by giving higher accuracy at a very low rejection rate
Figure 8. Analysis of proposed method with other methods using colon cancer data.
Conclusion
In this study, we have introduced the concept of probabilistic boosting method for classification and prediction. We also have compared our proposed boosting method with the traditional boosting method and simple classification methods in a large number of experiments based on publicly available different types of cancer data. Our result shows that incorporating the probabilistic approach in boosting makes the classifier robust and makes it more reliable and accurate.
The traditional boosting method incorporates the logarithmic and exponential functions to calculate different measures such as calculating weights which make the classification algorithm slow. Our proposed probabilistic boosting method utilizes the posterior probability returned by every weak classifier for updating weights and also increases the accuracy. In this study, we also investigated the use of reject option for correctly classifying the target class. We found experimentally that our probabilistic boosting method is beneficial in the following ways:
For the classification problem, it gives higher accuracy than other traditional classification methods.
Upon using the reject option, the accuracy of the classifier gets improved by rejecting those samples having probability insufficiently high or insufficiently low.
Upon using different datasets above, we concluded that our proposed boosting method gives higher accuracy than all the other methods with and without the reject option.
Acknowledgments
The authors express their appreciation to “The Research Center for Advanced Materials Science (RCAMS)” at King Khalid University, Saudi Arabia, for funding this work under the grant number RCAMS/KKU/002-22.
Disclosure statement
No potential conflict of interest was reported by the author(s).
Additional information
Funding
References
- Alon, U., N. Barkai, D. A. Notterman, K. Gish, S. Ybarra, D. Mack, and A. J. Levine (1999). Broad patterns of gene expression revealed by clustering analysis of tumor and normal colon tissues probed by oligonucleotide arrays. Proceedings of the National Academy of Sciences, 96(12), 6745–3907.
- Bartlett, P., Y. Freund, W. S. Lee, and R. E. Schapire. 1998. Boosting the margin: A new explanation for the effectiveness of voting methods. Annals of Statistics 26(5):1651–86. doi:10.1214/aos/1024691352.
- Bates, D., M. Cohen, M. Leape, L. Overhage, J. M. Shabot, and M. M. Sheridan. 2001. Reducing the frequency of errors in medicine using information technology. Journal of the American Medical Informatics Association 8(4):299–308. doi:10.1136/jamia.2001.0080299.
- Breiman, L. 2001. Random forests. Machine Learning 45(1):5–32. doi:10.1023/A:1010933404324.
- Cover, T. M., and P. E. Hart. 1967. Nearest neighbor pattern classification. IEEE Transactions on Information Theory 13(1):21–27. doi:10.1109/TIT.1967.1053964.
- Freund, Y., and R. E. Schapire. 1997. A Decision-Theoretic Generalization of On-Line Learning and an Application to Boosting. Journal of Computer and System Sciences 55(1):119–39. doi:10.1006/jcss.1997.1504.
- Golub, T. R., D. K. Slonim, C. H. P. Tamayo, J. P. Gaasenbeek, M. Mesirov, M. L. Coller, H. Loh, J. R. Downing, M. A. Caligiuri, and C. D. Bloomfield. 1999. Molecular classification of cancer: Class discovery and class prediction by gene expression monitoring. Science 286(5439):531–37. doi:10.1126/science.286.5439.531.
- Hanczar, B., and E. R. Dougherty. 2008. Classification with reject option in gene expression data. Bioinformatics 24(17):1889–95. doi:10.1093/bioinformatics/btn349.
- Kotsiantis, S. B., I. Zaharakis, and P. Pintelas. 2007. Supervised machine learning: A review of classification techniques. Emerging artificial intelligence applications in computer engineering 160(1): 3–24.
- Man, M. Z., G. Dyson, K. Johnson, and B. Liao. 2004. Evaluating methods for classifying expression data. Journal of Biopharmaceutical Statistics 14(4):1065–84. doi:10.1081/BIP-200035491.
- Park, C., and H. Park. 2005. A relationship betweenLDA and the generalized minimum squared error solution. SIAM Journal on Matrix Analysis and Applications 27(2):474–92. doi:10.1137/040607599.
- Shipp, M. A., K. N. Ross, P. Tamayo, A. P. Weng, J. L. Kutok, R. C. Aguiar, and T. R. Golub. 2002. Diffuse large B-cell lymphoma outcome prediction by gene-expression profiling and supervised machine learning. Nature medicine 8 (1):68–74.
- Vapnik, V. N. 1999. An overview of statistical learning theory. IEEE Transactions on Neural Networks 10(5):988–99. doi:10.1109/72.788640.
- Veer, L. J., H. Dai, M. J. Vijver, Y. D. He YD, A. A. M. Hart, M. Mao, H. L. Peterse, K. Kooy, M. J. Marton, A. T. Witteveen at, et al. 2002. Gene expression pro?ling predicts clinical outcome of breast cancer. Nature 415(6871):530–36. doi:10.1038/415530a.
- Wiering, M., and H. H. van.2007. Two novel on-policy reinforcement learning algorithms based on TD(λ)-methods. in Proceedings of the IEEE International Symposium on Adaptive Dynamic Programming and Reinforcement Learning. Honolulu, HI, USA. 280–87.
- Yu, F., T. K. Houston, M. N. Ray, D. Q. Garner, and E. S. Berner. 2007. Clinical decision support systems: State of the Art. Medical Decision Making 27(6):744–53. No. 09-0069-EF. Med Decis Making. doi:10.1177/0272989X07305321.
- Zhou, X., and K. Z. Mao. 2005. LS Bound Based Gene Selection for DN Microarray Data. Bioinformatics 21(8):1559–64. doi:10.1093/bioinformatics/bti216.