
 ?Mathematical formulae have been encoded as MathML and are displayed in this HTML version using MathJax in order to improve their display. Uncheck the box to turn MathJax off. This feature requires Javascript. Click on a formula to zoom.
ABSTRACT
Nowadays, breast cancer is one of the leading cancers in Vietnam, and it causes approximately 6000 deaths every year. The rate of breast cancer patients was calculated as 26.4/100000 persons in 2018. There are 21,555 new cases reported in 2020. However, these figures can be reduced with early detection and diagnosis of breast cancer disease in women through mammographic imaging. In many hospitals in Vietnam, there is a lack of experienced breast cancer radiologists. Therefore, it is helpful to develop an intelligent system to improve radiologists’ performance in breast cancer screening for Vietnamese patients. Our research aims to develop a convolutional neural network-based system for classifying breast cancer X-Ray images into three classes of BI-RADS categories as BI-RADS 1 (“normal”), BI-RADS 23 (“benign”) and BI-RADS 045 (“incomplete and malignance”). This classification system is developed based on the convolutional neural network with ResNet 50. The system is trained and tested on a breast cancer image dataset of Vietnamese patients containing 7912 images provided by Hanoi Medical University Hospital radiologists. The system accuracy uses the testing set achieved a macAUC (a macro average of the three AUCs) of 0.754. To validate our model, we performed a reader study with the breast cancer radiologists of the Hanoi Medical University Hospital, reading about 500 random images of the test set. We confirmed the efficacy of our model, which achieved performance comparable to a committee of two radiologists when presented with the same data. Additionally, the system takes only 6 seconds to interpret a breast cancer X-Ray image instead of 450 seconds interpreted by a Vietnamese radiologist. Therefore, our system can be considered as a “second radiologist,” which can improve radiologists’ performance in breast cancer screening for Vietnamese patients.
Introduction
Nowadays, breast cancer is the most popular form of cancer for women in many countries in the world. In Vietnam, the rate of breast cancer patients was 26.4/100000 persons in 2018, and breast cancer causes approximately 6000 deaths yearly (Tran Citation2018). Breast cancer was on top of the leading cancers in Vietnam, and it was increasing from year to year. For example, by statistics (Pham et al. Citation2019), about 5538 new cases of cancer diagnosis were reported in 2000, about 12,533 new cases were reported in 2010, and about 15,229 new cases were reported in 2018. By statistics in (The Global Cancer Observatory, Citation2021), about 21,555 new cases were reported in 2020.
Breast cancer screening methods for early detection include daily self-examinations and periodic health examinations for women over 40. Breast cancer screening based on X-Ray mammography has an important role in reducing breast cancer mortality by 20–22% (Machida et al. Citation2015; Marmot et al. Citation2013; Tab Ár et al. Citation2015). In (Sardanelli et al. Citation2017), the guidelines recommend that X-Ray mammography is appointed for breast cancer screening in women aged 40–75 years old, once every 2 years for patients that have no clinical symptoms and one time per year with women who have a high risk (Marmot et al. Citation2013; Wing and Langelier Citation2009). For diagnosis of women who have abnormal signs in clinical examination and mammography, it recommends testing breast hurt biopsies (Shimoda et al. Citation2016). Nowadays, the number of breast cancer screenings based on X-Ray is increasing; therefore, it is necessary to have more breast cancer, X-Ray radiologists. In (Wing and Langelier Citation2009) shows that even in the USA, a study predicted that the number of breast cancer X-Ray radiologists would fall significantly short in the next 20 years.
In Vietnam, the radiologists in many hospitals applied a classification system BI-RADS in 2013 (Breast Imaging Reporting and Data System) to classify a malignant level of abnormalities in breast cancer X-Ray images (Tan et al. Citation2004):
BI-RADS 0: Incomplete assessment. Additional testing is needed.
BI-RADS 1: The breast is normal, and no hurts were detected.
BI-RADS 2: The breast has an abnormality but benign mass.
BI-RADS 3: The breast has hurt, but the mass is most likely benign; the malignancy rate is less than 2%.
BI-RADS 4: The breast has hurt with a high malignancy rate, i.e., from 2% to 95%.
BI-RADS 5: The breast has hurt with a malignancy rate of over 95%.
Vietnam lacks experienced radiologists for breast cancer X-Ray interpretation. In the past, only the large radiology center may have mammography equipment, but now there has been a significant increase in the number of mammography units. The number of experienced radiologists trained for interpreting mammography does not correspond with the number of breast X-Ray units. There also exists a far difference in capacity among radiologists. The difference comes from the central hospitals and local hospitals. The patients usually go to the central hospitals for health checks, so they skip the local hospitals. Therefore, the central hospitals receive much more patients than the local hospitals. Thus, experienced doctors often stay in central hospitals located in crowded cities. To overcome the above problem, we develop a BI-RADS classification system that assists breast cancer radiologists in reading mammograms to have more accurate diagnoses and to reduce the time of reading breast cancer X-Ray images in hospitals. This BI-RADS classification system aims at classifying the X-Ray mammograms into three classes of BI-RADS as BI-RADS 045 (cannot evaluate lesion in breast X-Ray image or the breast has a lesion with high risk malignant, it needs more other diagnosis modality), BI-RADS 1 (the breast is normal, there is no suspected lesion), BI-RADS 23 (the breast has a lesion with benign finding).
To summarize, the main contributions of this paper are:
We develop a dataset of Vietnamese mammograms of BI-RADS 0, BI-RADS 1, BI-RADS 2, BI-RADS 3, BI-RADS 4, and BI-RADS 5 categories.
We train a ResNet 50 model on this Dataset to classify breast cancer X-Ray images into BI-RADS 045, BI-RADS 1, and BI-RADS 23.
To compare the performance of our model, we perform a ready study with one radiologist and the “committee of radiologists” of two radiologists of the Hanoi Medical University Hospital.
The system can help radiologists to improve not only the accuracy of breast cancer X-Ray image interpretation but also the time consumption.
The rest of the paper consists of the following sections: Section 2 reviews some related works. Section 3 presents a general architecture of the system. Section 4 describes data collection and labeling. Section 5 describes pre-processing and model training. Section 6 presents a model evaluation. Section 7 gives a ready study. Finally, some conclusions and future works are given.
Related Works
To build breast cancer X-Ray image classification systems, previous works have presented several ideas for ensemble and transfer learning techniques to improve classification accuracy. In (Geras et al. Citation2018), the authors develop a novel MV-DCN as a multiview deep convolutional network that can handle multiple views of screening mammography and utilize large high-resolution images without downscaling. This model can classify an incoming example as BI-RADS 0 (“incomplete”), BI-RADS 1 (“normal”), or BI-RADS 2 (“benign finding). The input of MV-DCN model are an exam containing four images corresponding to the four standard views used in screening mammography: R-CC (right craniocaudal), L-CC (left craniocaudal), R-MLO (right mediolateral oblique) and L-MLO (left mediolateral oblique). The authors started by building a large-scale data set of 201,698 screening exams consisting of 886,437 images. The results show that increasing the amount of data and the resolution of the image yield better results. The MV-DNN achieves macAUC (macro average of three AUCs) of 0.733 using 886,437 images with high resolution of the image (full image).
The recent work on this problem has been conducted by (Wu et al. Citation2020). The authors present a deep convolutional neural network for breast cancer screening exam classification, trained and evaluated on over 200,000 exams (over 1,000,000 images). When tested on the screening population, the system achieves an AUC of 0.895 in predicting the presence of cancer in the breast. Some advances of this method compared with the previous study (Geras et al. Citation2018) are as follow: (1) Proposing the two-stage architecture and training procedure, which allow us to use a high-capacity patch-level network to learn from pixel-level labels alongside a network learning from macroscopic breast-level labels. (2) A custom ResNet-based network used as a building block of the model, whose balance of depth and width is optimized for high-resolution medical images. (3) Pre-training the network on screening BI-RADS classification. (4) Combining multiple input views in an optimal way.
In (CitationLe Tuan Linh et.al. Le et al. Citation2022), the authors present a convolutional neural network for mammogram classification in breast cancer screening which is based on ResNet 34 as the basic framework. Because of the relatively small number of breast cancer X-Ray images they have available, they apply transfer learning to improve the model’s performance. The network architecture includes two stages: First, training the ResNet 34 model on DDSM public database with more than 10,000 images, then fine-tuning it on the breast cancer X-Ray dataset with 6000 images of Vietnamese patients (HMU dataset). The result shows that applying the transfer learning method gave a result that is higher than the evaluation results of the same model trained only on the X-Ray dataset of Vietnamese patients (HMU dataset).
In the paper of (Mansour Citation2020), a notably strong and green BC-CAD (Breast cancer laptop Aided prognosis) solution has been proposed. The proposed gadget consists of pre-processing, more suitable adaptive learning based totally Gaussian aggregate model (GMM), connected element analysis based vicinity of interest localization, and AlexNet-DNN primarily based characteristic extraction. The precept factor analysis (PCA) and Linear Discriminant Analysis (LDA) are primarily based on a characteristic selection that’s used as a dimensional discount. One of the blessings of the proposed method is that not one of the current dimensional reduction algorithms is hired with SVM to perform breast most cancers detection and class. The overall results signify that the AlexNet-DNN-based capabilities at a completely connected layer, FC6, LDA dimensional discount, and SVM-based total classification outperform other country-of-artwork techniques for breast cancer detection.
In the new study of (Althobaiti et al. Citation2022), a novel SEODTL-BDC (social engineering optimization with deep transfer learning-based breast cancer detection and classification) technique has been developed for the detection and classification of breast cancer utilizing ultrasound images. The proposed SEODTL-BDC technique encompasses a series of sub-processes, namely, BF-based pre-processing, LEDNet-based segmentation, ResNet-18-based feature extraction, RNN-based classification, and SEO-based hyperparameter tuning. The performance validation of the SEODTL-BDC technique is carried out using a benchmark dataset. The experimental outcomes pointed out the supremacy of the SEODTL-BDC approach over the existing methods.
General Architecture of the System
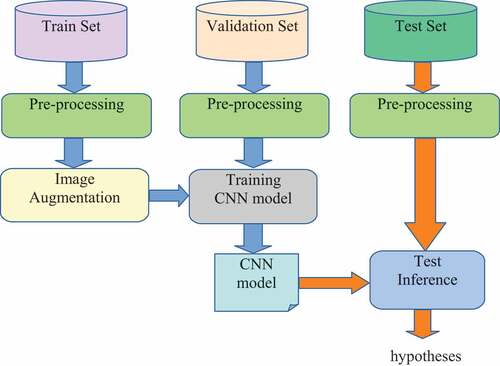
The general architecture of the system is described in . In the first stage, after the collection and labeling process of breast cancer images by radiologists of the Hanoi Medical University Hospital, the HMU dataset is divided into three parts, including the training set, the validation set, and the test set. The training set is the initial data used to train deep learning models. During the data training, the validation dataset is used for finding and optimizing the best model. Then the test dataset was used to provide an evaluation of the final model for classifying BIRADS into three categories, including BI-RADS 045, BI-RADS 1, and BI-RADS 23. All breast cancer images in these sets are pre-processed in the second stage. Data pre-processing is a process of preparing the raw data and making it suitable for a machine learning model. Some examples of breast cancer X-Ray image pre-processing methods are described in . After the pre-processing process, the training dataset is augmented by geometry transformation: scaling, translating, and rotating, and these new data are used to train the CNN model in . After pre-processing and augmentation of data, the CNN model is trained. Finally, we test the best model for the classification of BI-RADS 045, BI-RADS 1, and BI-RADS 23 on the test set.
Figure 1. The general architecture of the system.
Data Collection and Labelling
Breast cancer is a disease of a local nature where characteristics vary by region, country, and environment. Therefore, to have an accurate diagnosis for Vietnamese patients, the breast cancer detection system needs to be trained on the data of Vietnamese patients. In this study, we built a dataset of mammograms of Vietnamese patient volunteers of the Hanoi Medical University Hospital to use for research purposes. An identification number will code all patients’ information before being delivered to the research team.
This research uses the Vietnamese mammogram dataset (Nguyen et al. Citation2020). With every mammogram, radiologists of the Hanoi Medical University Hospital will give three selections: the first selection is to determine the normal X-Ray images (according to BI-RADS 1) and the second selection is that if there is an abnormality in the breast cancer X-Ray images, then determining ROI (region of interest) (maybe, there are some masses as Benign and Malignant in one mammogram) and labeling BI-RADS categories for each mass (from BI-RADS 2 to BI-RADS 5), the third selection is that if the breast cancer X-Ray images are “incomplete assessment,” then they classify X-Ray images into BI-RADS 0. Then we build the HMU-TL data set. After pre-processing to “clean” the “noise” images and choosing the quality images, the HMU-TL data set consists of 7912 breast cancer images used for training CNN models. Among 7912 images, there are 2224 images labeled by BI-RADS 0, 2829 images labeled by BI-RADS 1, 1343 images labeled by BI-RADS 2, 784 images labeled by BI-RADS 3; 638 images labeled by BI-RADS 4 and 94 images labeled by BI-RADS 5. The categories of these images from BI-RADS 0 to BI-RADS 5 were classified and labeled by two experienced radiologists in breast cancer X-Ray reading at the Hanoi Medical University Hospital.
For the localization of lesions and identification of BI-RADS categories, we used the ICY software: an open community platform for Bioimage Informatics (de Chaumont et al. Citation2019). An example of the localization of the mass region of the breast cancer image is shown in .
Figure 2. The result after localization of the mass region.
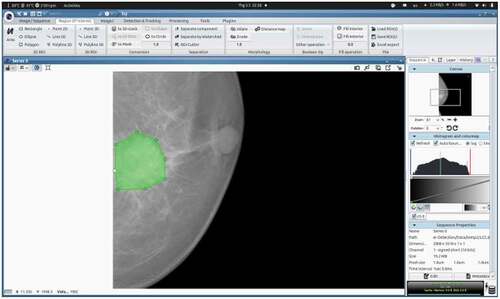
Finally, the file XML will be created with the same name as the image file for storing information on every point and label of the image.
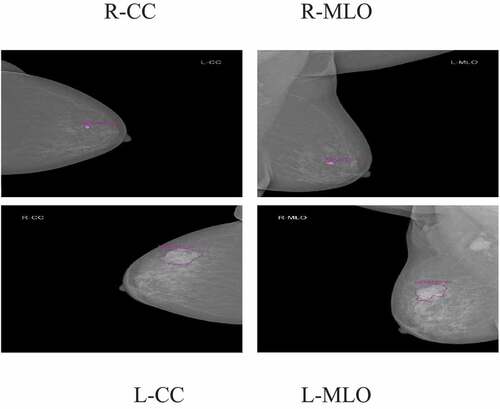
According to the requirement of the clinical practice of the Hanoi Medical University Hospital, each exam contains four images, corresponding to the four standard views used in screening mammography: R-CC (right craniocaudal), L-CC (left craniocaudal), R-MLO (right mediolateral oblique) and L-MLO (left mediolateral oblique). Interpreting mammography films based on BI-RADS classification of ACR 2013. Two experienced radiologists interpreted the BI-RADS classification (with 10 years of experience); if the result was different, there would be another experienced radiologist (with 20 years of experience) who interpreted the X-Ray images and gave the final BI-RADS classification. In our study, the radiologists of the Hanoi Medical University Hospital aim to classify the breast cancer X-Ray images into three BI-RADS categories as BI-RADS 1: the breast is normal, there is no suspected lesion, BI-RADS 23: the breast has a lesion with benign findings (including BI-RADS 2 and BI-RADS 3), and BI-RADS 045: cannot evaluate lesion in breast X-Ray image or the breast has a lesion with high risk malignant, it needs more other diagnosis modality (including BI-RADS 0, BI-RADS 4, BI-RADS 5).
Examples of breast cancer screening images of a patient: R-CC, L-CC, R-MLO, and L-MLO are illustrated in .
Figure 3. Examples of breast cancer screening images of a patient.
This Dataset is classified into three parts: the training dataset consists of 70%, the validation dataset consists of 15%, and the test dataset consists of 15% () because we want to have more images of BI-RADS 4 and BI-RADS 5 in the test dataset in order to get more accuracy in evaluation on the test set.
Table 1. Data of Train set, Validation set, a Test set of mammograms by BI-RADS and by views.
In , the data is imbalanced, i.e., the numbers of images L-CC of the training set is not the same as the numbers of images R-CC. This is because some patients are asked by medical doctors to perform an X-Ray on one breast only to evaluate disease risk.
Pre-Processing and Model Training
Pre-Processing
Firstly, the image data in DICOM (Digital Imaging and Communication in Medicine) file is converted to a PNG 16-bit format. Subsequently, these images are realized by pre-processing methods, then the training dataset is augmented, and these new data are used to train the CNN model in . The validation set is used to stop control of the training process. The trained CNN model was applied for experiments with the images in the Test set. The results are probabilities of every BI-RADS category on each image in the Test set.
The pre-processing image scheme is presented in . First, we flipped the images of R-CC and R-MLO views horizontally before feeding them to the model so that all breast images were leftward-oriented, allowing the shared ResNet weighted to operate on similarly oriented images.
Figure 4. The pre-processing image scheme.
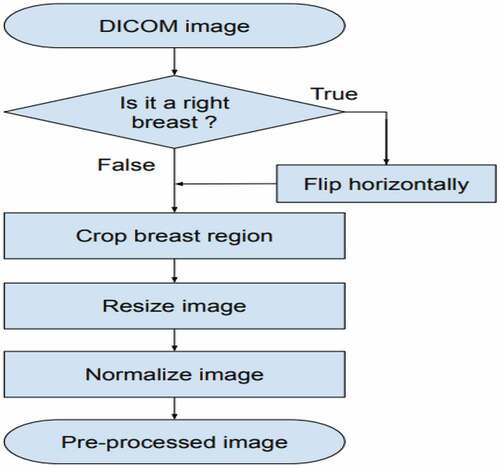
Second, the breast region was divided by image processing techniques: we cropped images by probing along the edge of the breast. After that, this image was resized to 512 × 512 pixels. Finally, each image was normalized by scaling to a min value of 0 and a max value of 1. (see EquationEquation 1(1)
(1) ). An example of the pre-processing process is described in .
Figure 5. Examples of breast cancer image pre-processing.
The formula for normalizing images is presented in EquationEquation 1(1)
(1) :
In Equation1, there is a pixel in an image, µ and δ are the mean and the standard deviation, which is calculated on all pixels in the image. The augmentation process is realized by geometry transformation, such as scaling, translating, and rotation. In the training process, firstly, input images with the size 512 × 512 pixels are transformed as new images by the following transform method:
Scaling: scale images to 90% −110% of their size, individually per axis. The scaling value is elected randomly from 90% to 110%.
Translating: translate by −10 to + 10% per axis. This means the images are translated randomly to the left (negative value), to the right (positive value), to the up (negative value), and to the bottom (positive value). This translating rate is chosen randomly in the interval of [0,10%].
Rotating: rotate by −5 to + 5 degrees. This means the images are rotated randomly from 0 to 5 degrees (negative value: rotating to left, positive value: rotating to the right).
All transform steps are realized on input images for creating new images, and then these images are used for the training process. This process is realized as the following:
Checking step by step every X image in the training set.
Putting X image from images file into RAM of Server.
Transforming X image to X’ image. Image X’ is stored in RAM, but these images are not stored in the disks. Using images X’ as input for neural network model by the backpropagation algorithm. We would like to emphasize data augmentation by replacing/transforming original data on-the-fly. This results that every epoch will have a new training dataset. Finally, after augmentation, the total training-set size is the number of epochs multiplied by the original data_set_size.
is an example of the images received in the image augmentation process. These images are created by separating images transforming the code above, and storing nine images resulting in 9 times image transformation. After that, these nine images are used to create the images in .
Figure 6. Example of images received in image augmentation process.
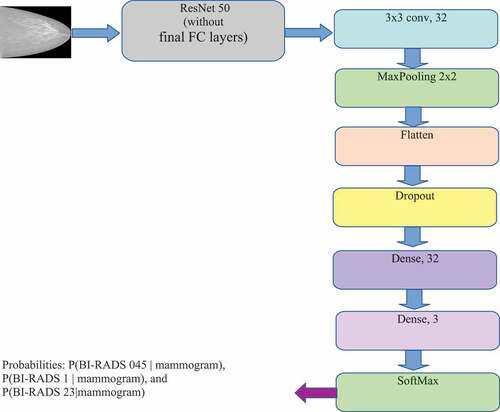
The CNN model architecture for BI-RADS classification is described in . In this architecture, we add more CNN layers with 32 feature maps following the ResNet 50 model (He et al. Citation2016) to reduce the feature set created from the above models. After that, the dense layers (Fully connected layers) together with the SoftMax layer are added for BI-RADS classification. The deep neural networks have 24 million parameters (backbone ResNet 50). The input image is represented as a 512 × 512× 3 dimensional tensor. The output of the ResNet 50 layer is a 16 × 16 × 2048-dimensional tensor. The output of Flatten layer is a 2048 vector (8 × 8 x 32). The output of the model (which is the output of the SoftMax layer) is three dimensions vector that represents the probabilities of BI-RADS 045, BI-RADS 1, and BI-RADS 23 with the mammogram given.
Figure 7. CNN Network Architecture for classification of BI-RADS (backbone ResNet50).
Training Model CNN for Classification of BI-RADS
The training process of the model ResNet 50 pre-trained on ImageNet is realized on the Server with the following configuration: CPU: Core i9-7900× (3.30 GHz), RAM: 128 GB, 2 Hard disks: one SSD 500GB and one HDD 4TB, 2 GPU NVIDIA RTX2080TI (11GB).
The Server is implemented by OS Linux Ubuntu 16.04.3 LTS operating system with libraries supporting the algorithms of Deep Learning on GPU, which consists of Nvidia CUDA 8.0.61 and NVIDIA CUDA 6.0.21. A deep learning system was developed on Keras with Tensorflow backend. The Early Stopping and Reduce Learning Rate on Plateau techniques are used in the training process with the following configuration: (1) The number of patience epochs for Early Stopping: 10. (It is a parameter of the function EarlyStopping of Tensorflow). (2) Start learning rate: 10–5. (3) Minimum learning rate: 10–8. (lower bound on the learning rate) (It is a parameter of the function ReduceLROnPlateau of Tensorflow).
Before feeding to the first dense layer (Dense, 32), the feature is normalized by BatchNorm and randomly set by Dropout. After this layer, the feature will be fed to ReLU activation function. The second dense layer (Dense, 3) will create a prediction. Similarly, before feeding to the last dense layer (Dense, 3), the feature is normalized by BatchNorm. This dense layer is connected with SoftMax function for BI-RADS classification. The output of the model (which is the output of SoftMax layer) includes a 3D vector that represents the probabilities of BI-RADS 045, BI-RADS 1, and BI-RADS 23 with the mammogram given in size of 512 × 512 × 3.
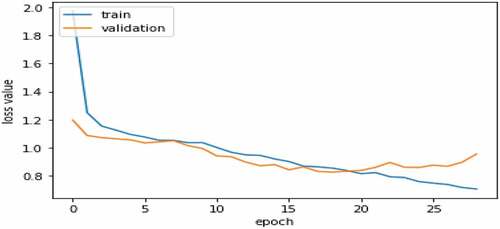
describes a variation graph of loss values of the train set and validation set according to the epochs during the training process. From the variation graph of loss values, we recognize that the training process achieves an optimization position at epoch 19. After that, the over-fitting is started. The loss value of the training set continues to decrease, but the loss value of the Validation set is increasing. Therefore, the achieved model at epoch 19 will be used for the experiment on the TEST set. The ResNet 50 model has 4,000,000 trainable parameters. On 2 GPU NVIDIA RTX2080TI, the approximate time for training HMU-TL database per epoch is 4 minutes, and the model takes about 76 minutes to train the best validation performance.
Figure 8. Graph of loss values of the train set and the validation set according to the epochs.
Results of Experiments for BI-RADS Classification on Vietnamese Patient’s Mammograms
For choosing evaluation metrics, when there are two classes, the most frequently applied performance metric is the AUC (area under the ROC curve). However, in our research, there are three classes in our learning task, and we cannot apply this metric directly. Instead of that, we computed three AUCs, each time treating one of three classes as a positive class and the remaining two as negative. We used the macro average of the three AUCs, abbreviated as macAUC, as the main performance metric in our study.
shows that the macro average of three AUCs (as AUC of BI-RADS 045 vs. others is 0.741, AUC of BI-RADS 1 vs. others is 0.782, AUC of BI-RADS 23 vs. others is 0.738) called macAUC obtain the value of 0.754. In , from our point of view, the AUC value of BI-RASDS 1 vs. others achieves the highest accuracy because the feature structure of the images of BI-RADS 1 category of the only “normal” patients is not complicated. In contrast, the AUC value of BI-RASDS 23 vs. others achieves the lowest accuracy because the number of images of BI-RADS 23 category with 1407 images in the training set is so smaller than the number of images of BI-RADS 045 and BI-RADS 1 categories. We also observe that even the number of images of BI-RADS 045 category with 2038 images in the training set is so bigger than the number of images of BI-RADS 23 category, but the AUC value of BI-RASDS 45 vs. others achieves an approximate accuracy as the AUC value of BI-RASDS 23 vs. others because the feature structure of the images of BI-RADS 045 category consisting of BI-RADS categories as BI-RADS 0 category, BI-RADS 4 category, and BI-RADS 4 category is so complicated.
Table 2. The model’s result.
presents a Confusion Matrix of the Test dataset with the model based on the ResNet 50 backbone. The result of shows:
Among 364 images of BI-RADS 045, the system has recognized 236 images correctly, which consisted of 64%, and 122 images were misrecognized as the images of BI-RADS 1, which consists of 34%, and 6 images were misrecognized as the images of BI-RADS 23 which consists of 2%.
Among 444 images of BI-RADS 1, the system recognized 331 images correctly which consisted of 75%, and 108 images were misrecognized as the images of BI-RADS 045, which consists of 24%, and 5 images were misrecognized as the images of BI-RADS 23 which consists of 1%.
Among 466 BI-RADS 23, the system recognized 152 images correctly, which consist of 33%, and 172 images were misrecognized as the images of BI-RADS 045 which consists of 37%, and 142 images were misrecognized as the images of BI-RADS 1 which consists of 30%.
Table 3. Confusion Matrix of Test dataset with the model based on backbone ResNet 50.
In , the ResNet 50 can recognize the best for BI-RADS 1. In contrast, this model recognizes BI-RADS 23 badly. One of the reasons is the number of images of BI-RADS 23 in the training set is small in comparison with the numbers of images of BI_RADS 045 and BI-RADS 1. On the other side, we observe that a lot of images of the BI-RADS 045 category were misrecognized as the images of BI-RADS 23, BI-RADS 1. In fact, in BI-RADS 045 category, consisting of BI-RADS 0, BI-RADS 4, and BI-RADS 5, the number of images of BI-RADS 0 is much more than the number of images of BI-RADS 4 and BI-RADS 5, but BI-RADS 0 indicates insufficient imaging information to allow for a complete evaluation. Therefore, the system easy to confuses BI-RADS 045 with BI-RADS 1 and BI-RADS 23.
(Geras et al. Citation2018) uses the database of 886,437 high-resolution breast cancer X-Ray images consisting of 201,698 screening exams for classifying BI-RADS 0, BI-RADS 1, BI-RADS 2 categories. The MV-DCN model combines four DCN models. Each DCN handles one view of the exam. The MV-DCN model achieves a macAUC of 0.733. In our study, we used only the training datasets with 7912 breast cancer images for training the ResNet 50 model for classifying BI-RADS 045, BI-RADS 1, BI-RADS 23 categories. Our model achieves a macAUC of 0.754. We cannot conclude whether our study is better than the study of (Geras et al. Citation2018) or not because the structure of images and the model architecture of our method and (Geras et al. Citation2018) study are different. But in our study, even though we used only 1% of training data, in comparison to training data used in (Geras et al. Citation2018) study, for model training, the accuracies of BI-RADS classification of the two studies are almost “the same.”
Table 4. A comparison of the result of the proposed method with other work.
Reader Study
To understand the limit of performance of our system, we performed a reader study with three readers – one random breast cancer radiologist and two experienced breast cancer radiologists called “the committee of radiologists.” Each read about 500 random images from the test set.
For each mammogram, they were asked to indicate the most likely BI-RADS category according to their judgment. Firstly, we evaluated one random radiologist’s performance and the “gold standard” which are “labels of breast cancer X-Ray images” provided by the radiologists of the Hanoi Medical University Hospital. Secondly, we evaluated two radiologists’ performance on the “committee of radiologists” and the gold standard. Thirdly, we evaluated the model’s performance and the “gold standard.” The metrics in our study are sensitivity and specificity. The mammograms are classified into three categories of BI-RADS: BI-RADS 045, BI-RADS 1, and BI-RADS 23.
The evaluation principle is the following: The mammogram classification system is considered an intelligent system when its diagnosis accuracy is approximate or higher than the diagnosis accuracy of a “committee of radiologists” or a random radiologist of breast cancer X-Ray.
The mammograms are called “gold standard” images which are labeled by the radiologists of the Hanoi Medical University Hospital based on the determined diagnoses in patient medical records or with the biopsy results of breast hurt region of patients. In our study, we received 500 images provided by the radiologists of the Hanoi Medical University Hospital,32 images that cannot be read by the software. Therefore, only 468 images are used as “gold standard” data which are the images of the test set.
Diagnosis Results of Breast Cancer Radiologists and Our Model
We have compared the performance of our BI-RADS classification system to human radiologists as one random radiologist and the “committee of radiologists” of two experienced radiologists using the metrics of sensitivity and specificity as in (Molins et al. Citation2008). Each reading 468 images from the test set. The results are shown in :
Table 5. Comparison of our model’s performance and the performance of one radiologist and the “committee of radiologists”.
shows that the proportion of true classification of BI-RADS of the breast cancer images among the total number of cases examined is about 60%. The proportion of true classification of positive BI-RADS that are correctly identified is about 58%, and the proportion of true classification of negative BI-RADS that are correctly identified is about 80%.
The accuracy of diagnosis of our model based on the averaged sensitivity and the averaged specificity is bigger than the diagnosis accuracy of one radiologist, and it is approximate the diagnosis accuracy of the “committee of radiologists” of two radiologists. Among two radiologists on the “committee of radiologists” one radiologist is an experienced expert with more than 10 years of experience.
Based on this result, our model can be considered as a “second radiologist” that can help radiologists of the Hanoi Medical University Hospital in reading breast cancer X-Ray images. On the other side, we have developed the interface between the system and the radiologists. The interface consists of the following main functions:
Selecting a breast cancer X-Ray image for classification
Classification of a breast cancer X-Ray image
Report of the result of breast cancer X-Ray image diagnosis
An example of selecting a breast cancer X-Ray image for classification is described in .
Figure 9. Selecting a breast cancer X-Ray image for classification.
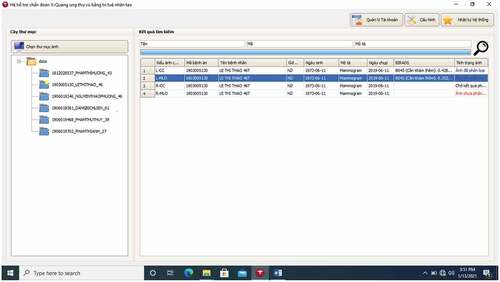
In the folder “Chon thu muc anh” with the computer icon in the top left corner (in English, it means “Selecting image folder), radiologists can choose a suitable folder of breast cancer X-Ray images of any patient. For example, in , the user chooses the folder called “1903005130_Lxxxxxxxx-46” which consists of four images L-CC, L-MLO, R-CC, and R-MLO. In this folder, we have chosen the image L-MLO of the medical record code “1903005130” of patient Lxxxxxxxx.
In , B0 stands for a BI-RADS 045, B1 stands for BI-RADS 1, B2 stands for BIRADS 23. The classification result shows that the image L-MLO of the medical record code “1903005130” gets three probabilities: BI-RADS 045 = 0.3524, BI-RADS 1 = 0.3513, BI-RADS 23 = 0.2964.
Figure 10. The result of the classification of the image is the image L-MLO of the medical record code “1903005130” of the patient Lxxxxxxxx.
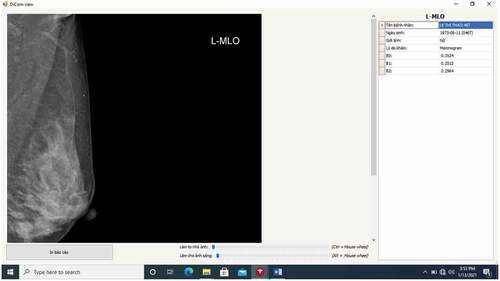
According to this result, among the three probabilities above, the system recommends choosing the highest probability of BI-RADS 045 as 0.3524. This means the patient Lxxxxxxxx needs to have further exams and testing. Of course, this result produced by our system is a recommendation, and the radiologists will combine this result with her clinical experiences to give a conclusion.
Conclusions
In this paper, we have presented a general architecture of the BI-RADS classification system classifying the X-Ray mammograms into three categories of BI-RADS as BI-RADS 045, BI-RADS 1, and BI-RADS 23. We have built a database of Vietnamese mammograms for training the model with ResNet 50 backbone to classify breast cancer X-Ray images into BI-RADS categories. Our network achieves macAUC of 0.75, an average sensitivity of 0.58, and an average specificity of 0.79. Although the system’s results are good enough, we acknowledge that the test set used in our experiments is relatively small, and our results require further clinical validation. We performed a ready study with radiologists of the Hanoi Medical University Hospital and acknowledge that our system’s performance is stronger than that of the radiologists’ on the task of BI-RADS category classification in our reader study.
The mean time that a Vietnamese radiologist spends interpreting a breast cancer X-Ray image is approximately 5 to 10 minutes, while the system takes only 6 seconds to interpret the same X-Ray image. Therefore, the system can help radiologists improve the accuracy of breast cancer X-Ray image interpretation and time consumption.
Further work is continuing to collect more Vietnamese mammograms for training our model so that our system can achieve higher accuracy in the interpretation of breast cancer X-Ray images.
Ethical Approval
This research was accepted by the Ethical Review Board of Hanoi Medical University (Approval No. HMUIRB111). All patients agreed verbally and/or gave written consent to use their medical data and information for the hospital’s training and research. All details about the patients’ information are confidential, and the data were collected and analyzed by many people.
Disclosure statement
No potential conflict of interest was reported by the author(s).
Additional information
Funding
References
- Althobaiti, M. M., A. A. Ashour, N. A. Alhindi, A. Althobaiti, R. F. Mansour, D. Gupta, and A. Khanna. 2022. Deep transfer learning-based breast cancer detection and classification model using photoacoustic multimodal images. BioMed Research International 2022:Article ID 3714422, 13 pages. doi:https://doi.org/10.1155/2022/3714422.
- Chokri, F., and M. H. Farida. 2017. Mammographic mass classification according to Bi-RADS lexicon. IET Computer Vision 11 (3):189–3872. doi:10.1049/iet-cvi.2016.0244.
- de Chaumont, F., S. Dallongeville, N. Chenouard, H. Herve, S. Pop, T. Provoost, V. Meas-Yedid, P. Pankajakshan, T. Lecomte, and Y. Montagner. 2019. ICY: An open community platform for Bioimage Informatics. http://icy.bioimageanalysis.org/.
- Geras, K. J., S. Wolfson, Y. Shen, N. Wu, S. G. Kim, E. Kim, L. Heacock, U. Parikh, L. Moy, and K. Cho. 2018. High-Resolution Breast Cancer Screening with Multi-View Deep Convolutional Neural Networks. arXiv:1703.07047v3 [cs.CV] 28 June 2018.
- The global cancer observatory. March, 2021. https://gco.iarc.fr/today/data/factsheets/populations/704-viet-nam-fact-sheets.pdf.
- He, K., X. Zhang, S. Ren, and J. Sun. 2016. Deep residual learning for image recognition. In Proceedings of the IEEE conference on computer vision and pattern recognition, 770–78.
- Le, T. L., B. M. Hanh, N. N. Cuong, H. M. Toan, V. Kreinovich, and H. -P. Nguyen. 2022. Deep neural networks based classification of mammograms, to appear in special issue on advances in intelligent systems (organized by Ildar batyrshin). Acta Polytechnica Hungarica.
- Machida, Y., M. Tozaki, A. Shimauchi, and T. Yoshida. 2015. Breast density: The trend in breast cancer screening. Breast Cancer 22 (3):253–61. doi:10.1007/s12282-015-0602-2.
- Mansour, R. F. 2020. A robust deep neural network based breast cancer detection and classification. International Journal of Computational Intelligence and Applications 19 (01):2050007. doi:https://doi.org/10.1142/S1469026820500078.
- Marmot, M. G., D. G. Altman, D. A. Cameron, J. A. Dewar, S. G. Thompson, and M. Wilcox. 2013. The benefits and harms of breast cancer screening: An independent review. British Journal of Cancer 108 (11):2205–40. doi:10.1038/bjc.2013.177.
- Molins, E., F. Macià, F. Ferrer, M. -T. Maristany, and X. Castells. 2008. Association between radiologists’ experience and accuracy in interpreting screening mammograms. BMC Health Services Research 8 (1):91. doi:10.1186/1472-6963-8-91.
- Nguyen, D. T., N. V. Dung, T. V. Duc, A. Nguyen, Q. H. Nguyen, N. T. Anh, N. N. Cuong, T. L. Le, B. M. Hanh, P. H. Phu, et al. 2020. Building a X-Ray database for mammography on vietnamese patients and automatic detecting roi using mask - RCNN. In Book: Soft computing for biomedical applications and related topics, ed. V. Kreinovich and N. H. Phuong, 315–329. Springer Nature.
- Pham, T., L. Bui, G. Kim, D. Hoang, T. Tran, and M. Hoang. 2019. Cancers in vietnam—burden and control efforts: A narrative scoping review. Cancer Control : Journal of the Moffitt Cancer Center 26 (1):1073274819863802. 2019 Jan-Dec. doi:10.1177/1073274819863802.
- Sardanelli, F., E. M. Fallenberg, P. Clauser, R. M. Trimboli, J. Camps-Herrero, T. H. Helbich, and G. Forrai. 2017. Mammography: An update of the EUSOBI recommendations on information for women. Insights into imaging 8 (1):11–18. doi:10.1007/s13244-016-0531-4.
- Shimoda, Y., T. Osanai, N. Nakayama, S. Ushikoshi, M. Hokari, H. Shichinohe, T. Abumiya, K. Kazumata, and K. Houkin. 2016. De Novo arteriovenous malformation in a patient with hereditary hemorrhagic telangiectasia. Journal of Neurosurgery Pediatrics 17 (3):330–35. doi:10.3171/2015.7.PEDS15245.
- Tab Ár, L., A. M. F. Yen, W. Y. Y. Wu, S. L. S. Chen, S. Y. H. Chiu, J. C. Y. Fann, M. M. S. Ku, R. A. Smith, S. W. Duffy, and T. H. H. Chen. 2015. Insights from the breast cancer screening trials: How screening affects the natural history of breast cancer and implications for evaluating service screening programs. The Breast Journal 21 (1):13–20. doi:10.1111/tbj.12354.
- Tan, Y. Y., S. B. Wee, M. P. C. Tan, and B. K. Chong. 2004. Positive predictive value of BI-RADS categorization in an Asian population. Asian Journal of Surgery 27 (3):186–91. doi:10.1016/S1015-9584(09)60030-0.
- Tran, V. T. 2018. The rate of cured treatment of breast cancer in Vietnam is equal to many developed countries. Website of the Vietnam National Cancer Hospital, in Vietnamese. https://benhvienk.vn/ty-le-chua-khoi-ung-thu-vu-tai-viet-nam-ngang-hang-nhieu-nuoc-phat-trien-nd54004.html.
- Wing, P., and M. H. Langelier. 2009. Workforce shortages in breast imaging: Impact on mammography utilization. American Journal of Roentgenology 192 (2):370–78. doi:10.2214/AJR.08.1665.
- Wu, N., J. Phang, J. Park, Y. Shen, Z. Huang, M. Zorin, S. Jastrzebski, T. Fevry, K. Latsnelson, E. Kim, et al. 2020. Deep neural networks improve radiologists’ performance in breast cancer screening. IEEE Transactions on Medical Imaging 39 (4):1184–94. April 2020. doi:10.1109/TMI.2019.2945514.