
 ?Mathematical formulae have been encoded as MathML and are displayed in this HTML version using MathJax in order to improve their display. Uncheck the box to turn MathJax off. This feature requires Javascript. Click on a formula to zoom.
ABSTRACT
Rapid and accurate extraction of liver tissue from abdominal computed tomography (CT) and magnetic resonance (MR) images has critical importance for diagnosis and treatment of hepatic diseases. Due to adjacent organs with similar intensities and anatomical variations between different subjects, the performance of segmentation approaches based on deep learning still has room for improvement. In this study, a novel convolutional encoder-decoder network incorporating multi-scale context information is proposed. The probabilistic map from previous classifier is iteratively fed into the encoder layers, which fuses high-level shape context with low-level appearance features in a multi-scale manner. The dense connectivity is adopted to aggregate feature maps of varying scales from the encoder and decoder. We evaluated the proposed method with 2D and 3D application on abdominal CT and MR images of three public datasets. The proposed method generated liver segmentation with significantly higher accuracy (p <0.05), in comparison to several competing methods. These promising results suggest that the novel model could offer high potential for clinical workflow.
Introduction
Liver segmentation on medical images plays a critical role in hepatic disease diagnosis, function assessment, radiotherapy planning, and image-guided surgery. In clinical workflow, computed tomography (CT) is the most common technique for detecting numerous types of malignant liver tumors (Chen et al. Citation2011). On the other hand, due to non-ionizing radiation and better contrast of soft tissues, magnetic resonance (MR) imaging is increasingly used to monitor liver volume and fat content, which could aid in reducing the need of more invasive biopsies (Tang et al. Citation2015).
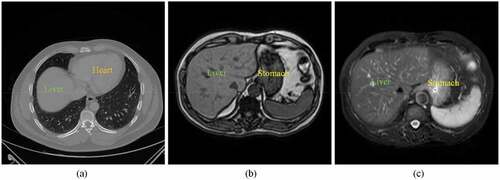
Manual delineation of the liver is time-consuming and prone to incur inter-observer variations. Semi-automatic or automatic approaches have been developed for radiologists and physicians (Chartrand et al. Citation2017; Moghbel et al. Citation2018). However, it is still a challenging task to rapidly and accurately extract liver organ from both CT and MR images. As can be seen in , several adjacent organs such as heart and stomach share similar intensities with liver. The multiple sequences of MR often suffer from image artifacts and intensity inhomogeneities. Moreover, the shape, size, and texture of liver in both CT and MR vary a lot across different subjects.
In the last few decades, most studies in liver segmentation have mainly focused on five types of methods (Heimann et al. Citation2009): statistical shape model, level set, graph cut, multi-atlas label fusion, and machine learning. Cerrolaza et al. introduced a generalized multi-resolution point distribution model to describe abdominal multi-organ shape, which can be integrated into the active shape-model-based segmentation (Cerrolaza et al. Citation2015). Wang et al. incorporated a shape-intensity prior model into level set framework for liver segmentation (Wang et al. Citation2016). Li et al. proposed the deformable graph cut based on shape constraints to accurately detect the
Figure 1. Examples of CT and MR abdominal organ images. (a) a CT image slice in axial view. (b) a T1-weighted sequence of MR image slice in axial view. (c) a T2-weighted sequence of MR image slice in axial view.
liver surface (Li et al. Citation2015). Chen et al. integrated the shape prior from multi-atlas label fusion with graph cut technique to reduce the errors of segmentation on abdominal CT images (Chen et al. Citation2020). Jin et al. applied generalized Hough transform and active appearance model to localize the renal cortex, and then a modified random forests method was employed to segment the kidney into four components (Jin et al. Citation2016).
Recently, deep learning methods, in particular convolutional neural network (CNN), have been used successfully in medical image segmentation (Ker et al. Citation2018; Litjens et al. Citation2017; Shen, Wu, and Suk Citation2017). A fully convolutional network (FCN) (Long et al. Citation2015) was trained end-to-end, pixels-to-pixels on semantic segmentation. In order to yield precise segmentation, a U-shaped architecture network (U-Net) (Ronneberger et al. Citation2015) was designed to combine encoding and decoding feature maps with skip connections. A practical deep convolutional encoder-decoder network for image segmentation (SegNet) (Badrinarayanan, Kendall, and Cipolla Citation2017) was presented using nonlinear upsampling with pooling indices. A dense V-network (DenseVNet) (Gibson et al. Citation2018) that enables high-resolution activation maps through memory-efficient dropout and feature reuse was proposed for abdominal multi-organ segmentation. To overcome the restrictive feature fusion scheme in U-Net, a novel architecture so-called UNet++ (Zhou et al. Citation2020) redesigning skip connections was presented for accurate image segmentation, which introduces a build-in ensemble of U-Nets of varying depths.
According to human perception, when someone observes a scene, the eyes move along the whole visual space, and then concentrate on region of interest (Zhang et al. Citation2017). Context information (Chen et al. Citation2016) mimicking this property of human perception has shown to be useful in image segmentation. Salehi et al. implemented an auto-context convolutional neural network upon the U-Net architecture for brain extraction. The posterior probability maps from the network output were utilized iteratively as context information to learn the local shape (Salehi, Erdogmus, and Gholipour Citation2017). Zhang et al. efficiently combined features within a single CT image and among multiple adjacent images for multi-organ segmentation (Zhang et al. Citation2018). Oktay et al. proposed a novel attention gate model that automatically learns to focus on target structures of varying shapes and sizes for medical imaging (Oktay et al. Citation2018). Yang et al. exploited the bidirectional long-short term memory network (BiLSTM) that can capture contextual cues to refine ultrasound segmentation (Yang et al. Citation2019). Since the intrinsic locality of convolution operations, Chen et al. integrated Transformers into U-Net framework as a strong alternative for medical image segmentation (Chen et al. Citation2022). Cao et al. developed a U-shaped pure Transformer (Swin-Unet) for multi-organ segmentation of abdominal and cardiac images (Cao et al. Citation2022). Hatamizadeh et al. introduced a 3D Transformer (UNETR) as the encoder to learn sequence representations of the input volume (Hatamizadeh et al. Citation2022).
To keep the model relatively simple, in this study we develop a novel convolutional encoder-decoder network incorporating multi-scale context information and apply it to liver segmentation. The probabilistic map from output layer of decoder part is iteratively fed into the encoder layers, which fuses high-level shape and context information with low-level appearance features in a multi-scale manner. Furthermore, the dense connectivity like UNet++ is adopted to aggregate feature maps of varying scales from the encoder and decoder. The proposed method for liver segmentation is evaluated on abdominal CT with 2D application and abdominal MR with 3D application.
Methods
Network Architecture
For the challenging liver segmentation of abdominal images, the architecture of classical U-Net with the pooling layer is prone to lose the information of image details in the downsampling step. In order to improve network performance, the posterior probabilities from the previous classifier are considered as features, and are merged into the proposed network. As a result, the substructure information would be compensated for the downsampling procedures in iterative and multi-scale manner.
As shown in , the proposed network consists of convolutional encoder part and decoder part. The basic unit of node where
indexes the downsampling layer along the encoder and
indexes the convolution layer along the skip connection is the convolutional block. For 2D application, the convolutional block is composed of two consecutive padded 3 × 3 convolutions followed by ReLU (Rectified Linear Unit) (Nair and Hinton Citation2010) layers. At node
, the original image
and the probabilistic map
are input to the convolutional
Figure 2. Network architecture.
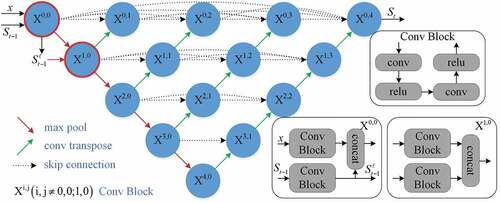
block, respectively. After that the feature maps from these blocks are concatenated, a 2 × 2 max-pooling operation with stride 2 is applied. In order to prepare for next scale connection, the from the posterior probabilities are transferred to a max-pooling layer, which are used to node
. Therefore the probabilistic map in two scales (
) is fed into the network for guiding the segmentation task. After each downsampling operation, the number of feature channels is doubled.
In the decoder part, a 2 × 2 transpose convolutional layer (Dumoulin and Visin Citation2018) for upsampling operation is applied after the convolutional block. Inspired by UNet++, the U-Nets of varying depths are realized through the extended decoders and unified into the ensemble architecture. With dense connectivity, each decoder fuses the final aggregated feature maps and the intermediate aggregated feature maps, as well as the same-scale feature maps from the encoder. As such, the multi-scale context information can be propagated to the aggregation layers across the network. After each upsampling operation, the number of feature channels is halved. Without deep supervision, a 1 × 1 convolution is appended to the final layer. For 3D application, the kernel sizes of convolution and max-pooling layers are correspondingly extended to 3 × 3 × 3 and 2 × 2 × 2.
Technical Details
In the proposed segmentation method, a sequence of classifiers () is designed in an iterative way, in which the posterior probabilities from the previous classifier are incorporated into the current process as features. Let
be m training image pairs, where
and
are respectively the intensity image and corresponding label image. For each image at step t, the pair of
is delivered into the network for classification where
is the posterior probability of image
from previous step. When step
,
is constructed with uniform distribution (i.e. the probability value of 0.5 for binary classification).
Table
For each image, the posterior probability can be calculated through the network in followed by a Sigmoid activation function. During the optimization, a hybrid loss consisting of pixel-wise cross-entropy and soft dice-coefficeint is minimized. Mathematically, it can be defined as:
where denotes image labels,
denotes predicted probabilities, N denotes the number of pixels, and
is the balance factor. Note that only cross-entropy loss is employed for 2D application. Algorithm 1 shows the procedure of weights learning for the sequence of classifiers. In the test stage, the learned weights can be successively applied to the first two classifiers (
) in the sequence for segmentation.
Experiments
Datasets
Three publicly available datasets covering liver organs were used in this study. The first dataset was from 3Dircadb1 (Bilic et al. Citation2022), which contains 20 contrast-enhanced CT scans. The image size is 512 × 512 × 74 ~ 260 voxels. The in-plane spacing varies from 0.57 mm to 0.87 mm, and slice thickness ranges from 1 mm to 4 mm. The second dataset was from Sliver07 (Heimann et al. Citation2009), which contains 20 contrast-enhanced CT scans. The image size is 512 × 512 × 64 ~ 394 voxels. The in-plane spacing varies from 0.58 mm to 0.82 mm, and slice thickness ranges from 1 mm to 3 mm.
The third dataset was provided by the Combined Healthy Abdominal Organ Segmentation challenge in 2019 (CHAOS19) (Kavur et al. Citation2020), including 20 contrast-enhanced CT scans and 20 multi-sequence MR scans. For the CT data, the image size is 512 × 512 × 78 ~ 294 voxels. The in-plane spacing varies from 0.54 mm to 0.79 mm, and slice thickness ranges from 2.0 mm to 3.2 mm. The MR data includes two different sequences T1-DUAL and T2-SPIR. In total, there are 60 images from T1-DUAL in phase (T1-DUALin), T1-DUAL oppose phase (T1-DUALout), and T2-SPIR for 20 patients. The image size is 256 × 256 × 26 ~ 50 voxels. The in-plane spacing varies from 0.72 mm to 2.03 mm, and slice thickness ranges from 4.4 mm to 8.0 mm. The manual delineation of liver tissue in each image is regarded as the ground truth for validation.
Evaluation Metrics
To quantitatively evaluate the performance of the proposed method, we used four metrics (Heimann et al. Citation2009): the Dice coefficient (DICE), the Relative absolute volume difference (RAVD), the Average symmetric surface distance (ASSD), and the Maximum symmetric surface distance (MSSD). Assuming that denotes segmentation by the algorithm and
denotes segmentation by the ground truth, the DICE and RAVD can be defined as follows:
where indicates the number of voxels within the segmentation and
indicates the absolute value. Assuming that
denotes the surface of segmentation by the algorithm and
denotes the surface of segmentation by the ground truth, the ASSD and MSSD can be defined as follows:
where indicates the Euclidean distance of the set of points on
to the nearest point on
. For the DICE, the larger the value is, the better the segmentation result is. For the other metrics, the smaller the value is, the better the segmentation result is. A value of
in two-sided Wilcoxon tests was considered to indicate a statistically significant difference between two methods.
Experimental Setup
For the CT images in each dataset, the networks process 2D axial slices, and then the segmentation results are stacked into 3D volumes. A 5-fold cross validation was performed on 20 cases of each dataset for liver segmentation. For comparison, we use the original 2D U-Net (Ronneberger et al. Citation2015), 2D Auto-Net (Salehi, Erdogmus, and Gholipour Citation2017), and UNet++ (Zhou et al. Citation2020) for 2D tasks (2D UNet++) as baseline methods. To avoid over-fitting, the data was augmented by random rotation (between 0 and 90 degrees), random flipping (on two axes), and random elastic deformation (grid displacements from Gaussian distribution with 2 pixels standard deviation).
For the MR images in the CHAOS19 dataset, the networks were operated in 3D mode. A 5-fold cross validation was performed on 20 cases of each sequence (T1-DUALin, T1-DUALout, and T2-SPIR) for liver segmentation. For comparison, we use the 3D U-Net (Cicek et al. Citation2016), 3D Auto-Net (Salehi, Erdogmus, and Gholipour Citation2017), and UNet++ (Zhou et al. Citation2020) for 3D tasks (3D UNet++) as baseline methods. All MR images were resampled to the spacing of 1.5 × 1.5 × 6.0 mm and cropped to the size of 224 × 224 × 48 voxels. Data augmentation including random rotation
(between 0 and 90 degrees), random flipping (on three axes), and random elastic deformation (grid displacements from Gaussian distribution with 2 voxels standard deviation) was used to alleviate over-fitting problem.
Implementation Details
The proposed method was implemented using PyTorch (Paszke et al. Citation2017) on a PC with an NVIDIA GeForce RTX 3080Ti GPU. Before training and test, both CT and MR were normalized to zero mean and unit variance. Our model was trained using the Adam optimizer (Kingma and Ba Citation2014) with a learning rate of 1e-4, a batch size of 1, and 16 base filters in the first layer. The number of training epochs per step was 40 and for 2D application, while 80 epochs were set to each step and
for 3D application. In addition, the balance factor in EquationEquation (1)
(1)
(1) was set to
. Our code is freely available at https://github.com/zfy012/Ite-netpp.
Results and Discussions
Results on Abdominal CT Images
shows the learning curves of the 2D UNet++ and the proposed method for liver segmentation on CT images. It is obvious that our method enables a better optimization than 2D UNet++ for the tasks of three datasets. The DICE results of liver segmentation using four methods are plotted in . In 3Dircadb1, the median DICE of the proposed method increases significantly compared to 2D UNet++ from 0.946 to 0.956 (). In Sliver07, the median
Figure 3. The training results of the 2D UNet++ and the proposed method over 80 epochs from (a) the 3Dircadb1 dataset, (b) the Sliver07 dataset, and (c) the CHAOS19 dataset.
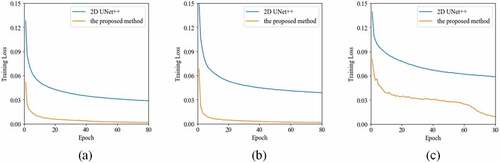
Figure 4. The boxplot of DICE results using four methods on CT images of three datasets. A star indicates a statistical significant difference of the median DICE compared to the previous column.
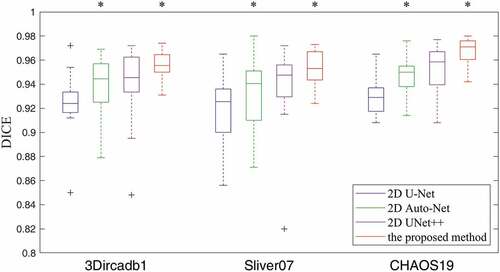
DICE of the proposed method increases significantly compared to 2D UNet++ from 0.947 to 0.953 (). In CHAOS19, the median DICE of the proposed method increases significantly compared to 2D UNet++ from 0.958 to 0.971 (
). lists the quantitative results of liver segmentation evaluation metrics for three datasets. The proposed method obtained the best DICE, RAVD, and ASSD on all datasets. With regard to MSSD, the 2D Auto-Net achieved the best results on the 3Dircadb1 and CHAOS19 datasets. displays some segmentation results produced by using four methods. It can be seen that the contours through our method are much closer to the liver boundaries of ground truth.
Figure 5. Typical liver segmentation results on CT images of the 3Dircadb1 (top row), the Sliver07 (middle row), and the CHAOS19 (bottom row) datasets by using four methods. (a) 2D U-Net. (b) 2D Auto-Net. (c) 2D UNet++. (d) the proposed method. Green contours indicate the ground truth segmentation, and red contours indicate the automatic segmentation by the algorithm.
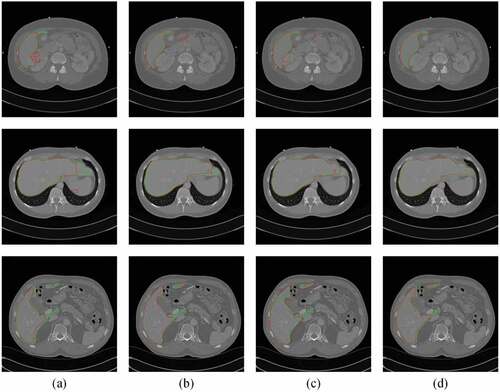
Table 1. The mean and standard deviation of quantitative measures for liver segmentation on three datasets.
Results on Abdominal MR Images
shows the learning curves of the 3D UNet++ and the proposed method for liver segmentation on multi-sequence MR images of the CHAOS19 dataset. It is clear that our method enables a better optimization than 3D UNet++ for these tasks. The DICE results of liver segmentation using four methods are plotted in . In the T1-DUALin sequence, the median DICE of the proposed method increases significantly compared to 3D UNet++ from 0.940 to
Figure 6. The training results of the 3D UNet++ and the proposed method over 160 epochs from (a) the T1-DUALin sequence, (b) the T1-DUALout sequence, and (c) the T2-SPIR sequence.
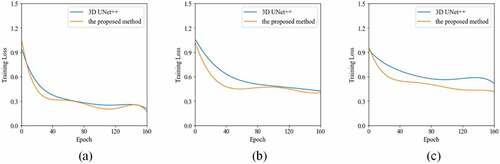
Figure 7. The boxplot of DICE results using four methods on multi-sequence MR images of the CHAOS19 dataset. A star indicates a statistical significant difference of the median DICE compared to the previous column.
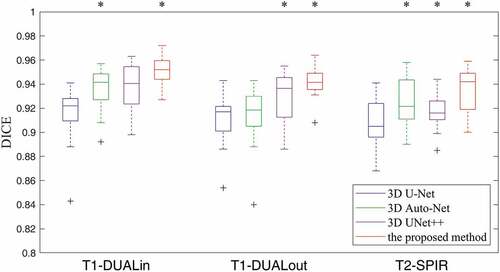
0.952 (). In the T1-DUALout sequence, the median DICE of the proposed method increases significantly compared to 3D UNet++ from 0.936 to 0.942 (
). In the T2-SPIR sequence, the median DICE of the proposed method increases significantly compared to 3D UNet++ from 0.916 to 0.942 (
). lists the quantitative results of liver segmentation evaluation metrics for three sequences. The proposed method obtained the best DICE, RAVD, and MSSD on all sequences. With regard to ASSD, the 3D Auto-Net achieved the best results except for the T1-DUALout sequence. displays some segmentation results produced by using four methods. It can be found that there are more under-segmentation and over-segmentation in the results of the first three methods.
Figure 8. Typical liver segmentation results on MR images with the T1-DUALin (top row), the T1-DUALout (middle row), and the T2-SPIR (bottom row) sequences by using four methods. (a) 3D U-Net. (b) 3D Auto-Net. (c) 3D UNet++. (d) the proposed method. Green contours indicate the ground truth segmentation, and red contours indicate the automatic segmentation by the algorithm.
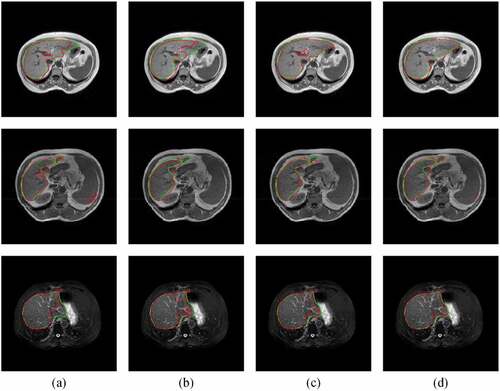
Table 2. The mean and standard deviation of quantitative measures for liver segmentation on multi-sequence MR images of the CHAOS19 dataset.
Comparison with Transformer-Based Methods
For segmentation on all CT images, we compared the proposed method to the Swin-Unet method (Cao et al. Citation2022). In principle, Swin Transformer block that computes self-attention within 2D local windows (Liu et al. Citation2021) is taken as the basic unit of U-shaped architecture in this method. The Swin-Unet model was trained using the Adam optimizer for 100 epochs with a learning rate of 1e-4, a batch size of 8, patch size of 16, and pre-trained initial weights. In quantitative measures (see ), the Swin-Unet method obtained the better MSSD than the proposed method.
Table 3. The overall quantitative results of liver segmentation on CT and MR images as mean by using the Transformer-based methods and the proposed method.
For segmentation on all MR images, we compared the proposed method to the UNETR method (Hatamizadeh et al. Citation2022). In this method, the Transformer operating 3D input volumes is employed as the main encoder of network. The UNETR model was trained using the AdamW optimizer for 25,000 epochs with a learning rate of 1e-4, a batch size of 2, patch size of 16, and pre-trained initial weights. It can be seen from that segmentation accuracy of the UNETR method is slightly higher than the proposed method in terms of the DICE and MSSD.
Ablation Study
We conducted an ablation study to evaluate the contribution of the shape context. For MR images with 3D application, node in was replaced by the common convolutional block. It means that the posterior probabilities from the previous classifier are fused in a single-scale manner (IterConv-SSC). Except for changing of network structures, all parameters settings in this variation are the same as those in the proposed method in a multi-scale manner (IterConv-MSC). The overall results of quantitative measures for this variation are given in . They show that using IterConv-MSC brings an increase of DICE from 0.933 to 0.943, a decrease of RAVD from 4.035 to 3.331, a decrease of ASSD from 1.326 mm to 1.111 mm, and a decrease of MSSD from 20.563 mm to 19.817 mm. Therefore, the effectiveness of our method in a multi-scale manner is confirmed.
Table 4. The overall quantitative results of liver segmentation on MR images as mean by using the proposed method with different scales.
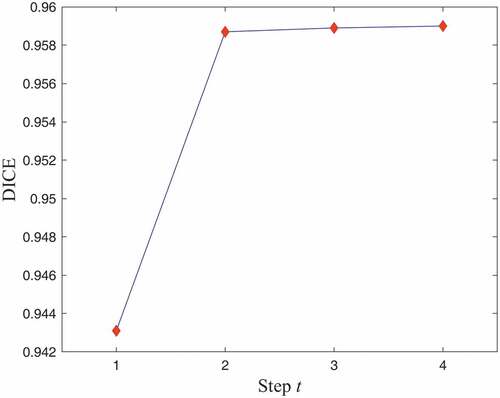
In addition, the influence of different steps () was examined. For CT images with 2D application, shows the mean DICE for liver segmentation at four steps of the proposed algorithm. It can be observed that the networks learned multi-scale context information through iterations for improvement in the Dice coefficient. Therefore,
is a good compromise between segmentation accuracy and computational burden.
Figure 9. The DICE results of liver segmentation on all CT images as mean by using four steps of the proposed method.
Model Complexity
The model complexity in terms of trainable parameters and floating-point operations (FLOPs) for the proposed method and various baseline methods is listed in . It shows that the proposed method still have an acceptable computational complexity, although containing the probabilistic map. In the inference stage of 2D application, it costs about 0.1 s to segment each CT slice. For 3D application, the inference time is about 1.3 s to segment each MR volume. Since the model can be trained offline, our method would be practicable and efficient in routine clinical workflow.
Table 5. The model complexity of different networks.
Conclusion
In this work, we proposed an iterative convolutional encoder-decoder network, which integrates multi-scale context information for liver segmentation. We evaluated this model on abdominal CT and MR images of three public datasets. The experimental results show that the proposed model is able to produce more accurate liver segmentation than other models. In future work, we will embed attention mechanisms into this model for further improvement (Zhang et al. Citation2022). Moreover, the initial probabilistic map from multi-atlas registration (Zhang et al. Citation2021) and segmentation post-processing (Chen et al. Citation2022) would be another future direction.
Disclosure statement
No potential conflict of interest was reported by the author(s).
Additional information
Funding
References
- Badrinarayanan, V., A. Kendall, and R. Cipolla. 2017. SegNet: A deep convolutional encoder-decoder architecture for image segmentation. IEEE Transactions on Pattern Analysis and Machine Intelligence 39 (12):2481–3943. doi:10.1109/TPAMI.2016.2644615.
- Bilic, P., Christ, P.F. et al . 2022. The liver tumor segmentation benchmark (lits). arXiv preprint arXiv:1901.04056.
- Cao, H. , Wang, Y., Chen, J., Jiang, D., Zhang, X., Tian, Q., & Wang, M. 2022. Swin-Unet: Unet-like pure transformer for medical image segmentation. Proceedings of the European Conference on Computer Vision Workshops Tel Aviv, Israel, 1–14.
- Cerrolaza, J. J., M. Reyes, R. M. Summers, M. Á. González-Ballester, and M. G. Linguraru. 2015. Automatic multi-resolution shape modeling of multi-organ structures. Medical Image Analysis 25 (1):11–21. doi:10.1016/j.media.2015.04.003.
- Chartrand, G., T. Cresson, R. Chav, A. Gotra, A. Tang, and J. A. De Guise. 2017. Liver segmentation on CT and MR using laplacian mesh optimization. IEEE Transactions on Biomedical Engineering 64 (9):2110–21. doi:10.1109/TBME.2016.2631139.
- Chen, Y., W. Chen, X. Yin, X. Ye, X. Bao, L. Luo, Q. Feng, Y. Li, and X. Yu. 2011. Improving low-dose abdominal CT images by weighted intensity averaging over large-scale neighborhoods. European Journal of Radiology 80 (2):E42–49. doi:10.1016/j.ejrad.2010.07.003.
- Chen, S., Gamechi, Z.S., Dubost, F., Tulder, G., Bruijne, M. 2022. An end-to-end approach to segmentation in medical images with CNN and posterior-CRF. Medical Image Analysis 76: 102311.
- Chen, J., Y. Lu, Q. Yu, X. Luo, E. Adeli, Y. Wang, L. Lu, A. L. Yuille, and Y. Zhou. 2021. TransUnet: Transformers make strong encoders for medical image segmentation. arXiv preprint arXiv:2102.04306.
- Chen, H., X. Pan, X. Lu, and Q. Xie. 2020. A modified graph cuts image segmentation algorithm with adaptive shape constraints and its application to computed tomography images. Biomedical signal processing and control 62:102092. doi:10.1016/j.bspc.2020.102092.
- Chen, J., Yang, L., Zhang, Y., Alber, Mark, Chen, D.Z. 2016 .Combining fully convolutional and recurrent neural networks for 3D biomedical image segmentation. Conference on Neural Information Processing Systems Centre Convencions Internacional Barcelona, Barcelona SPAIN, vol. 29, 1–9.
- Cicek, O., Abdulkadir, A., Lienkamp, S., Brox, T., Ronneberger, O. 2016. 3D U-Net: Learning dense volumetric segmentation from sparse annotation. arXiv preprint arXiv:1606.06650v1.
- Dumoulin, V., and F. Visin. 2018. A guide to convolution arithmetic for deep learning. arXiv preprint arXiv:1603.07285v2.
- Gibson, E., F. Giganti, Y. Hu, E. Bonmati, S. Bandula, K. Gurusamy, B. Davidson, S. P. Pereira, M. J. Clarkson, and D. C. Barratt. 2018. Automatic multi-organ segmentation on abdominal CT with dense v-networks. IEEE Transactions on Medical Imaging 37 (8):1822–34. doi:10.1109/TMI.2018.2806309.
- Hatamizadeh, A., Tang, Y., Nath, V., Yang, D., Myronenko, A., Landman, B., Roth, H., Xu, D. 2022. UNETR: Transformers for 3d medical image segmentation. Proceedings of the IEEE/CVF Winter Conference on Applications of Computer Vision Waikoloa, HI, USA.
- Heimann, T., B. van Ginneken, M. A. Styner, Y. Arzhaeva, V. Aurich, C. Bauer, A. Beck, C. Becker, R. Beichel, G. Bekes, et al. 2009. Comparison and evaluation of methods for liver segmentation from CT datasets. IEEE Transactions on Medical Imaging 28 (8):1251–65. doi:10.1109/TMI.2009.2013851.
- Jin, C., F. Shi, D. Xiang, X. Jiang, B. Zhang, X. Wang, W. Zhu, E. Gao, and X. Chen. 2016. 3D fast automatic segmentation of kidney based on modified AAM and random forest. IEEE Transactions on Medical Imaging 35 (6):1395–407. doi:10.1109/TMI.2015.2512606.
- Kavur, A. E., Gezer, N.S., Barış, M. et al 2020. CHAOS challenge - combined (CT-MR) healthy abdominal organ segmentation. arXiv preprint arXiv:2001.06535.
- Ker, J., L. Wang, J. Rao, and T. Lim. 2018. Deep learning applications in medical image analysis. IEEE Access 6:9375–89. doi:10.1109/ACCESS.2017.2788044.
- Kingma, D. P., and J. Ba. 2014. ADAM: A method for stochastic optimization. [Online]. https://arxiv.org/abs/1412.6980.
- Li, G., X. Chen, F. Shi, W. Zhu, J. Tian, and D. Xiang. 2015. Automatic liver segmentation based on shape constraints and deformable graph cut in CT images. IEEE Transactions on Image Processing 24 (12):5315–29. doi:10.1109/TIP.2015.2481326.
- Litjens, G., T. Kooi, B. E. Bejnordi, A. A. A. Setio, F. Ciompi, M. Ghafoorian, J. A. W. M. van der Laak, B. van Ginneken, and C. I. Sánchez. 2017. A survey on deep learning in medical image analysis. Medical Image Analysis 42:60–88. doi:10.1016/j.media.2017.07.005.
- Liu, Z., Lin, Y., Cao, Y., Hu, H., Wei, Y., Zhang, Z., Lin, S., Guo, B. 2021. Swin transformer: Hierarchical vision transformer using shifted windows. arXiv preprint arXiv:2103.14030v2.
- Long, J., Shelhamer, E., Darrell, T. 2015. Fully convolutional networks for semantic segmentation. IEEE Conference on Computer Vision and Pattern Recognition Boston, MA, USA, 3431–40.
- Moghbel, M., S. Mashohor, R. Mahmud, and M. I. B. Saripan. 2018. Review of liver segmentation and computer assisted detection/diagnosis methods in computed tomography. Artificial Intelligence Review 50 (4):497–537. doi:10.1007/s10462-017-9550-x.
- Nair, V., and G. E. Hinton. 2010. Rectified linear units improve restricted Boltzmann machines. Proceedings of ICML Haifa, Israel, 807–14.
- Oktay, O., Schlemper, J., Folgoc, L., Lee, M., Heinrich, M., Misawa, K., Mori, K., McDonagh, S., Hammerla, N., Kainz, B., Glocker, B., Rueckert, D. 2018. Attention U-Net: Learning where to look for the pancreas. Conference on Medical Imaging with Deep Learning Amsterdam, 1–10.
- Paszke, A., Gross, S., Chintala, S. et al 2017. Automatic differentiation in pytorch. NIPS-W.
- Ronneberger, O., Fischer, P., Brox, T. 2015. U-Net: Convolutional networks for biomedical image segmentation. International Conference on Medical Image Computing and Computer-Assisted Intervention Munich, Germany, 234–41.
- Salehi, S. S. M., D. Erdogmus, and A. Gholipour. 2017. Auto-context convolutional neural network for brain extraction in magnetic resonance imaging. IEEE Transactions on Medical Imaging 36 (11):2319–30. doi:10.1109/TMI.2017.2721362.
- Shen, D., G. Wu, and H.-I. Suk. 2017. Deep learning in medical image analysis. Annual Review of Biomedical Engineering 19 (1):221–48. doi:10.1146/annurev-bioeng-071516-044442.
- Tang, A., J. Chen, T.-A. Le, C. Changchien, G. Hamilton, M. S. Middleton, R. Loomba, and C. B. Sirlin. 2015. Cross-sectional and longitudinal evaluation of liver volume and total liver fat burden in adults with nonalcoholic steatohepatitis. Abdominal imaging 40 (1):26–37. doi:10.1007/s00261-014-0175-0.
- Wang, J., Y. Cheng, C. Guo, Y. Wang, and S. Tamura. 2016. Shape–intensity prior level set combining probabilistic atlas and probability map constrains for automatic liver segmentation from abdominal CT images. International Journal of Computer Assisted Radiology and Surgery 11 (5):817–26. doi:10.1007/s11548-015-1332-9.
- Yang, X., L. Yu, S. Li, H. Wen, D. Luo, C. Bian, J. Qin, D. Ni, and P.-A. Heng. 2019. Towards automated semantic segmentation in prenatal volumetric ultrasound. IEEE Transactions on Medical Imaging 38 (1):180–93. doi:10.1109/TMI.2018.2858779.
- Zhang, Y., He, Z., Zhong, C., Zhang, Y., Shi, Z. 2017. Fully convolutional neural network with post-processing methods for automatic liver segmentation from CT. Chinese Automation Congress, 3864–69.
- Zhang, Y., Jiang, X., Zhong, C., Zhang, Y., Shi, Z., Li, Z. 2018. SequentialSegNet: Combination with sequential feature for multi-organ segmentation. International Conference on Pattern Recognition Beijing,China, 3864–69.
- Zhang, Y., J. Wu, Y. Liu, Y. Chen, W. Chen, E. Wu, C. Li, and X. Tang. 2021. A deep learning framework for pancreas segmentation with multi-atlas registration and 3D level-set. Medical Image Analysis 68:101884. doi:10.1016/j.media.2020.101884.
- Zhang, Y., Yang, J., Liu, Y., Tian, J., Wang, S., Zhong, C., Shi, Z., Yang, Z., He, Z. 2022. Decoupled pyramid correlation network for liver tumor segmentation from CT images. Medical Physics: 1–15. doi:10.1016/j.ejmp.2022.04.018.
- Zhou, Z., Siddiquee, M., Tajbakhsh, N., Liang, J. 2020. UNet++: Redesigning skip connections to exploit multiscale features in image segmentation. IEEE Transactions on Medical Imaging 37 (8):1822–34.