
 ?Mathematical formulae have been encoded as MathML and are displayed in this HTML version using MathJax in order to improve their display. Uncheck the box to turn MathJax off. This feature requires Javascript. Click on a formula to zoom.
ABSTRACT
Lung cancer is the most common and second leading cause of cancer with lowest survival rate due to lack of efficient diagnostic tools. Currently, researchers are devising artificial intelligence based tools to improve the diagnostic capabilities. The machine learning (ML) requires hand-crafted features to train the algorithms. To extract most relevant features is still a challenging task in the field image processing. We first extracted the texture gray level co-occurrence matrix features. We fed these features to traditional ML algorithms such as k-nearest neighbor (KNN) and support vector machine (SVM). The SVM yielded an accuracy of 83.0%, whereas KNN produced an accuracy of 97.0%. We then optimized and employed the ensemble extreme boosting (XGBoost) algorithm, which improved the detection performance with precision, recall, and accuracy of 100%. We also optimized and employed the deep learning ResNet101 to distinguish the small cell cancer from non-small cell lung cancer and obtained the 100% performance with these evaluation performance measures. The results revealed that proposed approach is more robust than traditional ML algorithms. Based on these results, the proposed methodology can be very helpful in the early detection and treatment of lung cancer for better diagnosis system.
Introduction
According to the recent statistics of lung cancer in 2022 (Siegel et al. Citation2022), there were about 2.36 million new cases of lung cancer expected for diagnosis and out of them 85% belongs to on-small cell lung cancer. The non-small cell lung cancer (NSCLC) is diagnosed using stereotactic body radiotherapy (SBRT) and radiofrequency (RF). Lung cancer has two subtypes such as small cell lung carcinoma (SCLC) and NSCLC. Both types have different methods for treatment and spreading. NSCLC is different from SCLC and slowly grows. While SCLC is growing rapidly related to smoking and spread in whole body quickly and forms tumor. The lung cancer deaths are due to the number of cigarette smoked (Moldovanu, de Koning, and van der Aalst Citation2021).
The SCLC is directly linked with cigarette smoked and aggressive type of lung cancer. The increasing evidence of SCLC are linked to autocrine growth loops, proto-oncogenes, and tumor-suppressor genes in its development. Therefore, SCLC have different methods for treatment and diagnosis than NSCLC. The NSCLC early detection can be very helpful with survival rate of 35%–85% depend on the stage and tumor type. Usually, most of the tumor are late detected so overall 5-year survival rate for NSCLC remains 16% only. Chemotherapy is utilized for SCLC which provokes 60% of response for NSCLC patients. Thus, in respones the cancer returns within few months resulting abysmal overall 5-year survival rate of 6%. The excessive tobacco uses, and smoking causes the lung cancer around 90% cases. Other factors that may lead to lung cancer include air pollution exposures, radon gas, asbestos, and chronic infections. In addition, many hereditary and there have been suggested both inherited and acquired mechanisms of lung cancer susceptibility. Radiation therapy, surgery, targeted therapy, and chemotherapy are also choices for lung cancer treatment (Zang et al. Citation2021).
As radiation and X-rays were discovered at the end of the 19th century, physicians used these results to examine the human body and approaches to non-surgical cancer treatment came along. Hospital radiologists and surgeons started working together and with the use of computers, significant cancer data began to accumulate in 1968. For the past 50 years, considerable effort has been spent in this field. Tests or imagining modalities typically conducted to evaluate the stage of lung cancer some of them are computed tomography (CT), this is the process that includes the detailed pictures of the anatomy and lung tumor and are precarious for treatment planning. For cancer staging, CT scans of the chest are essential and the abdominal CT scan is used for locating secondaries and metastases (Kemps et al. Citation2021). Positron emission tomography (PET) scan uses radioactive sugar as cancer cells rapidly uses sugar and is essential for the identification of spread to lymph nodes or other organs (Zhang et al. Citation2021). One of the best currently available scans is magnetic resonance imaging (MRI) scan that is used for the scanning of brain. Scanning of brain may be necessary to decide the propagation of tumor in brain (Hamdeni et al. Citation2018).
X-rays are used to gain functional and structural details about the human body. The radiation dose reduces the quality of the CT image Experts can describe and analyses the findings of various machine learning (ML) techniques that are useful for lung cancer prognosis and prediction (Kourou et al. Citation2015). ML techniques generally helps to improve the performance or predictive precision of maximum predictions, specifically when they compared with expert-based systems or traditional statistical. Computer-aided diagnosis systems have been developed for the characterization and identification of a variety of lesions in the field of lung cancer diagnosis. The system overcomes the challenge of developing a computer-based system for extracting full features from segmented suspicious regions in X-ray images of the lungs, and these assets can be used directly from the images to classify lung tumors as benign or malignant (Mridha et al. Citation2022). The imaging modalities or tests are widely used to assess the stage of lung cancer: CT scans of the chest and abdomen, which provide accurate images of the lung tumor and anatomy and are useful in care planning. CT scans of the chest are critical for cancer staging, and CT scans of the abdomen are used to identify secondary tumors and metastases. Since cancer cells use sugar quickly, a PET scan that uses radioactive sugar is useful for detecting spread to lymph nodes or other organs.
Recently, there are many applications of ML algorithms for medical diagnostics systems and improving prediction of lung disease. For computing the features importance, there exists the standard toolkits recently developed utilized by Liang et al. (Citation2022). More recently, researchers (Shahbandegan et al. Citation2022) developed the ML algorithms to predict the patient for CT exam in emergency department (ED). The proposed approach can be helpful for ED to allocate resources to prompt actions and to maintain the patient flow and to reduce the overcrowding. Recently, Binson, Subramoniam, and Mathew (Citation2021a, Citation2021b) developed electronic nose (e-nose) to distinguish the chronic obstructive pulmonary disease (COPD) from healthy subjects by recognizing the presence of volatile organic compounds amount. The authors (Freitas et al. Citation2021) used liquid biopsy to diagnose and detection of lung cancer by focusing the circulating cell-free DNA, tumor cells, tumor-derived exomes, micro-RNAs, tumor-educated platelets, for its applicability in future clinical practices. The different combination of biomarkers along with several other computational tools can provide very good diagnosis and prognosis of lung cancer. The researchers (Lener et al. Citation2021) used blood cadmium level as a marker to detect the lung cancer especially in former smokers. The authors (Hsu et al. Citation2021) utilized ML methods with feature extraction and selection to detect the lung cancer for improving the electronic healthcare record to improve the diagnosis and treatment of the individuals. The researchers (Pradhan and Chawla Citation2020) summarizes the lung cancer datasets and ML techniques for improving the lung cancer prediction in the clinical internet of things (IoT) environment. The proposed methods can be helpful for early diagnosis to timely detect the lung cancer patients precisely. The authors (Binson, Subramoniam, and Mathew Citation2021c; Pradhan and Chawla Citation2020) developed an e-nose system to analyze the exhaled breath to classify exhaled breath from healthy patients and patients suffered from COPD, lung cancer, and asthma using SVM, XGBoost, and ensemble methods. The ML methods have successfully been utilized since very long decades ago in analysis of different disease pathologies such as brain levels of polyamines and histamine in various extreme exposures as utilized by Goroshinskaia et al. (Citation1987).
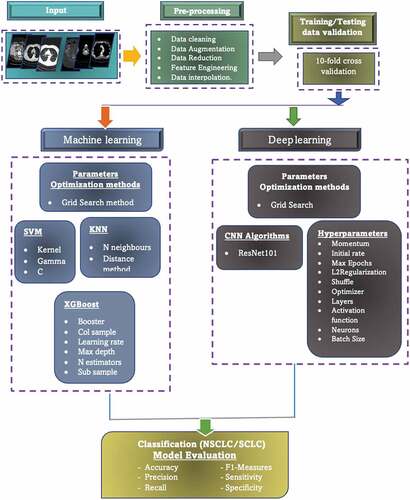
shows the schematic diagram to detail the flow of our model. In the first step, the lung dataset was fed as input and applied the preprocessing on the input images, such as data cleaning, augmentation, reduction, interpolation, feature engineering, etc. In the second phase, training/testing data were utilized using 10-fold cross validation. In the third phase, the machine leaning algorithms along with deep learning methods were utilized by optimizing the hyperparameters using grid search method. For ML, we first extracted the level co-occurrence matrix (GLCM) and Haralick texture features as the standard and widely used texture features for medical imaging diagnosis and then fed to traditional ML SVM and k-nearest neighbor (KNN) algorithms. We then fed the GLCM features to XGBoost with and without the hyperparameters optimization. Finally, we applied the deep learning ResNet101 method with transfer learning approach and optimizing the hyperparameters with grid search method.
Figure 1. Schematic diagram to reflect the flow of work to detect lung cancer using XGBoost algorithm and deep learning ResNet101 with hyperparameter tuning.
Materials and Methods
Dataset
In this study, we utilized first dataset lung cancer dataset publicly provided by Lung cancer Alliance (LCA) utilized previously by Hussain et al. (Citation2019) of CT images. LCA is nonprofit organization which provides patients advocacy and support exclusively suffering with lung cancer or at risk. The database was in DICOM format and there were 76 patients including total 945 images of which 568 belongs to SCLC and 377 to NSCLC subjects.
The second dataset was taken to distinguish the pneumonia (i.e. bacterial and viral) lung infection from normal chest X-rays (CXE). The chest X-ray images of pneumonia (N = 3863) and X-ray images of normal (healthy) (N = 1525) were taken from the Kaggle repository (https://www.kaggle.com/paultimothymooney/chest-xray-pneumonia) and the NIH dataset (https://www.kaggle.com/nih-chest-xrays/data).
Pre-Processing
Following image pre-processing methods were utilized on lung cancer images.
Image Resize
We used “inter area” is a type of interpolation that is used to resize images in a way that produces smooth, accurate results. In computer vision, interpolation is a method of estimating the value of a pixel in an image based on the values of surrounding pixels (Hashemzadeh, Asheghi, and Farajzadeh Citation2019). The “inter area” option specifies that the interpolation should be performed using the area-based method. In the area-based method, the value of the pixel is calculated based on the average value of the pixels in the area surrounding it. This method is typically used for resizing images, where the goal is to reduce the size of the image by reducing the number of pixels. Because the area-based method considers the values of multiple pixels, it can produce smoother, more accurate results than other interpolation methods.
Data Augmentation
Data augmentation is a method of creating additional data samples from existing ones in order to artificially increase the size of a dataset (Shorten and Khoshgoftaar Citation2019). This can be useful when training ML models, especially when the available dataset is small or not representative of the problem being addressed. There are various techniques for data augmentation, including adding noise to the data, applying transformations to the data, and generating synthetic data by combining or modifying existing samples. Data augmentation can improve the generalization of a model by introducing variations in the training data that the model may encounter in the real world and can also help prevent overfitting.
Hyperparameters Optimization
The learning process is a crucial aspect of any model. Before this process begins, certain parameters that have a direct impact on the model and are external to it, known as hyperparameters, need to be set (Bengio Citation2000). XGBoost and ResNet101 also have their own set of hyperparameters that can be adjusted or fine-tuned to improve performance. Some of particularly significant hyperparameter is discussed below:
As the depth of the model increases, its performance also improves, but there is a risk of overfitting and complexity. The max_depth value is typically set to 6, but it is important to ensure that it is a positive integer.
The learning rate, a key hyperparameter, helps to reduce error and better approximate the model’s objectives. A higher learning rate may not necessarily lead to optimal results, while a lower rate may take longer to process but offer a higher probability of optimal results. The learning rate is typically set between 0 and 1, with a common value being 0.3.
XGBoost will learn a total of n_estimators trees during the boosting rounds of the learning process.
The colsample_bytree hyperparameter is set to a value between 0 and 1, with a typical setting being 1. This determines the percentage of columns that are randomly selected for each tree during the training process.
The hyperparameter “colsample_bytree” is a value that ranges between 0 and 1, with a default value of 1. It determines the fraction of observations that will be used for each tree during the learning process. Setting a low value (close to 0) may help prevent overfitting, but there is a risk of underfitting.
Tools, Languages and Libraries
In this study, we used the ML XGBoost and deep learning ResNet101 algorithms using google co-lab and optimized the hyperparameters of these algorithms using grid search method. The libraires for each model are reflected below:
Grid Search
Grid search is a method for hyperparameter optimization in ML (Bao and Liu Citation2006). It involves specifying a grid of hyperparameter values, and then training and evaluating a model for each combination of these values. The goal is to find the combination of values that results in the best performance of the model.
Here is the procedure for performing a grid search:
Define a grid of hyperparameter values to search over. This can be done by specifying a list of values for each hyperparameter.
Train and evaluate a model for each combination of hyperparameter values. This can be done using a loop over the values in the grid.
Select the combination of hyperparameter values that resulted in the best performance of the model, as measured by a performance metric such as accuracy or F1-score.
Hand-Crafted Features Extraction
In this study, we first extracted hand-crafted features such as GLCM and Haralick texture features as detailed (Asim et al. Citation2018; Hussain Citation2018; Hussain et al. Citation2018, Citation2019, Citation2020, Citation2021).
Feature Extraction
In ML, the feature engineering is highly desired and require knowledge specific to the problem. Researchers computed different imaging related features to capture the most relevant information. The author (Rathore, Hussain, and Khan Citation2015) computed the hybrid features to detect the colon cancer. Hussain et al. and coworkers extract the texture, morphological, elliptic Fourier descriptors (EFDs), scale invariant feature transform, and entropy-based features to detect the prostate cancer, breast cancer, brain tumor, and lung cancer (Hussain et al. Citation2018, Citation2019; N. Rathore et al. Citation2014, Citation2014; Rathore, Hussain, and Khan Citation2015). The texture gray level co-occurrence matrix (GLCM) features extended version of texture features which further improved the detection performance, so in this research, the GLCM features were computed from lung cancer imaging datasets.
Gray Level Co-Occurrence Matrix (GLCM) Features
The GLCM features are computed and most wide used second order statistical tool to extract relevant information from the image. These features extract the texture properties, spatial relationship from an image pixel. The GLCM features made four directions 0°, 45°, 90°, and 135° as detailed in Kairuddin and Mahmud (Citation2017). We computed contrast, autocorrelation, cluster prominence, correlation, cluster shades, energy, dissimilarity, homogeneity, entropy, maximum probability, sum average, sum of squares, sum variance, difference variance, sum entropy, difference entropy, Information measures of correlation-1 & II, inverse difference normalized, and inverse difference moment normalized (Kairuddin and Mahmud Citation2017).
We first applied the traditional ML algorithms including KNN and support vector machine (SVM) (Asim et al. Citation2018; Hussain Citation2018; Hussain et al. Citation2018, Citation2019, Citation2020, Citation2021). We then optimized the hyperparameters of ML ensemble method eXtreme boosting (XGBoost).
eXtreme Boosting (XGBoost) Algorithm
This algorithm was proposed by Chen and Guestrin (Citation2016) is a supervised MLalgorithm which implement a boosting process for yielding accurate models. The predictive model on labeled training examples is applied on new unseen examples. The boosting is an ensemble learning method utilized to build many models sequentially, where each model is going to attempt for correcting shortages in the preceding model. XGBoost is a core boosting tree algorithm which build many models sequentially, where each new model is trying to correct the deficiencies in the previous model (Friedman Citation2001). The XGBoost extends the generalized gradient boosting by including the regularization term to combat overfitting and to support the arbitrary differentiable loss function. These properties made the XGBoost more robust in improving the lung cancer detection performance.
The gradient boosting is divided into two parts by optimization for the sake of optimization step and step direction.
But the XGBoost solve,
For every x in data to directly fix the step. We have,
Using the second order Taylor expansion by expending loss function, where is gradient and
is Hessian.
, here
.
Then, loss function can be rewritten as:
In region j, lets denotes sum of gradient and the sum of Hessian is represented by
, then equation will be,
The optimal value can be computed using below function:
We get loss function when we plug it back:
The tree structure is marked using this function. The lesser the score indicates better structure (Chen and Guestrin Citation2016). The maximum gain for every split is:
which is,
To improve the performance, the loss function can be rewritten below by keeping in mind the regularization criteria:
where penalizes the number of leave, α denotes L1 regularization while λ denotes L2 regularization. The optimal weight can calculate for each region j as:
And the gain is,
where,
The XGBoost classifier is very important because it has more randomization and regularization options learning process, it is faster and easy to use. We used the following hyperparameters:
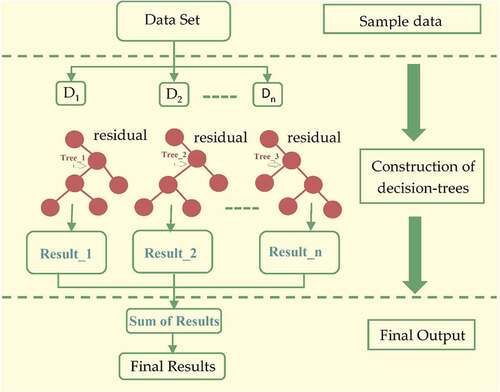
To summarize, the challenge of optimizing the main function is reduced to identifying the minimum of a quadratic function. Due to the addition of regularization phenomena, XGBoost has a stronger capability to avoid overfitting. The structure of XGBoost can be seen in .
Figure 2. General architecture of XGBoost algorithm.
Deep Learning
In the second approach, the deep learning ResNet101 model was utilized with transfer learning approach. The deep learning methods yielded good performance, but require high computational resources as detailed below:
Transfer Learning Approach
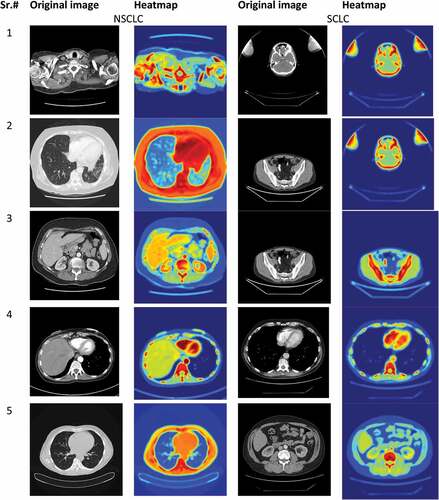
We applied the transfer learning approach; this means the networks such as ResNet101 of Convolution Neural Network was pre-trained on a large dataset. The network ResNet101 consisted of inception layers, convolution layers and fully connected layers. In this case, the ImageNet dataset consisting of 14 million image was used to pre-train the network. This initial training helps the first layer to find extremely generatable features from bigger dataset; later layers of the network take on specifics of smaller dataset for the adaptive model. We used ResNet101 in our study, described in the below section. The convolutional neural networks require high computational resources as very high operations are performed for performing convolution and pooling operations for computing low level, mid-level and high-level features, weight filters, weight channels. The reflects the heatmap of few selected images to distinguish Lung cancer NSCLC from SCLC i.e. original image samples along with heatmaps. For example, if we have pooling with filter 512, then memory and parameters computed as depicted below:
Figure 3. Lung cancer NSCLC and SCLC original image samples along with heatmaps.
Resnet 101
The ResNet model was proposed by He et al. (Citation2016) in 2016 an abbreviation of residual network. This method is used in diverse applications medical imaging, pattern recognitions, computer vision etc. The CNN comprised of multiple layers interconnected to each other in specific manner and trained for performing various tasks (Sun et al. Citation2017). There are 104 convolutional layers with 33 filters (blocks), one filter for each layer respectively. The residual connection, 9 out of 33 layers use directly the previous layer output. The residual connections are used as operand for summation operations. The four remaining layers receive output of previous block as an input and apply to convolutional layer with filter size of 1 × 1 and a stride of 1, followed by a group of normalization layers.
Performance Evaluations Measures
The performance was evaluated using standard performance evaluation measures and training and testing data formulation were employed using split method and 10-fold cross validation (CV) (Divya Rathore and Agarwal Citation2014; Hussain et al. Citation2019; Rathore et al. Citation2013, Citation2014; Rathore, Hussain, and Khan Citation2015). ML and deep learning techniques are evaluated using standard performance metrics such as accuracy, precision, recall, and F1-score to measure their effectiveness and efficiency in solving a given task. F1-measure is the harmonic mean of precision and recall metrics. Precision has been widely used as measure to evaluate the performance of information retrieval techniques and it refers to the fraction of retrieved documents that are relevant. Following standard performance evaluation metrics are utilized (Jalil et al. Citation2022):
Precision
Recall
Recall (R) is the fraction of relevant documents that are retrieved and are obtained:
F-measure
For the computation of F1-measure, each record is considered as if it is the result of a query and each class as if it is the desired set of documents for a query, then recall and precision of that record for each given class are calculated. The F1-measure of record and class
is defined as follows:
Results and Discussions
This study is specifically conducted to improve the lungs cancer detection by first extracting hand-crafted features such as GLCM texture features. We fed these features as input to traditional ML algorithms; we then optimized the hyperparameters of ensemble XGBoost and ResNet101.
reflect the lung cancer prediction based on GLCM features and employing traditional supervised ML algorithms. In using SVM, the overall test accuracy was yielded as 83.0%. The NSCLC yielded precision (83.0%), recall (69.0%), and F1-score (75.0%) and SCLC with precision (82.0%), recall (91.0%), and F1-score (81.0%).
Table 1. Binary (NSCLC, SCLC) classification using traditional ML SVM algorithm with 10-fold cross validation.
Table 2. Binary (NSCLC, SCLC) classification using traditional ML KNN algorithm with 10-fold cross validation.
In using KNN, the overall test accuracy was yielded as 97.0%. The NSCLC yielded precision (97.0%), recall (98.0%), and F1-score (97.0%) and SCLC with precision (97.0%), recall (98.0%), and F1-score (97.0%).
reflect the performance using XGBoost with default parameters. The training accuracy of 99.72% and testing accuracy of 99.45% was yielded. The performance for class 0 was obtained with precision (100%), recall (99.0%), and F1-score (99.0%), whereas for class 1 the performance obtained was precision (99.0%), recall (100%), and F1-score (100%).
Table 3. Lung cancer detection performance utilizing XGBoost with default parameters.
reflects the lung cancer detection performance utilizing the XGBoost algorithm on GLCM features and optimizing the hyperparameters. The highest performance with 100%, precision, recall, F1-score and training and testing accuracy was yielded.
Table 4. Lung cancer detection performance utilizing XGBoost with hyperparameters optimization.
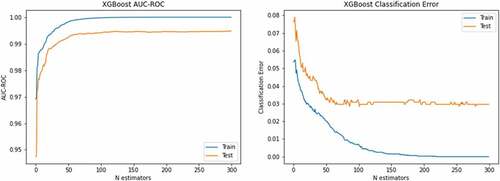
left side depicts the AUC-ROC of 1.0 for both training and testing data using XGBoost with optimized hyperparameters and right-side corresponding classification error. The blue color reflect training data, and red color indicates the testing data. The ROC and PR curves to detect lung cancer are reflected in . The show the accuracy-loss graph for binary (NSCLC, SCLC) classification: (a) accuracy graph, (b) loss graph by utilizing the ResNet101 model with 10-fold cross validation.
Figure 4. AUC-ROC and error graph to detect the lung cancer using XGBoost.
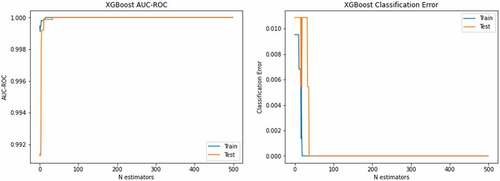
Figure 5. ROC and PR curves to detect lung cancer.
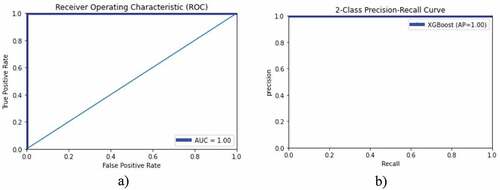
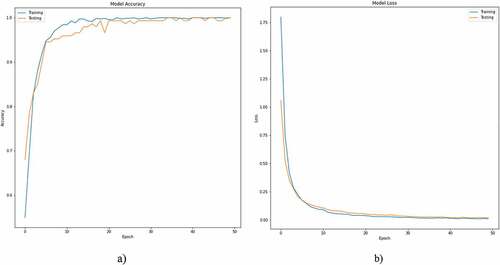
Figure 6. Accuracy-loss graph for binary (NSCLC, SCLC) classification: (a) accuracy graph, (b) loss graph using ResNet101 model with 10-fold cross validation.
We also applied the XGBoost using second dataset to distinguish the lung infection (pneumonia) from normal chest X-rays by first extracting the GLCM features and applying the robust XGBoost algorithm. The chest X-ray images of pneumonia (N = 3863) and X-ray images of normal (healthy) (N = 1525) were taken. Where bacterial pneumonia (N = 2521) and viral pneumonia (N = 1342) were taken. presents the classification accuracy of bacterial lung infection with normal chest X-rays. The training accuracy of 100%, test accuracy of 97.04, AUC (0.99) were yielded. The AUC-ROC accuracy and error graph is reflected in , whereas ROC and PR curves are reflected in .
Table 5. Binary-class (NSCLC, SCLC) classification using ResNet101 model with 10-fold cross validation.
Table 6. Binary (NSCLC, SCLC) classification using ResNet101 model at selected twofold cross validation.
Table 7. Binary (NSCLC, SCLC) classification using ResNet101 model at selected fourfold cross validation.
Table 8. Binary (NSCLC, SCLC) classification using ResNet101 model at selected eightfold cross validation.
Table 9. Bacterial lung cancer detection performance utilizing XGBoost using optimized hyperparameters.
reflect the binary (NSCLC, SCLC) classification using ResNet101 with 10-fold cross validation. The overall test accuracy was yielded as 100%. The NSCLC detection yielded the detection with precision (100%), recall (100%), and F1-score (100%) and SCLC with precision (100%), recall (100%), and F1-score (100%). The macro and weighted average for each performance metrics were obtained as 100%.
reflect the binary (NSCLC, SCLC) classification using ResNet101 with twofold cross validation. The overall test accuracy was yielded as 100%. The NSCLC detection yielded the detection with precision (100%), recall (100%), and F1-score (100%) and SCLC with precision (100%), recall (100%), and F1-score (100%). The macro and weighted average for each performance metrics were obtained as 100%.
reflect the binary (NSCLC, SCLC) classification using ResNet101 with fourfold cross validation. The overall test accuracy was yielded as 100%. The NSCLC detection yielded the detection with precision (100%), recall (100%), and F1-score (100%) and SCLC with precision (100%), recall (100%), and F1-score (100%). The macro and weighted average for each performance metrics were obtained as 100%.
reflect the binary (NSCLC, SCLC) classification using ResNet101 with eightfold cross validation. The overall test accuracy was yielded as 99%. The NSCLC detection yielded the detection with precision (100%), recall (96%), and F1-score (98%) and SCLC with precision (98%), recall (100%), and F1-score (99%). The macro and weighted average for each performance metrics were obtained as 99%.
reflects the (a) accuracy, (b) loss curve of training and testing data for 50 epochs using ResNet101 to distinguish the NSCLC from SCLC subjects. After 20 epochs the accuracies and loss curves remain almost the constant.
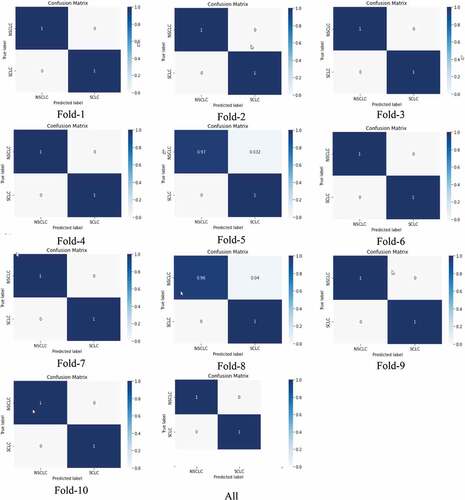
shows the confusion matrix from fold 1 to 10. Except fold 5 and fold 8, the predictions were 100%.
Figure 7. Confusion matrix for binary (NSCLC, SCLC) classification using ResNet101 model at different folds from 1 to 10 k-fold cross validation.
reflect the bacterial vs normal subjects, the bacterial performance was yielded with precision (98.0%), recall (97.0%), and F1-score (98.0), whereas for normal, the performance was yielded with precision (97.0%), recall (97.0%), and F1-score (97.0).
shows the (a) ROC curve, and corresponding (b) precision–recall curve to distinguish the bacterial from normal lungs using XGBoost algorithm. An AUC of 0.99 was obtained (%). The corresponding accuracy and loss curve is represented in .
Figure 8. AUC-ROC and error graph to detect the bacterial lung cancer using XGBoost.
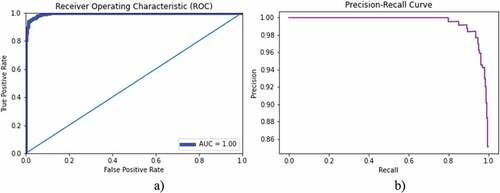
presents the classification accuracy of bacterial lung infection with normal chest X-rays. The training accuracy of 100%, test accuracy of 96.16, and AUC (1.00) were yielded. The AUC-ROC accuracy and error graph is reflected in , whereas ROC and PR curves are reflected in .
Figure 9. ROC and PR curves to detect bacterial lung cancer.
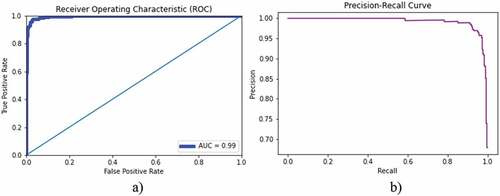
Table 10. Viral lung cancer detection performance utilizing XGBoost using optimized hyperparameters.
Figure 10. ROC and PR curves to detect viral lung cancer.
shows the binary class (viral, normal) classification using ResNete101 with 10-fold cross validation. A 100% prediction performance was yielded as reflected in . The comparison of results with other studies is reflected in .
Table 11. Viral lung cancer detection performance utilizing ResNet101 with 10-fold cross validation.
reflects the (a) accuracy, (b) loss curve of training and testing data for 200 epochs using ResNet101 to distinguish the viral from normal subjects.
Figure 11. Accuracy-loss graph for binary (viral, normal) classification: (a) accuracy graph, (b) loss graph using ResNet101 model with 10-fold cross validation.
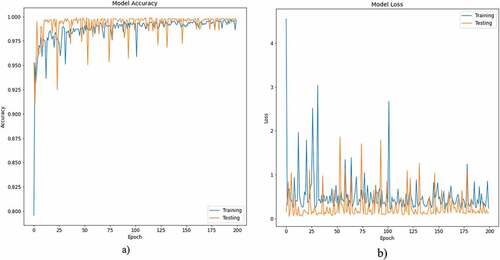
Table 12. Comparison of findings from previous studies.
We proposed XGBoost and optimized the hyperparameters in order to improve the lung cancer detection performance by extracting hand-crafted GLCM features. We also compared the results with traditional ML algorithms. Previously, there are few studies which yielded performance up to 95% on different extracted features using traditional ML techniques. However, the performance can be improved by applying and optimizing the hyperparameters of more robust algorithms. The XGBoost algorithm improved the detection performance than other traditional methods. We also utilized the deep learning ResNet101 algorithm with transfer learning approach and optimized the hyperparameters. The ResNet101 also improved the detection performance. The first LCA dataset was small, so to check the validity of our proposed algorithms, we applied the XGBoost and ResNet101 on another larger dataset of lung infections to distinguish the normal lungs from community infected bacterial and viral pneumonia lungs and consistent results were yielded.
Conclusions
Lung cancer is the deadliest cancer with lowest survival rate. Majority of the countries have incidence of deaths multiplied unexpectedly. The researchers are trying to develop artificial intelligence tools to improve the prediction performance. Mostly, the traditional ML methods have limitations which are not much appropriate for more nonlinear and complex problems. In this study, we proposed ensemble XGBoost and ResNet101 algorithms to distinguish the NSCLC from SCLC by optimizing the hyperparameters. We also compared the results with traditional ML methods. The results reveals that proposed model due to its robust performance and functionality improved the prediction performance. Based on these results, the proposed methodology can be very helpful in the early detection and treatment of lung cancer, with the potential to decrease mortality rate and increase survival rate. Currently, we have not clinical information of the patients, in future we will apply the proposed models to larger dataset for detecting the survival, recurrence and disease severity.
Acknowledgement
This study is supported via funding from Prince Sattam Bin Abdulaziz University project number PSAU/2023/R/1444. The author would like to thank the Deanship of Scientific Research at Shaqra University for supporting this research.
Disclosure Statement
No potential conflict of interest was reported by the authors.
Correction Statement
This article has been republished with minor changes. These changes do not impact the academic content of the article.
References
- Asim, Y., B. Raza, A. K. Malik, S. Rathore, L. Hussain, and M. A. Iftikhar. 2018. A multi-modal, multi-atlas-based approach for alzheimer detection via machine learning. International Journal of Imaging Systems and Technology 28 (2):113–1696. doi:10.1002/ima.22263.
- Bao, Y., and Z. Liu. 2006. A fast grid search method in support vector regression forecasting time series. Lecture Notes in Computer Science 504–11. doi:10.1007/11875581_61.
- Bengio, Y. 2000. Gradient-based optimization of hyperparameters. Neural computation 12 (8):1889–900. doi:10.1162/089976600300015187.
- Binson, V. A., M. Subramoniam, and L. Mathew. 2021a. Detection of COPD and lung cancer with electronic nose using ensemble learning methods. Clinica Chimica Acta 523:231–38. doi:10.1016/j.cca.2021.10.005.
- Binson, V. A., M. Subramoniam, and L. Mathew. 2021b. Discrimination of COPD and lung cancer from controls through breath analysis using a self-developed e-nose. Journal of Breath Research 15 (4):046003. doi:10.1088/1752-7163/ac1326.
- Binson, V. A., M. Subramoniam, and L. Mathew. 2021c. Noninvasive detection of COPD and lung cancer through breath analysis using MOS sensor array based e-nose. Expert review of molecular diagnostics 21 (11):1223–33. doi:10.1080/14737159.2021.1971079.
- Chen, T., and C. Guestrin. 2016. Xgboost. Proceedings of the 22nd ACM SIGKDD International Conference on Knowledge Discovery and Data Mining, 785–94. 10.1145/2939672.2939785
- Dandıl, E. 2018. A computer-aided pipeline for automatic lung cancer classification on computed tomography scans. Journal of Healthcare Engineering 2018:1–12. doi:10.1155/2018/9409267.
- da Silva Sousa, J. R. F., A. C. Silva, A. C. de Paiva, and R. A. Nunes. 2010. Methodology for automatic detection of lung nodules in computerized tomography images. Computer Methods and Programs in Biomedicine 98 (1):1–14. doi:10.1016/j.cmpb.2009.07.006.
- Divya Rathore, N., and S. Agarwal. 2014. Predicting the survivability of breast cancer patients using ensemble approach. 2014 International Conference on Issues and Challenges in Intelligent Computing Techniques (ICICT), 459–64. 10.1109/ICICICT.2014.6781326
- Freitas, C., C. Sousa, F. Machado, M. Serino, V. Santos, N. Cruz-Martins, A. Teixeira, A. Cunha, T. Pereira, H. P. Oliveira, et al. 2021. The role of liquid biopsy in early diagnosis of lung cancer. Frontiers in Oncology 11. doi:10.3389/fonc.2021.634316.
- Friedman, J. H. 2001. Greedy function approximation: A gradient boosting machine. Annals of Statistics 29 (5):1189–232. doi:10.1214/aos/1013203451.
- Goroshinskaia, I. A., E. Z. Tsvetnenko, M. L. Frenkel’, A. A. Khodakova, and A. A. Krichevskaia. 1987. Monoamine oxidase activity and brain levels of histamine and polyamines in various extreme exposures. Ukrainskii biokhimicheskii zhurnal 59 (2):84–86. 1978. http://www.ncbi.nlm.nih.gov/pubmed/3576728.
- Guo, W., Y. Wei, H. Zhou, and D. Xue. 2009. An adaptive lung nodule detection algorithm. 2009 Chinese Control and Decision Conference, 2361–65. 10.1109/CCDC.2009.5192686
- Hamdeni, T., F. Fnaiech, S. Gasmi, J. M. Ginoux, R. Naeck, M. Bouchouicha, A. Ben Khedher Zidi, and F. Tshibasu. 2018. Overview and definitions on lung cancer diagnosis. Middle East Conference on Biomedical Engineering, MECBME 165–70. March. 2018. doi:10.1109/MECBME.2018.8402427.
- Hashemzadeh, M., B. Asheghi, and N. Farajzadeh. 2019. Content-aware image resizing: an improved and shadow-preserving seam carving method. Signal Processing 155 (7):233–46. doi:10.1016/j.sigpro.2018.09.037.
- He, K., X. Zhang, S. Ren, and J. Sun. 2016. Deep residual learning for image recognition. IEEE Conference on Computer Vision and Pattern Recognition, 64(770–778). doi:10.1109/CVPR.2016.90.
- Hsu, C. -H., X. Chen, W. Lin, C. Jiang, Y. Zhang, Z. Hao, and Y. -C. Chung. 2021. Effective multiple cancer disease diagnosis frameworks for improved healthcare using machine learning. Measurement 175:109145. doi:10.1016/j.measurement.2021.109145.
- Hussain, L. 2018. Detecting epileptic seizure with different feature extracting strategies using robust machine learning classification techniques by applying advance parameter optimization approach. Cognitive Neurodynamics 12 (3):271–94. doi:10.1007/s11571-018-9477-1.
- Hussain, L., A. Ahmed, S. Saeed, S. Rathore, I. A. Awan, S. A. Shah, A. Majid, A. Idris, and A. A. Awan. 2018. Prostate cancer detection using machine learning techniques by employing combination of features extracting strategies. Cancer Biomarkers 21 (2):393–413. doi:10.3233/CBM-170643.
- Hussain, L., M. S. Almaraashi, W. Aziz, N. Habib, and S. -U. -R. Saif Abbasi. 2021. Machine learning-based lungs cancer detection using reconstruction independent component analysis and sparse filter features. Waves in Random and Complex Media 1–26. doi:10.1080/17455030.2021.1905912.
- Hussain, L., I. A. Awan, W. Aziz, S. Saeed, A. Ali, F. Zeeshan, and K. S. Kwak. 2020. Detecting congestive heart failure by extracting multimodal features and employing machine learning techniques. BioMed Research International 2020:1–19. doi:10.1155/2020/4281243.
- Hussain, L., W. Aziz, A. A. A. Alshdadi, M. S. Ahmed Nadeem, I. R. Khan, and Q. -U. -A. Chaudhry. 2019. Analyzing the dynamics of lung cancer imaging data using refined fuzzy entropy methods by extracting different features. IEEE Access 7:64704–21. doi:10.1109/ACCESS.2019.2917303.
- Hussain, L., P. Huang, T. Nguyen, K. J. Lone, A. Ali, M. S. Khan, H. Li, D. Y. Suh, and T. Q. Duong. 2021. Machine learning classification of texture features of MRI breast tumor and peri-tumor of combined pre- and early treatment predicts pathologic complete response. Biomedical Engineering Online 20 (1):63. doi:10.1186/s12938-021-00899-z.
- Hussain, L., S. Rathore, A. A. Abbasi, and S. Saeed. 2019. Automated lung cancer detection based on multimodal features extracting strategy using machine learning techniques. In Medical imaging 2019: physics of medical imaging, ed. H. Bosmans, G.-H. Chen, and T. G. Schmidt, vol. 10948, 134. SPIE. doi:10.1117/12.2512059.
- Hussain, L., S. Saeed, I. A. Awan, A. Idris, M. S. A. A. A. A. A. Nadeem, Q. -A. Chaudhry, Q. -A. Chaudhary, Q. -A. Chaudhry, and Q. -A. Chaudhary. 2019. Detecting brain tumor using machine learning techniques based on different features extracting strategies. Current Medical Imaging Formerly Current Medical Imaging Reviews 14 (1):595–606. doi:10.2174/1573405614666180718123533.
- Jalil, Z., A. Abbasi, A. R. Javed, M. Badruddin Khan, M. H. Abul Hasanat, K. M. Malik, and A. K. J. Saudagar. 2022. COVID-19 related sentiment analysis using state-of-the-art machine learning and deep learning techniques. Frontiers in Public Health 9. doi:10.3389/fpubh.2021.812735.
- Kairuddin, W. N. H. W., and W. M. H. W. Mahmud. 2017. Texture feature analysis for different resolution level of kidney ultrasound images. IOP Conference Series: Materials Science and Engineering, 226, 012136. 10.1088/1757-899X/226/1/012136
- Kemps, P. G., M. Bol, E. J. A. Steller, L. M. H. de Pont, C. Holterhues, L. van Gerven, and W. Kolkman. 2021. Colon carcinoma presenting as ovarian metastasis. Radiology Case Reports 16 (9):2799–803. doi:10.1016/j.radcr.2021.06.072.
- Kourou, K., T. P. Exarchos, K. P. Exarchos, M. V. Karamouzis, and D. I. Fotiadis. 2015. Machine learning applications in cancer prognosis and prediction. Computational and Structural Biotechnology Journal 13:8–17. doi:10.1016/j.csbj.2014.11.005.
- Lener, M. R., E. Reszka, W. Marciniak, M. Lesicka, P. Baszuk, E. Jabłońska, K. Białkowska, M. Muszyńska, S. Pietrzak, R. Derkacz, et al. 2021. Blood cadmium levels as a marker for early lung cancer detection. Journal of Trace Elements in Medicine and Biology 64:126682. doi:10.1016/j.jtemb.2020.126682.
- Liang, P., H. Wang, Y. Liang, J. Zhou, H. Li, and Y. Zuo. 2022. Feature-scML: an open-source python package for the feature importance visualization of single-cell omics with machine learning. Current Bioinformatics 17 (7):578–85. doi:10.2174/1574893617666220608123804.
- Moldovanu, D., H. J. de Koning, and C. M. van der Aalst. 2021. Lung cancer screening and smoking cessation efforts. Translational Lung Cancer Research 10 (2):1099–109. doi:10.21037/tlcr-20-899.
- Mridha, M. F., A. R. Prodeep, A. S. M. M. Hoque, M. R. Islam, A. A. Lima, M. M. Kabir, M. A. Hamid, and Y. Watanobe. 2022. A comprehensive survey on the progress, process, and challenges of lung cancer detection and classification. Journal of Healthcare Engineering 2022:1–43. doi:10.1155/2022/5905230.
- Nasrullah, N., J. Sang, M. S. Alam, and H. Xiang. 2019. Automated detection and classification for early stage lung cancer on CT images using deep learning. In Pattern recognition and tracking XXX, ed. M. S. Alam, 27. SPIE. doi: 10.1117/12.2520333.
- Pradhan, K., and P. Chawla. 2020. Medical internet of things using machine learning algorithms for lung cancer detection. Journal of Management Analytics 7 (4):591–623. doi:10.1080/23270012.2020.1811789.
- Rathore, S., M. Hussain, M. Aksam Iftikhar, and A. Jalil. 2014. Ensemble classification of colon biopsy images based on information rich hybrid features. Computers in Biology and Medicine 47 (1):76–92. doi:10.1016/j.compbiomed.2013.12.010.
- Rathore, S., M. Hussain, A. Ali, and A. Khan. 2013. A recent survey on colon cancer detection techniques. IEEE/ACM Transactions on Computational Biology and Bioinformatics/IEEE, ACM 10 (3):545–63. doi:10.1109/TCBB.2013.84.
- Rathore, S., M. Hussain, and A. Khan. 2015. Automated colon cancer detection using hybrid of novel geometric features and some traditional features. Computers in Biology and Medicine 65:279–96. March. doi: 10.1016/j.compbiomed.2015.03.004.
- Shahbandegan, A., V. Mago, A. Alaref, C. B. van der Pol, and D. W. Savage. 2022. Developing a machine learning model to predict patient need for computed tomography imaging in the emergency department. Plos One 17 (12):e0278229. doi:10.1371/journal.pone.0278229.
- Shorten, C., and T. M. Khoshgoftaar. 2019. A survey on image data augmentation for deep learning. Journal of Big Data 6 (1):60. doi:10.1186/s40537-019-0197-0.
- Siegel, R. L., K. D. Miller, H. E. Fuchs, and A. Jemal. 2022. Cancer statistics, 2022. CA: A Cancer Journal for Clinicians 72 (1):7–33. doi:10.3322/caac.21708.
- Sun, C., A. Shrivastava, S. Singh, and A. Gupta. 2017. Revisiting unreasonable effectiveness of data in deep learning era. In Proceedings of the IEEE international conference on computer vision, Venice, Italy, 843–852.
- Teramoto, A., H. Fujita, K. Takahashi, O. Yamamuro, T. Tamaki, M. Nishio, and T. Kobayashi. 2014. Hybrid method for the detection of pulmonary nodules using positron emission tomography/computed tomography: A preliminary study. International Journal of Computer Assisted Radiology and Surgery 9 (1):59–69. doi:10.1007/s11548-013-0910-y.
- Zang, J., H. Horinouchi, J. Hanaoka, K. Funai, N. Sakakura, and H. Liao. 2021. The role of salvage surgery in the treatment of a gefitinib-resistant non-small cell lung cancer patient: A case report. Journal of Thoracic Disease 13 (7):4554–59. doi:10.21037/jtd-21-171.
- Zhang, Z., S. Zhao, K. Wang, M. Shang, Z. Chen, H. Yang, Y. Chen, and B. Chen. 2021. Identification of biomarkers associated with cervical lymph node metastasis in papillary thyroid carcinoma: evidence from an integrated bioinformatic analysis. Clinical Hemorheology and Microcirculation 78 (2):117–26. doi:10.3233/CH-201074.