
 ?Mathematical formulae have been encoded as MathML and are displayed in this HTML version using MathJax in order to improve their display. Uncheck the box to turn MathJax off. This feature requires Javascript. Click on a formula to zoom.
ABSTRACT
When scale builds up in a transmission pipeline, it narrows the pipe’s interior and causes losses in both power and efficiency. A noninvasive instrument based on gamma-ray attenuation is one of the most reliable diagnostic procedures for determining volumetric percentages in a variety of circumstances. A system with a NaI detector and dual-energy gamma generator simulations (241Am and 133 Ba radioisotopes) is recommended for simulating a volume percentage detection system utilizing Monte Carlo N particle (MCNP). Three-phase flow consisting of oil, water, and gas moves through a scaled pipe of variable wall thicknesses in a stratified flow regime with changing volume percentages. After gamma rays are emitted from one end of the pipe, a detector take in the photons coming from the other end. Four temporal features, including kurtosis and mean value of the square root (MSR), skewness, and waveform length (WL) picked up by the detector, were thus obtained. By training two GMDH neural networks with the aforementioned inputs, it is possible to forecast volumetric percentages with an RMSE of less than 0.90 and independently of scale thickness. The low error value, simplicity of the system, and reduction of design costs ensures the effectiveness of the suggested method and the advantages of employing this approach in the petroleum and petrochemical industries.
Introduction
Several problems have arisen in oil fields all around the globe as a consequence of scale building in oil pipelines. Scale formation reduces the effective cross-sectional area of the pipeline, which impedes the flow of petroleum products. This part prevents pumps and other gear from working properly. When scale builds up in the pipeline and is not detected in time, it may lead to catastrophic breakdowns, broken oil equipment, high repair and maintenance bills, and decreased efficiency. Therefore, when things are on a larger scale, using a control system with features like volume percentage detection is really beneficial. Many studies (Nazemi et al. Citation2016; Roshani et al. Citation2021; Sattari et al. Citation2021) have used gamma-ray attenuation systems as the benchmark for determining how to quantify the various features of a two-phase flow. The following are some of the benefits associated with using neural networks in oil and gas indicators: Increasing accuracy in determining various parameters, less specialized statistical training is needed, complicated nonlinear correlations between dependent and independent variables can be detected implicitly, and all conceivable interactions between predictor variables can be identified, and different training techniques are at your disposal. A cesium source, two sodium iodide detectors, and a test pipe were utilized in the experiment described in (Nazemi et al. Citation2016). Through the use of the RBF neural network and the counts acquired by two detectors, they were able to model two-phase flow in a stratified, bubbly, and annular configuration. Using these counts, they were able to make volume estimates and classify flow patterns. Roshani and his coworkers (Roshani et al. Citation2021) used GMDH-type artificial neural networks trained on the imbalanced data to determine the flow regime and volume percentages. They justified the massive computing overhead by pointing to the system’s outstanding accuracy. While Roshani et al. (Roshani, Nazemi, and Feghhi Citation2016) used a NaI detector and cobalt-60 source to develop a system that could detect the flow regime and volumetric percentage, the parameters were not precisely calculated due to the incorrect characteristics being extracted. Modern predictions of the volumetric fraction of a three-phase flow in the stratified regime were made using the Jaya optimization method (Roshani, Karami, and Nazemi Citation2019). Peyvandi et al. (Peyvandi and Rad Citation2017) presented a unique framework to calculate the volume percentage of each component in a three-phase flow from just one pipe side. The gamma rays reflected from an item were measured using a NaI detector positioned nearby a Cs source. Hanus et al. (Hanus et al. Citation2016a, Citation2016b) investigated time and frequency-domain features to determine the flow structure under dynamic circumstances. The studies included two 241Am sources and a single scintillation detector. Three different water-air fluxes were identified: a plug, a bubble, and a transitional plug bubble. Hanus et al. (Hanus et al. Citation2018) used time-domain data in combination with a different form of the neural network to determine the flow regime. ANN and PCA were used to determine the flow regime type in a study described in (Hanus et al. Citation2017).To improve ANN’s performance, principal component analysis was utilized to narrow the focus to fewer relevant features. The use of artificial neural networks to solve the gamma gauging issue has been the subject of many studies in recent years (Salgado et al. Citation2016, Citation2020). Salgado and colleagues (Salgado et al. Citation2009, Citation2010)used an MLP neural network to classify flow regimes and estimate volume fraction. Simulations of annular and homogeneous flows were performed at different volumes by Khayat et al. A root mean square error of less than 1.28 was achieved after testing many MLP ANN topologies for distinguishing between flow regime types and calculating volumetric percentages (Khayat and Afarideh Citation2019). Two sodium iodide detectors, a cesium source, and a test pipe were utilized by Sattari and colleagues to establish a system for accurate volume percentage computation and flow regime classification (Sattari et al. Citation2021). In subsequent studies, the researchers (Alamoudi et al. Citation2021; Sattari et al. Citation2020) investigated the feasibility of using GMDH neural networks to identify varying flow regimes and predict volume fractions. Although the volume percentage was determined with high accuracy in these investigations, the amount of scale in the pipe was ignored. The thickness of the scale in the oil pipe is measured in (Alamoudi et al. Citation2021) using a dual energy source consisting of Ba-133 and Cs-137. After simulating the two-phase flow in different regimes, data from the Ba-133 and Cs-137 gamma peaks from the first transmission photon detector and the total number from the second scattered photon detector were used as inputs to the RBF neural network. Their analysis culminated in a prediction of scale thickness with an RMSE of less than 0.22. Scale layer in the oil pipe was measured in a recent study employing a dual energy source of Ba-133 and Am-241. After simulating the three-phase flow in annular regimes, they suggested using the photopeaks of Ba-133 and Am-241 from two transmission detectors as inputs to the RBF neural network. Finally, they were able to estimate the thickness of scales with an RMSE of less than 0.09 (Taylan et al. Citation2021). Issues, such as transportation difficulties and the necessity for personnel to wear safety gear, arise when using radioisotopes as the basis for an always-on power source. As a consequence, there has been considerable interest in exploring the potential of X-ray tubes as a tool for measuring the properties of multiphase flows. Researchers in (Basahel et al. Citation2021) determined the regime type and volumetric percentage of two-phase flows using an X-ray tube and a NaI detector. Two multilayer perceptron neural networks were trained using the temporal attributes they gathered from the detector’s input signals. In (Taylan et al. Citation2021), three-phase flows were studied by modeling them in the homogeneous, annular, and stratified regimes at different volume fractions. In addition, three RBF neural networks were trained using the rather exact frequency characteristics of the input signals. In (Roshani et al. Citation2021), the MCNP algorithm was used to model the effects of combining four petroleum products in varying proportions by pairing them together. Three multilayer perceptron (MLP) neural networks were trained on the recorded signals to provide predictions about the volume distribution of the three products. The volume ratio of the fourth product was easily calculated after the volume ratios of the first three were known. The presented method foresaw the objects’ types and quantities; however, it was unable to attain high accuracy due to a lack of feature extraction techniques. Balubaid and his coworkers (Balubaid et al. Citation2021) investigated wavelet transformations as a potential feature extraction strategy to expand previous studies (Roshani et al. Citation2021). The computing load was optimized, and accuracy was enhanced as a result of this effort.
This study aims to provide a very accurate volume percentages diagnostic approach by drawing on previous work in the field. This was accomplished by the simulation of a three-phase flow regime consisting of water, gas, and oil in variable volumes. Inside the simulated pipe, scales with different thicknesses were considered. An effort has been made to accurately predict volume fractions by extracting temporal characteristics of mean value of the square root (MSR), skewness, waveform length (WL), and kurtosis received by the detector and feeding them into two GMDH neural networks. The innovations of the current article are as follows.
1-Increasing accuracy in determining volume percentages.
2-Determination of volumetric percentages inside the scaled pipe.
3-Examining the temporal characteristics of signals received from sodium iodide detectors.
4-Reducing the number of detectors to one, which reduces the cost of constructing the detection system, simplifies the detection system, and reduces the computational load applied to the system.
Detection Model
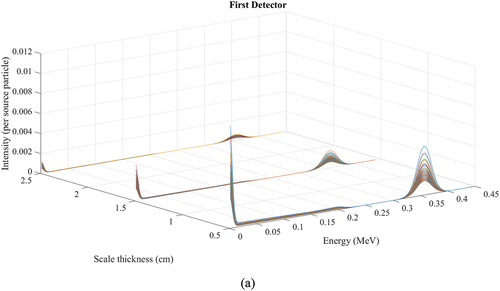
There has been a growing interest among academics in modeling X-ray or gamma-radiation-using structures using the MCNP method (Hosseini et al. Citation2021; Iliyasu et al. Citation2022; Mayet et al. Citation2022; Sattari, Roshani, and Hanus Citation2020). The methodology proposed in this research was simulated using the MCNP code simulation platform (Pelowitz Citation2005). The paper proposes a framework based on the radioactive isotopes 241Am and 133Ba. Both of its photons have energies of 59 and 356 keV, respectively. The detector at end of the steel flow pipe collects the photons emitted by the aforementioned dual energy source. The dimensions of this sodium iodide detector are 2.54 centimeters × 2.54 centimeters. However, a three-phase flow is simulated in the test pipe under a stratified flow regime. A ten centimeter diameter and a half centimeter wall thickness characterize the pipe. Internal to this pipe is a scale made from BaSO4 of varying thicknesses. There is a scale with a density of 4.5 grams per cubic centimeter in the pipe, with thicknesses of 0, 0.5, 1, 1.5, 2, and 3 cm so that water, oil, and gas can flow through it. In this model, the density of water is 1, the density of gas is 0.00125, and the density of oil is 0.826 grams per cubic centimeter. In this investigation, the MCNP program code was employed to realize the design with 7 choices of the scale thickness, there are 36 possible volume percentages, yielding a total of 252 simulations. It is important to highlight that the experimental structure utilized in the work (Nazemi et al. Citation2016) was the foundation for validating the simulated structure used in this analysis. Counts from detectors in both the experimental and simulated structures were compared. It was thought that they would complement each other well. As a whole, the outlined structure is shown in . It should be mentioned that t he simulation findings of this investigation have been confirmed by previous studies (Nazemi et al. Citation2016). In this work, numerous laboratory structures were developed and compared with the findings obtained from the MCNP code. Since the Tally output in the MCNP algorithm is per source particle, both were standardized to units to compare experimental and simulation results. The largest relative error of 2.2% was the discrepancy between the simulation findings and the laboratory structure. . displays a visual representation of the signals picked up by the detector at a scale thickness of 0.5, 1.5, and 2.5 cm. LamberteBeer’s law describes the attenuation for a narrow gamma ray beam as follows:
Figure 1. Architecture of the simulated detecting system.
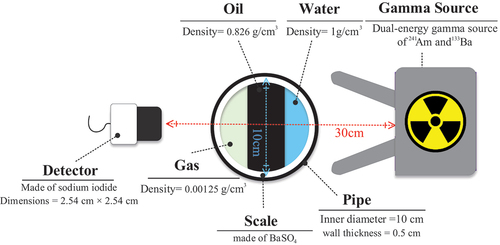
Figure 2. The signals recorded by detector at scale thicknesses of 0.5, 1.5 and 2.5 cm.
I and I0 represent the intensity of primary and un-collided photons, respectively. The mass attenuation coefficient and absorber density are denoted by µ and ρ, respectively. The beam path length via the absorber is denoted by x. According to this formula, the detector will record varying intensities due to photons colliding with various substances. This variation in measured intensity could be helpful in calculating the volume fractions of the three-phase flows inside the pipe.
Feature Extraction in the Time Domain
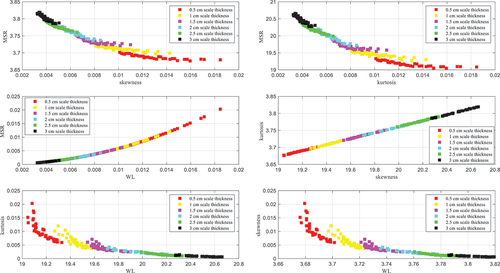
Since the signals that acquired in the vprior part were multidimensional, deciphering them was a laborious and time-consuming process. To this end, an effort was undertaken to extract temporal features from the given data in an effort to simplify and partition it. The signals captured by NaI detector were analyzed to determine four temporal characteristics: kurtosis, skewness, WL, and MSR. Following are the corresponding equations for these characteristics:
kurtosis:
(2)
skewness:
waveform length (WL):
mean value of the square root (MSR):
Here, n is the number of values in the dataset, N is the total number of observations, and x(n) is the representation of the main signal. The extracted features are shown two by two in . As it can be seen in this figure, with the simultaneous use of these four characteristics, it is possible to distinguish different volume percentages.
Figure 3. Extracted temporal characteristics from detector.
The GMDH neural network has been trained with these properties. It was indicated before that a total of 252 separate simulations have been run, and that four distinct temporal characteristics have been derived from the signals from each of those runs. This means that there are a total of 252 columns and 4 rows in the current matrix. The volume fractions of each phase within the pipe could be calculated from the neural network’s output.
GMDH Neural Network
An Ukrainian mathematician called M.G. Ivakhnenko developed a mathematical approach he named the Group Method of Data Handling (GMDH) for resolving difficulties of prediction and categorization (Ivakhnenko Citation1971). Self-organization is a key feature of Ivakhnenko’s suggested model, which allows for the automated selection of parameters including network topology, effective inputs, number of hidden layers, and number of neurons in hidden layers. The Kolmogorov-Gabor polynomial, which is detailed below, characterizes the connection between input and output in this neural network.
a (a1, a2,…, am) are the vector’s weights or coefficients, X (x1, x2,…, xm) are additional vector inputs or the same extracted characteristics, and y is the network’s output. The GMDH neural network is implemented in the following five phases.
First, Equation 10 is used to fit the inputs (extracted properties) of a neural network, two at a time and for each admixture. It is the job of this procedure to get the C coefficients from the least squares solution. Each quadratic polynomial’s solution provides a prediction for the target solution. The neural network’s neurons are charged with the calculation of these polynomials.
Second, The neurons that forecast the expected output most inaccurately are eliminated.
Third, The previously chosen neurons are interpreted as inputs characterized by quadratic polynomials, as in the first step. In this process, a polynomial of higher order is generated by combining lower-order polynomials.
Fourth, the second phase is carried out once more, and the neurons with the most faults are obliterated. Polynomials are generated from polynomials, and the process is continued until the target error is reached.
Fifth, Using test dataset to verify the network’s functionality. In order to avoid over-fitting and under-fitting, the available data are separated into two categories: training data and test data. The training data consists of all the inputs used to train the model by the neural network. Using test data, the trained neural network’s performance could be assessed. As long as the proposed neural network appropriately manages these two data sets, it will be free of over-fitting and under-fitting concerns. About 70% of the data is utilized for training the neural network, while the remaining 30% is used for testing the network after it is considered trained. Acceptable performance under operating situations is guaranteed if the developed neural network can demonstrate its accuracy on these data sets. In recent years, several researchers (Zych et al. Citation2014, Citation2018) have been curious in applying complex mathematical methods and artificial neural networks to different fields of study.
Conclusions and Implications
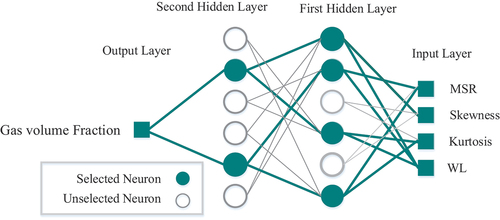
Two GMDH neural networks were trained using a 4 × 252 input matrix, each using inputs of four features from the preceding sections. The output of each neural network was a 1 × 252 matrix including the volume percentage of the water phase and the gas phase. In this research, several neural networks were trained to determine volume percentages. To calculate the percentages of gas and water volume, two GMDH neural networks have been trained. The number of their hidden layers was 2 and 3, respectively, and this structure is configured automatically and using the self-organization capability of the GMDH network. showed the optimal network for determining the volumetric proportion of water and gas. To calculate the network’s error value, two metrics are proposed: root mean squared error (MSE) and mean relative error (MRE). These criteria equations are as follows:
Figure 4. The GMDH neural network predicting water volume proportion.
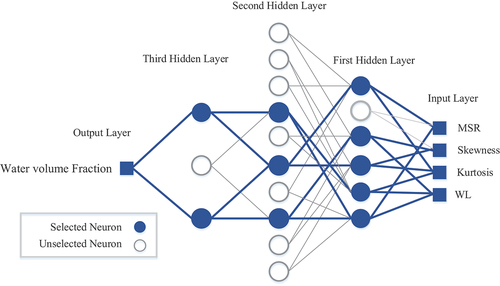
Figure 5. The GMDH neural network predicting gas volume proportion.
Where N is the total number of observations, “X(Exp)” and “X(Pred)” denote the ANN’s experimental and predicted values, respectively.
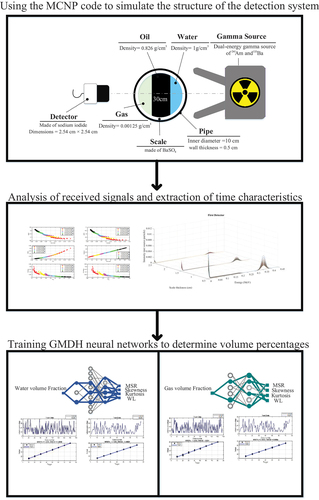
The available data are divided into two types: training data and test data. depict the neural network’s regression and fitting responses to these two classes for both networks. In fitting diagram, the blue dashed line represents the target output and the black line represents the output of the neural network. As it is clear from this figure, the two graphs coincide with each other, which indicates the good performance of the neural network. The regression diagram features a blue line representing the expected result and black square representing the network’s actual results. The better the proposed neural network performs, the closer the blue line and the black square will be. The usage of a radioisotope source is problematic because of the potential health risks it poses to humans and the need for workers to wear protective clothing and equipment. As shown in , the offered method for determining the volume percentages of each phase inside the pipe includes the following steps. As can be seen in the figure, the MCNP algorithm first simulated the flows going through the pipe and the various thicknesses of the scale within the pipe during the design phase of the detection system’s architecture. The four properties of MSR, skewness, kurtosis, and WL were obtained by analyzing the received signals from each simulation. Two GMDH neural networks were given the obtained characteristics to make predictions about the water and gas volumes. It is important to point out that the oil phase volume fraction could be easily determined by calculating two other volume fractions. When the neural networks were trained, their outputs were compared to the target values, and the error value was calculated. The origin may also not be stopped. The low error rate in this research and reducing the number of detectors to one were accomplished by properly processing the obtained data and training the neural network utilizing the signal’s valuable qualities that. The presence of scale allows for very precise estimations of volume as a percentage. It is strongly recommended that researchers in this field employ the different feature extraction and feature selection methods for the approach outlined in this study and evaluate the performance of various neural networks in following investigations.
Figure 6. Regression diagram for a) the training and b) test data related to the neural network for predicting the percentage of water phase.
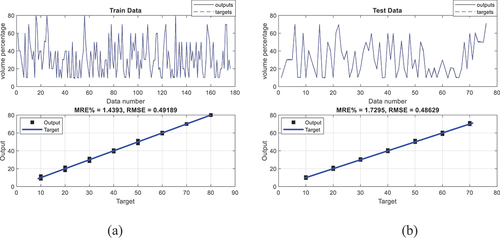
Figure 7. Regression diagram for a) the training and b) test data related to the neural network for predicting the percentage of gas phase.
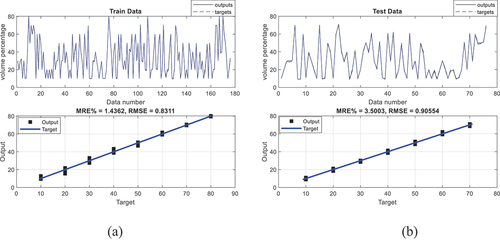
Figure 8. The general process of the current research.
Conclusion
Identifying the volume percent of each condensate phase that travels through the oil pipe will allow for system optimization and improvement of oil industry performance. Therefore, creating and instituting a method to determine volume percentage might be a helpful assistance in addressing the issues in the oil industry. In this research, the gamma-ray attenuation method was used to develop an optimal setup for predicting the volumetric percentage of three-phase condensates in a stratified flow regime. The detecting system, which calculates the volume percentage of each phase, consists of a dual-energy gamma generator and a NaI detector placed on opposite sides of the pipe. All of these procedures is simulated using MCNP code. A three-phase laminar flow was simulated in 36 different volume percentages and in 7 different scale thicknesses. From the signals received from all 252 simulations, 4 time characteristics of MSR, WL, skewness, and kurtosis were extracted. In total, a 4 × 252 matrix was available, which was used as input of two GMDH neural networks to determine the volume percentages of water and gas. The volume percentage of the oil phase may be easily estimated by subtracting the quantity of water and gas from the total volume of the pipe. The RMSE value of the water and gas predictor neural network are less than 0.49 and 0.9, respectively, which is a tiny error when compared to previous experiments. The oil and petroleum industry would benefit greatly from using the detection method presented in this research.
Disclosure statement
No potential conflict of interest was reported by the authors.
Additional information
Funding
References
- Alamoudi, M., M. A. Sattari, M. Balubaid, E. Eftekhari-Zadeh, E. Nazemi, O. Taylan, and E. M. Kalmoun. 2021. Application of gamma attenuation technique and artificial intelligence to detect scale thickness in pipelines in which two-phase flows with different flow regimes and void fractions exist. Symmetry 13 (7):1198. doi:10.3390/sym13071198.
- Balubaid, M., M. A. Sattari, O. Taylan, A. A. Bakhsh, and E. Nazemi. 2021. Applications of discrete wavelet transform for feature extraction to increase the accuracy of monitoring systems of liquid petroleum products. Mathematics 9 (24):3215. doi:10.3390/math9243215.
- Basahel, A., M. A. Sattari, O. Taylan, and E. Nazemi. 2021. Application of feature extraction and artificial intelligence techniques for increasing the accuracy of X-ray radiation based two phase flow meter. Mathematics 9:1227. doi:10.3390/math9111227.
- Hanus, R., M. Zych, M. Kusy, M. Jaszczur, and L. Petryka. 2018. Identification of liquid-gas flow regime in a pipeline using gamma-ray absorption technique and computational intelligence methods. Flow Measurement and Instrumentation 60:17–199. doi:10.1016/j.flowmeasinst.2018.02.008.
- Hanus, R., M. Zych, L. Petryka, M. Jaszczur, and P. Hanus. 2016a. Signals features extraction in liquid-gas flow measurements using gamma densitometry. Part 1: Time domain. EPJ Web of Conferences, 114 02035. DOI: 10.1051/epjconf/201611402035a
- Hanus, R., M. Zych, L. Petryka, M. Jaszczur, and P. Hanus. 2016b. Signals features extraction in liquid-gas flow measurements using gamma densitometry. Part 2: Frequency domain. EPJ Web of Conferences, 114, 02036. DOI: 10.1051/epjconf/201611402036,b
- Hanus, R., M. Zych, L. Petryka, D. Świsulski, and A. Strzępowicz. 2017. Application of ANN and PCA to two-phase flow evaluation using radioisotopes. EPJ Web of Conferences, 143 2033. DOI: 10.1051/epjconf/201714302033
- Hosseini, S., O. Taylan, M. Abusurrah, T. Akilan, E. Nazemi, E. Eftekhari-Zadeh, F. Bano, and G. H. Roshani. 2021. Application of wavelet feature extraction and artificial neural networks for improving the performance of gas–liquid two-phase flow meters used in oil and petrochemical industries. Polymers 13 (21):3647. doi:10.3390/polym13213647.
- Iliyasu, A. M., A. M. Mayet, R. Hanus, A. A. A. El-Latif, and A. S. Salama. 2022. Employing GMDH-type neural network and signal frequency feature extraction approaches for detection of scale thickness inside oil pipelines. Energies 15:4500. doi:10.3390/en15124500.
- Ivakhnenko, A. G. 1971. Polynomial theory of complex systems. IEEE Transactions on Systems, Man, and Cybernetics SMC-1 (4):364e378. doi:10.1109/TSMC.1971.4308320.
- Khayat, O., and H. Afarideh. 2019. Design and simulation of a multienergy gamma ray absorptiometry system for multiphase flow metering with accurate void fraction and water-liquid ratio approximation. Nukleonika 64 (1):19–29. doi:10.2478/nuka-2019-0003.
- Mayet, A. M., A. S. Salama, S. M. Alizadeh, S. Nesic, J. W. G. Guerrero, E. Eftekhari-Zadeh, E. Nazemi, and A. M. Iliyasu. 2022. Applying data mining and artificial intelligence techniques for high precision measuring of the two-phase flow’s characteristics independent of the pipe’s scale layer. Electronics 11:459. doi:10.3390/electronics11030459.
- Nazemi, E., G. H. Roshani, S. A. H. Feghhi, S. Setayeshi, E. Eftekhari Zadeh, and A. Fatehi. 2016. Optimization of a method for identifying the flow regime and measuring void fraction in a broad beam gamma-ray attenuation technique. International Journal of Hydrogen Energy 41 (18):7438–44. doi:10.1016/j.ijhydene.2015.12.098.
- Pelowitz, D. B. 2005. MCNP-X TM user’s manual, version 2.5.0. LA-CP-05e0369. Los Alamos National Laboratory.
- Peyvandi, R. G., and S. I. Rad. 2017. Application of artificial neural networks for the prediction of volume fraction using spectra of gamma rays backscattered by three-phase flows. The European Physical Journal Plus 132 (12):511. doi:10.1140/epjp/i2017-11766-3.
- Roshani, G. H., P. J. M. Ali, S. Mohammed, R. Hanus, L. Abdulkareem, A. A. Alanezi, M. A. Sattari, S. Amiri, E. Nazemi, E. Eftekhari-Zadeh, et al. 2021. Simulation study of utilizing X-ray tube in monitoring systems of liquid petroleum products. Processes 9 (5):828. doi:10.3390/pr9050828.
- Roshani, G. H., A. Karami, and E. Nazemi. 2019. An intelligent integrated approach of Jaya optimization algorithm and neuro-fuzzy network to model the stratified three-phase flow of gas–oil–water. Computational and Applied Mathematics 38 (1):1–26. doi:10.1007/s40314-019-0772-1.
- Roshani, G. H., E. Nazemi, and S. A. H. Feghhi. 2016. Investigation of using 60co source and one detector for determining the flow regime and void fraction in gas–liquid two-phase flows. Flow Measurement and Instrumentation 50:73–79. doi:10.1016/j.flowmeasinst.2016.06.013.
- Roshani, M., G. Phan, G. H. Roshani, R. Hanus, B. Nazemi, E. Corniani, and E. Nazemi. 2021. Combination of X-ray tube and GMDH neural network as a nondestructive and potential technique for measuring characteristics of gas-oil–water three phase flows. Measurement 168:108427. doi:10.1016/j.measurement.2020.108427.
- Salgado, C. M., L. E. Brandão, C. C. Conti, and W. L. Salgado. 2016. Density prediction forpetroleum and derivatives by gamma-ray attenuation and artificial neural networks. Applied Radiation and Isotopes : Including Data, Instrumentation and Methods for Use in Agriculture, Industry and Medicine 116:143–49. doi:10.1016/j.apradiso.2016.08.001.
- Salgado, C. M., L. E. Brandão, R. Schirru, C. M. Pereira, A. Xavier da Silva, and R. Ramos. 2009. Prediction of volume fractions in three-phase flows using nuclear technique and artificial neural network. Applied Radiation and Isotopes : Including Data, Instrumentation and Methods for Use in Agriculture, Industry and Medicine 67:1812–18. doi:10.1016/j.apradiso.2009.02.093.
- Salgado, W. L., R. S. Dam, T. P. Teixeira, C. C. Conti, and C. M. Salgado. 2020. Application of artificial intelligence in scale thickness prediction on offshore petroleum using a gamma-ray densitometer. Radiation Physics and Chemistry 168:108549. doi:10.1016/j.radphyschem.2019.108549.
- Salgado, C. M., C. M. Pereira, R. Schirru, and L. E. Brandão. 2010. Flow regime identification and volume fraction prediction in multiphase flows by means of gamma-ray attenuation and artificial neural networks. Progress in Nuclear Energy 52 (6):555–62. doi:10.1016/j.pnucene.2010.02.001.
- Sattari, M. A., N. Korani, R. Hanus, G. H. Roshani, and E. Nazemi. 2020. Improving the performance of gamma radiation based two phase flow meters using optimal time characteristics of the detector output signal extraction. Journal of Nuclear Science and Technology (JonSat) 41 (2):42–54.
- Sattari, M. A., G. H. Roshani, and R. Hanus. 2020. Improving the structure of two-phase flow meter using feature extraction and GMDH neural network. Radiation Physics and Chemistry 171:108725. doi:10.1016/j.radphyschem.2020.108725.
- Sattari, M. A., G. H. Roshani, R. Hanus, and E. Nazemi. 2021. Applicability of time-domain feature extraction methods and artificial intelligence in two-phase flow meters based on gamma-ray absorption technique. Measurement 168:108474. doi:10.1016/j.measurement.2020.108474.
- Taylan, O., M. Abusurrah, S. Amiri, E. Nazemi, E. Eftekhari-Zadeh, and G. H. Roshani. 2021. Proposing an intelligent dual-energy radiation-based system for metering scale layer thickness in oil pipelines containing an annular regime of three-phase flow. Mathematics 9:2391. doi:10.3390/math9192391.
- Taylan, O., M. A. Sattari, I. Elhachfi Essoussi, and E. Nazemi. 2021. Frequency domain feature extraction investigation to increase the accuracy of an intelligent nondestructive system for volume fraction and regime determination of gas-water-oil three-phase flows. Mathematics 9 (17):2091. doi:10.3390/math9172091.
- Zych, M., R. Hanus, B. Wilk, L. Petryka, and D. Świsulski. 2018. Comparison of noise reduction methods in radiometric correlation measurements of two-phase liquid-gas flows. Measurement 129:288–95. doi:10.1016/j.measurement.2018.07.035.
- Zych, M., L. Petryka, J. Kępński, R. Hanus, T. Bujak, and E. Puskarczyk. 2014. Radioisotope investigations of compound two-phase flows in an ope channel. Flow Measurement and Instrumentation 35:11–15. doi:10.1016/j.flowmeasinst.2013.10.001.