
 ?Mathematical formulae have been encoded as MathML and are displayed in this HTML version using MathJax in order to improve their display. Uncheck the box to turn MathJax off. This feature requires Javascript. Click on a formula to zoom.
ABSTRACT
A novel machine learning method, named CatBoost-DF (CatBoost deep forest), is proposed to solve this existing problem of low accuracy and lack of practicality in thermal sensation prediction. In the CatBoost-DF, a cascading strategy is introduced to strengthen the association between each layer of CatBoost. To verify the accuracy and robustness of CatBoost-DF, experiments collected physiological and environmental data from hundreds of subjects with the help of sensor devices and questionnaires. Compared with existing state-of-the-art machine learning methods, CatBoost-DF shows significant superiority, with a prediction accuracy of 90%, which is 4%-39% higher than other models. Moreover, the study explored the effects of seasonal and gender factors on thermal sensation. Result shown that different seasons have different thermal sensation for males and females. Finally, CatBoost-DF is applied to predict occupants’ thermal sensation, and the “comfort range” of the important parameters HR, WS, and CTR that affect the thermal sensation is calculated experimentally.
Introduction
Buildings consume a large proportion of energy and emit a substantial amount of greenhouse gas to maintain a comfortable thermal environment for occupants’ comfort. Many studies have shown that energy-efficient or low-consumption energy buildings require the use of passive design solutions to reduce energy consumption (Albatayneh et al. Citation2018). Applying passive design strategies can enhance indoor comfort conditions while decreasing energy consumption. However, existing inefficient indoor climate control strategies can lead to overheating and cooling indoors in warm and cold climates (de Dear et al. Citation2020), affecting occupant productivity and well-being (Zhang et al. Citation2022), and leading to excessive energy expenditures.
Many scholars have proposed different methods to improve the accuracy of the prediction model and achieve the purpose of indirect control of HVAC (heating, ventilation and air conditioning). Traditional methods such as PMV (Ole Fanger and Toftum Citation2002) model, extended PMV (ePMV) (Hoof Citation2008) model, and adaptive Model (aPMV) (Yao, Baizhan, and Liu Citation2009) were originally developed to predict the average heat demand of a group of people in a building and are not suitable for individual thermal comfort prediction. According to the “no free lunch theory (NLF)” (Wolpert and Macready Citation1997), many researchers have proposed different solutions, such as introducing physiological parameters like heart rate (Choi and Loftness Citation2012), blood pressure (Gilani, Hammad Khan, and Ali Citation2016), and skin temperature (Choi and Loftness Citation2012; Faghihimani and Abdolkarim Hosseini Citation2022). These new forecasting methods target occupants’ thermal sensation and offer the opportunity to simultaneously improve personal thermal satisfaction and reduce energy consumption. The average prediction accuracy of these methods in individual thermal sensation prediction is between 70% and 90% (Yang et al. Citation2020).
Machine learning (ML) models perform better than conventional methods (Fard, Zahra, and Sadat Korsavi Citation2022). ML models could outperform PMV and adaptive models with up to 35.9% and 31% higher accuracy. Classical machine learning models include artificial neural network (Chaudhuri et al. Citation2019; Moon, Yoon, and Kim Citation2013, Citation2013; Z. Nan et al. Citation2021; Wu et al. Citation2018), convolutional neural network (Somu et al. Citation2021), random forest (Chaudhuri et al. Citation2018; Cosma and Simha Citation2019; Hu et al. Citation2018), logistic regression, support vector machine (Chaudhuri et al. Citation2017, Citation2018; Cosma and Simha Citation2019; Jiang and Yao Citation2016), Gradient Boosting (Kim, Schiavon, and Brager Citation2018) and optimization algorithm (Ren et al. Citation2022; Yuan et al. Citation2022, Citation2022, Citation2022). This paper investigates the related work done by related researchers on the thermal sensation of the human body based on machine learning in recent years. reports the related work of machine learning models. In these studies, some researchers use the ASHRAE public datasets to evaluate the pros and cons of the algorithm. Some researchers collect data by themselves to verify the internal factors that affect thermal comfort. Most researchers choose thermal comfort indices such as PMV (Aritan Citation2019), thermal preference, thermal sensory vote (TSV), or thermal comfort vote (TCV) as the output of the model. Farhan et al. (Farhan et al. Citation2015) used the SVM model to predict the thermal comfort of the elderly, and the results showed that the prediction accuracy of SVM was 76.7%, which was two times higher than that of the widely adopted Fanger (Fanger Citation1970) model (which only achieved 35.4% accuracy). Somu N et al. (Somu et al. Citation2021) adopted TL CNN-LSTM for efficient thermal comfort modeling of spatiotemporal relationships in thermal comfort data, with the ability to achieve>55% accuracy with limited data in the target building. Katarina Katić et al. (Katić, Rongling, and Zeiler Citation2020) collected data in a climate chamber to compare four algorithms including SVM, Boosted trees, Bagged trees, and RUSBoosted trees, and the results showed that all test methods using RUSBoosted trees and the individual comfort model in subjects showed that the best median accuracy is 0.84.
Table 1. Related researches.
The thermal sensation of subjects is complex and changeable, which is affected by both physiological and psychological factors. Studies have shown (Lee et al. Citation2021; Wu et al. Citation2021) that people living in different regions have different responses to thermal sensation, and different thermal histories (Y. Wu et al. Citation2021) will make people’s needs for thermal comfort different, so it is difficult to find a perfect machine learning algorithm. Existing research has demonstrated that the machine learning model has a better prediction effect in thermal comfort prediction than the traditional PMV model, but the prediction effect of these models is still far from practical application and cannot meet the requirements of practicability. Based on NLF theory, the CatBoost-DF method is proposed. This study experimented in a cold climate city in northern China, collected thermal sensation data of hundreds of subjects, and proposed a CatBoost-DF model to predict occupants’ thermal sensations. Experiments show that the model has better predictions than other machine learning models. The effect and prediction accuracy can meet the practical requirements.
Methodology
Data Collection
The experiment was conducted in a city in northern China, and hundreds of subjects were invited as research subjects. The age of the subjects was roughly between 18 and 30 years old, and the genders of the subjects included male and female (shown in ). Experiments were conducted in winter and spring. To eliminate the influence of this thermal history factor as much as possible, all the subjects have lived in the local area for more than two years. The experimental site is carried out in the building physics laboratory of Henan Polytechnic University (HPU). The data collection method adopts the method of on-site sensor equipment collection and questionnaire survey. The parameters collected in the experiment contained physiological and environmental parameters. Physiological parameters contained diastolic and systolic blood pressure (CP, SP), heart rate (HR), mean blood pressure of the heart (MBP), and body temperature collected from subjects at seven points of skin temperature, including forehead (FT), cheek (CT), chest (CHT), arm (AT), back of the hand (BHT), calf (CAT), and ankle (ANT) (as shown in ). Environmental factors as important influences on thermal sensation, the experiment also measured wind speed (WS), indoor air temperature (IAT), relative humidity (RH), outdoor temperature (OT), and outdoor relative humidity (ORH). In addition, the thermal resistance of each subject’s clothing (CTR) was also measured. Because thermal sensation is a subjective feeling, each subject’s thermal sensation by designing a questionnaire for the subject to actively record the subject’s thermal sensation at the time. shows the overall flow of the experiment.
Figure 1. Experimental process and route.
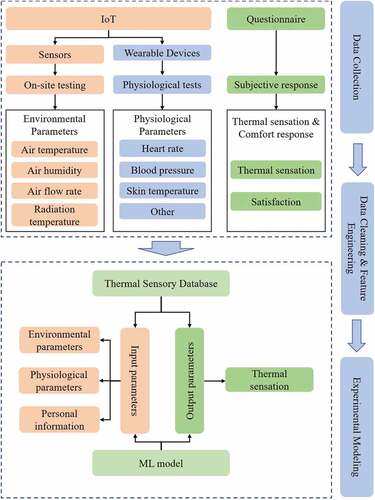
Table 2. Experiment date and subject gender information.
Equipment for measuring physiological and environmental data uses test instruments that meet the essential requirements of the ISO 7726 (ISO Citation2022) standard. According to ISO 7726 standard and ASHRAE 55–2017 manual, the height of the measuring point when the subject is standing is 0.1 m, 0.6 m, and 1.7 m, then the height of the measuring point when the subject is sitting is 0.1 m, 0.6 m, and 1.1 meters, shown in . During the experiment, all participating subjects were in a sitting position, so the heights of the test points for indoor environmental parameters were taken as 0.1 m, 0.6 m, and 0.1 m, shown in . All experimental equipment information is shown in :
Figure 2. Schematic diagram of the skin measuring point.
Figure 3. On-site thermal imagery.
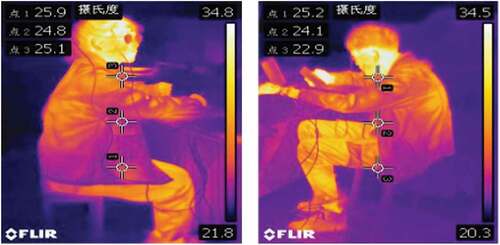
Table 3. Test instrument information.
The physiological parameter test method mainly uses the iButton temperature recorder to measure the body surface skin temperature of different parts of the subjects. The skin temperature measurement points are shown in , respectively A: forehead; B: cheek; C: chest; D: ankle; E: forearm; F: back of the hand; H: crus (these measurement points except forehead and chest The left side of the body was taken). The On-site thermal imagery is shown in . The subject was kept in a seated position during the experiment, and the body surface temperature was recorded on his side using an infrared device. To ensure the accuracy of the measurements, three points were fixed to measure the subject’s body surface temperature.
The PMV or PDD index [-3, 3] is commonly used to express satisfaction with the thermal environment, but in general buildings, very extreme cases are almost non-existent. Therefore, this study classifies occupants’ thermal sensations as cool, neutral and warm. The subjects’ thermal sensations were recorded actively using questionnaires, and the subjects actively recorded their cool and warm sensations during the experiment.
Machine Learning Model
CatBoost
CatBoost is an improved GBDT (gradient boosting decision tree) algorithm (Bhati and Khari Citation2021; Dorogush, Ershov, and Gulin Citation2018), which can handle various types of data well, has strong robustness, reduces the need for many hyperparameter tuning, and reduces the excessive chance of fitting, with good generality. Each iteration process of the traditional GBDT is based on the same data set to obtain the gradient of the current model and based on the gradient training to obtain a weak learner. However, this will lead to point-by-point gradient estimation deviation, which makes the final learned model overfitting. The gradient boosting algorithm of GBDT can be given by:
where is the newly generated weak learner;
is the negative gradient of the loss function.
CatBoost improves the traditional Greedy TBS (Prokhorenkova et al. Citation2019) by adding a priori distribution term. It reduces the influence of noise and low-frequency data on the data distribution, thereby improving the generalization ability of the model.
where is the added prior term, and
is a weight coefficient that is usually greater than 0, and feature
is is computed with objective
of
.
CatBoost-DF
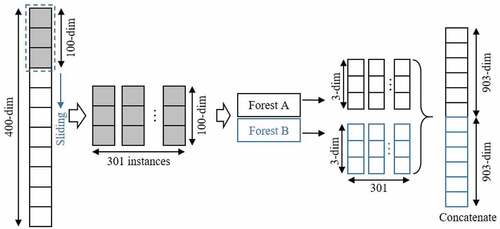
Deep forest (multi-grained cascade forest, DF) (Zhou and Feng Citation2017) is a deep model different from general deep neural networks. Layer-by-layer processing, intra-model feature transformation, and sufficient model complexity are considered to be the core reasons for the effectiveness of deep learning (Zhou and Feng Citation2020). Therefore, they explored the possibility of building deep models based on non-differentiable modules, namely deep forests. Two important features of deep forest are cascading forests and multi-granularity scans. Representation learning in deep neural networks mainly relies on layer-by-layer processing of raw features. Inspired by this understanding, deep forest adopts a cascade structure (Zhou Citation2012), in which each cascade receives the feature information processed by the previous level and outputs its processing results to the next level. Each level is an ensemble of decision tree forests (Liu et al. Citation2008), and each decision tree performs feature selection by choosing the best gini value (shown in ).
Figure 4. Structure diagram of multi-grained scanning.
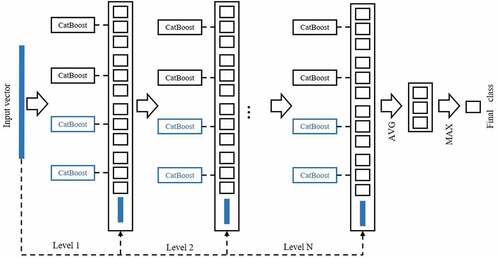
In practical applications, the accuracy of the deep forest is affected by the estimators at each level. If the performance of the estimators at each level is better, the final accuracy of the model will also be higher. Based on the accuracy of the basic deep forest, this paper proposes a new CatBoost-DF model whose structure is shown in .
Figure 5. Structure of CatBoost-DF.
Experiments on Numerical Problems
Dataset Description
To verify the robustness and applicability of the model proposed in this study uses the dataset collected by Kizito et al. (Lopez et al. Citation2016; Nkurikiyeyezu, Yokokubo, and Lopez Citation2019) on subjective evaluation of how neck cooling affects human thermal sensation. The experiment collected 11 subjects’ (A-K) thermal sensation under three experimental conditions. The dataset contains each subject’s heart rate variability (HRV) features. For more detailed information on the dataset can be found in Appendix 1.
The thermal sensation was classified according to the experimental conditions of the personal thermal environment. To compare the accuracy of the algorithms, experiments were conducted using the same four machine learning algorithms (Adaboost, Bagging, ExtraTrees, RandomForest) used to train and evaluate the thermal sensation prediction model. The results of CatBoost-DF were compared with the other state-of-the-art machine learning models. In addition to using machine learning models, proposed two data processing methods. For one named generic model, using a leave-one-subject-out (LOSO) approach. This method leaves one subject’s data as test data each time and the rest data as train data. Another method eliminates the individual differences in the expression of thermal sensation. In each experiment, a part of the “calibration sample” data is randomly collected and added to the training set, which can effectively individual differences. The results are in good consistent with the previous conclusions (Nkurikiyeyezu, Yokokubo, and Lopez Citation2019). The calibration model with calibration samples added almost doubles the accuracy of the generic model. The CatBoost-DF model this study proposed has obvious prediction accuracy compared to other machine learning models.
Results for Numerical Problems
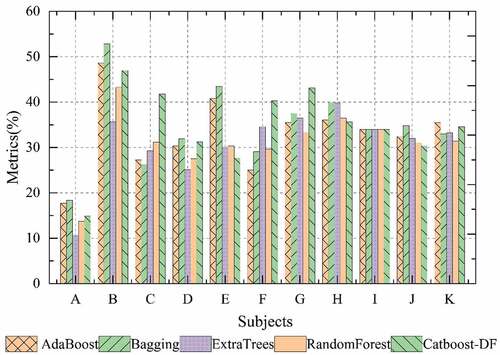
shows the results of independent predictions for each case based on the generic model. Compared with the other four models, the CatBoost-DF model has a higher accuracy. In a total of 11 use cases, CatBoost-DF has better accuracy than Adaboost, Bagging, ExtraTrees, RandomForest models in use cases C, D, F, G, I, K. However, from a numerical point of view, the performance of the generic model is relatively poor. As shown in , the accuracy of the five models is relatively low. The reason may be the result of model overfitting. The LOSO method makes the model in that not all data distributions are well obtained during training. Therefore, how to reduce overfitting and address the individual differences of subjects requires more consideration.
Figure 6. Performance of each model under Algorithm 1 trials.
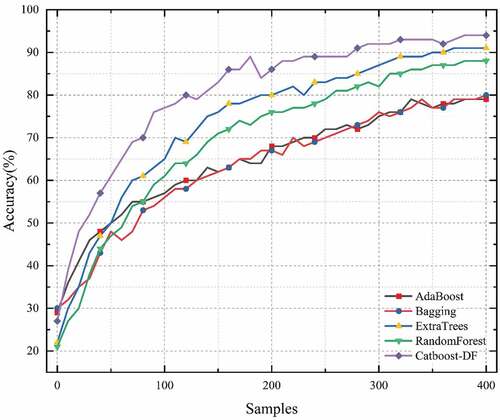
As shown in , among the five selected models, the CatBoost-DF model proposed in this study is far ahead of other models. It is imperative to note that it only took a small fraction of the calibration samples to increase the performance of the generic models trained on a large dataset. And as the number of calibration samples increases, the performance of the classification model steadily improves. When the number of calibration samples increased from 0 to 400, the classification accuracy of the CatBoost-DF model steadily increased from 30% to 94%.
Figure 7. Accuracy rise curve in the case of Algorithm 2.
This section conducts a comparison experiment based on the study of Kizito et al. The study applied two strategies (generic model and calibration model) and compared the four machine learning models. The experimental results are consistent with previous study. Adding a few person-specific calibration samples to the training data of the generic model would increase its performance because the new calibrated model would be able to capture the “uniqueness” of the new unseen people. Moreover, it can be seen that CatBoost-DF has higher accuracy under the same strategy. In the generic model experiment, CatBoost-DF has a good prediction effect compared to other models. When using the calibration model for experiments, as the number of calibration samples increases, CatBoost-DF has obvious prediction accuracy compared with other models. In the four evaluations of Accuracy, Precision, F1 score, and Kappa, CatBoost-DF has achieved high scores, with Accuracy, Precision, and F1 score reaching 94%, and Kappa is 91%.
Experiment on Engineering Problem
Experiment Setup
The experimental environment used in this study is based on HUAWEI CLOUD. The software used in the experimental environment is jupyter lab 3.2.8. The experimental environment runs on the HUAWEI CLOUD server as a service and is accessed remotely through a browser (http://clustera04.lymboy.com:8889).
PreProsessing
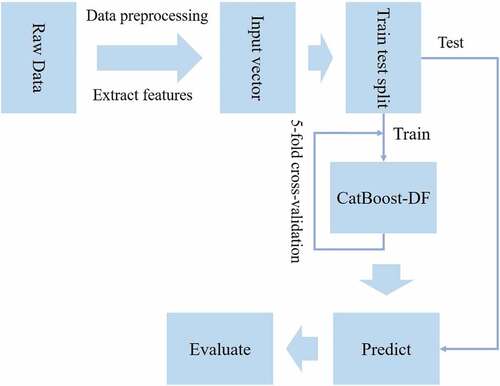
In the early stage of this study, the data collection method used sensor equipment measurement and a questionnaire survey, so there are some missing values and abnormal values. For example, some physiological parameters are quite different from the normal physiological temperature of the human body. To ensure the scientificity and rationality of the experiment, the data needs to be filled with missing values and processed for outliers in advance. describes the overall flow of the experiment. The specific steps are as follows:
Collation and alignment of physiological, environmental, and thermal sensory data of the subjects. Check the distribution of each feature one by one, and process the features with outliers;
Divide the data set into the training set and test set, and use 5-fold cross-validation to prevent overfitting;
Use the data set to train the model, compare different models to compare the model performance and efficiency;
Evaluate the model effect and improve it;
Figure 8. Schematic diagram of the experimental process.
Model Evaluation
In this section, selected three common model evaluation methods, Accuracy, F1 score, and ROC AUC.
Accuracy is a common metric for evaluating classification models and is numerically expressed as the number of correct predictions divided by the total number of predictions. AUC stands for “Area under the ROC Curve.” That is, AUC measures the entire two-dimensional area underneath the entire ROC curve (think integral calculus) from (0,0) to (1,1). A ROC curve (receiver operating characteristic curve) is a graph showing the performance of a classification model at all classification thresholds. The F1 score is defined as the harmonic mean of precision and recall. explains the detailed meaning of each indicator.
Table 4. To solve the precision and recall.
Results for Engineering Problem
Effect of Different Classification Algorithms
shows the prediction scores of different machine-learning models on the same dataset. Experiments show that among all seven machine learning models, the CatBoost-DF model has the highest classification prediction accuracy, with an accuracy score of 90%, an F1 score of 91%, and a ROC AUC score of 0.98. Compared with the basic CatBoost model, the performance of the CatBoost-DF model is significantly improved in all three evaluation metrics. The CatBoost-DF model improves accuracy by 4%, the F1 score by 5%, and the ROC AUC score by 8%. The logistic regression model has the lowest score among all models and the lowest score among the three selected evaluation metrics, 51%, 49%, and 96%, respectively.
Table 5. Classification scores with different models.
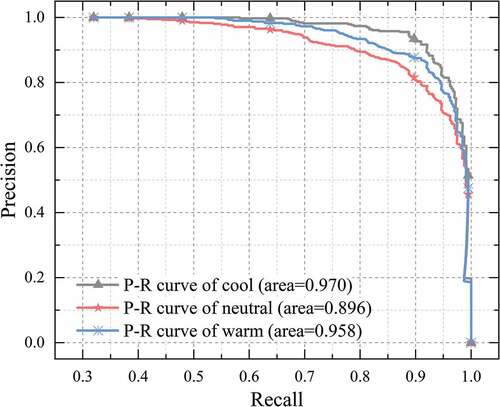
shows a comparison chart of the results of several machine learning models in the case of 5-fold cross-validation. It can be seen from that the CatBoost-DF model has obvious advantages in the selected models, and the model classification accuracy is in each are ahead of other models. are the PR curve of CatBoost-DF.
Figure 9. Statistics of each model indicator.
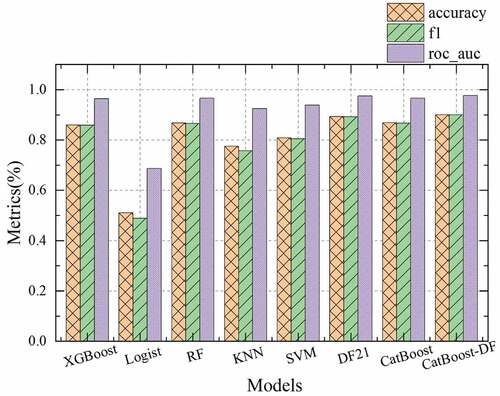
Figure 10. P-R curve of CatBoost-DF model.
Prediction Performance of the Classification Model
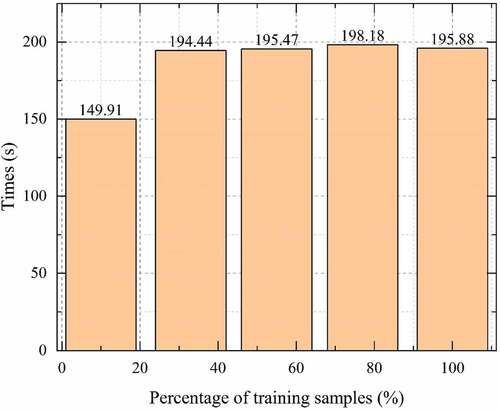
shows the change curve of the model prediction effect of different classifiers when the number of training samples is different. shows the random sampling of 10%, 32.5%, 55%, 77.5%, and 100% of the data from all samples. The experiments show that the CatBoost-DF model occurs when the number of samples the prediction accuracy has always maintained a high prediction score over changes, and the stability and robustness of the model are better. On the other hand, as the number of training samples increases, the training time of the model also increases. The KNN model is less affected by the number of training samples. The XGBoost model is most affected by the number of training samples. With 10% of the samples, XGBoost can be trained within 10s. However, when the number of samples is 100%, the XGBoost takes more than 300 seconds in the case of 5-fold cross-validation. The cost of accuracy improvement is longer training time, which is not a satisfactory option. The CatBoost-DF model has the best classification performance among all models and takes less training time than the XGBoost model.
Figure 11. As the number of samples increases, the training time gradually converge.
Intrinsic Factors Affecting Thermal Sensation
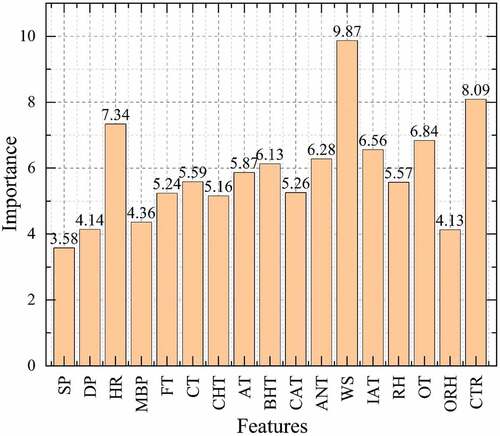
Numerous studies have shown that there are multiple factors affecting thermal sensation, including both physiological and environmental factors, and even historical factors. However, from an engineering and practical point of view, some parameters (e.g. metabolic rates) are often not readily measurable, so it is of practical engineering interest to investigate the most important factors affecting thermal sensation. Using the CatBoost-DF algorithm, it is easy to calculate the importance of features that affect the subject’s thermal sensation. As shown in , it was found that among all the features, heart rate, wind speed, and clothing thermal resistance have the greatest influence on the subject’s thermal sensation.
Figure 12. Feature importance.
In addition, the experiment also introduced two new factors for analysis, season and gender, these two factors will also affect people’s judgment of thermal sensation. shows the temperature and humidity range that subjects were comfortable with in the spring. shows the temperature and humidity ranges that subjects were comfortable with during winter. It can be seen from that there is a certain difference in the comfortable temperature and humidity requirements of males and females, and the “comfortable temperature” and “comfortable humidity” of males are wider than females. In winter, because of the special geographical location of the city, the weather is cold and dry, the difference between the “comfortable temperature” and “comfortable humidity” for males and females is smaller, and it is easier to keep the room temperature at 20°C~22°C and humidity at 30%~45% to make people feel comfortable.
Figure 13. Comfortable range of temperature and humidity for males and females in spring.
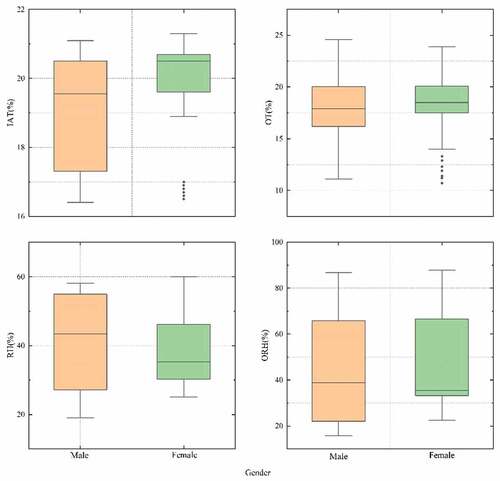
Figure 14. Comfortable range of temperature and humidity for males and females in winter.
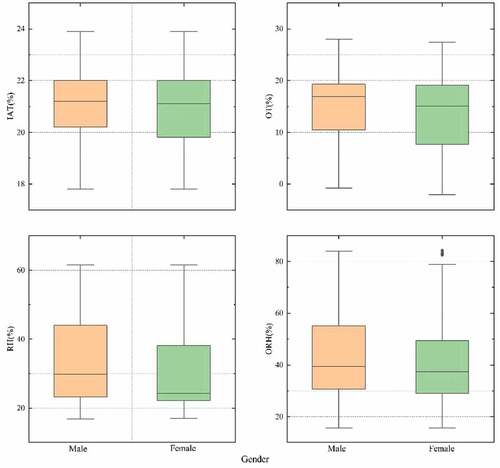
summarizes the “comfort ranges” for three high-importance features. As can be seen, heart rate is not easily affected by the season, and a lower heart rate and a stable state of mind are more likely to make people feel comfortable. Keeping ventilation and airflow in the spring, closing windows and doors properly in the winter, and keeping the indoor air flow rate low can make the occupants feel comfortable. Also, the occupants’ reasonable way of dressing can help with thermal sensation. For example, you can wear thicker and warmer clothes in winter, while you can reduce clothes in spring when the weather is warm.
Table 6. Comfort range for three important characteristics.
In this section, the CatBoost-DF model is applied to thermal sensation prediction. Experiments show that CatBoost-DF has>90% accuracy in thermal sensation prediction. Compared with previous research results (Chaudhuri et al. Citation2017; Xie et al. Citation2020),the CatBoost-DF model improves about 10% in terms of prediction accuracy. Moreover, some previous studies of machine learning-based methods (Ma et al. Citation2021; Xie et al. Citation2020) have mostly focused on introducing algorithms and the overall process without emphasizing essential issues, such as determination of sample size, time scale, target parameter, validation methods and performance metrics. Thus, the effects of gender and season on thermal sensation are explored in this section, which sets the stage for further research. However, these findings are specific to the geographical area at hand, and conclusions may vary from one climatic region to another with different building structures.
Conclusions
This study proposes a new machine learning approach to predict occupant thermal experience. Experiments have proven that it has high prediction accuracy and robustness. This study explored the effects of seasonal and gender factors on occupant thermal sensation, and in the experiment, the comfort range of some parameters satisfying most of the subjects was calculated. The overall accuracy of thermal sensation prediction using the improved CatBoost-DF model is improved by 4% compared to CatBoost and by 39% compared to Logistic Regression. In addition, the study also performed validation using other researchers’ datasets, and the experiments show that our proposed model still has better prediction accuracy than other models, with an F1 score of 94%, which is the best prediction among several other models such as Adaboost. Overall, our results demonstrate the powerful role of CatBoodt-DF in predicting thermal sensation.
Furthermore, by analyzing the effects of seasonal and gender factors on the subjects’ comfort sensation, the study found the subjects have different requirements for environmental parameters such as temperature and humidity in different seasons. And there are also some differences in the environmental requirements between males and females. Finally, calculate the “comfort range” for males and females in different seasons based on the measurement data.
The proposed approach can help to achieve an optimal balance between thermal comfort and energy consumption, which is a vital objective of smart building. It must be recognized that thermal sensation factors are multifaceted, and the findings may not necessarily apply to other regions and cities. In the future work, the potential impact of the influence of human factors should be considered, such as climate and culture. Notably, we will continue to conduct in-depth research, which is still an interesting and challenging work.
Acknowledgements
The research work was supported by the Science and Technology Plan Project of Henan province under Grant No. 222102210182, Doctoral Foundation of Henan Polytechnic University under Grant No. B2021-31, Scientific Studies of Higher Education Institution of Henan province under Grant 22A520029, Natural Science Foundation of Henan Province under Grant No. 222300420168, and the Fundamental Research Funds for the Universities of Henan Province under Grant NSFRF220415.
Disclosure statement
The authors declare that they have no known competing financial interests or personal relationships that could have appeared to influence the work reported in this paper.
Additional information
Funding
References
- Albatayneh, A., D. Alterman, A. Page, and B. Moghtaderi. 2018. The impact of the thermal comfort models on the prediction of building energy consumption. Sustainability 10 (10):3609. doi:10.3390/su10103609.
- Aritan, A. E. 2019. Investigation of thermal comfort conditions in a travertine processing plant by using thermal comfort indices. International Journal of Environmental Science and Technology 16 (9):5285–449. doi:10.1007/s13762-019-02378-4.
- Bhati, N. S., and M. Khari. 2021. A NEw intrusion detection scheme using catboost classifier. In Forthcoming networks and sustainability in the IoT Era, ed. Enver Ever and Fadi Al-Turjman, 169–76. Cham: Lecture Notes of the Institute for Computer Sciences, Social Informatics and Telecommunications EngineeringSpringer International Publishing. doi:10.1007/978-3-030-69431-9_13.
- Chaudhuri, T., Y. Chai Soh, L. Hua, and L. Xie. 2017. Machine learning based prediction of thermal comfort in buildings of equatorial singapore. In 2017 IEEE International Conference on Smart Grid and Smart Cities (ICSGSC), 72–77. doi:10.1109/ICSGSC.2017.8038552.
- Chaudhuri, T., Y. Chai Soh, L. Hua, and L. Xie. 2019. A feedforward neural network based indoor-climate control framework for thermal comfort and energy saving in buildings. Applied Energy 248 (August):44–53. doi:10.1016/j.apenergy.2019.04.065.
- Chaudhuri, T., D. Zhai, Y. Chai Soh, L. Hua, and L. Xie. 2018. Random forest based thermal comfort prediction from gender-specific physiological parameters using wearable sensing technology. Energy and Buildings 166 (May):391–406. doi:10.1016/j.enbuild.2018.02.035.
- Chen, X., L. Gao, P. Xue, J. Du, and J. Liu. (2020). Investigation of outdoor thermal sensation and comfort evaluation methods in severe cold area. Science of The Total Environment 749:141520. doi:10.1016/j.scitotenv.2020.141520.
- Choi, J.H., and V. Loftness. 2012. Investigation of human body skin temperatures as a bio-signal to indicate overall thermal sensations. Building and Environment 58 (December):258–69. doi:10.1016/j.buildenv.2012.07.003.
- Cosma, A. C., and R. Simha. 2019. Using the contrast within a single face heat map to assess personal thermal comfort. Building and Environment 160 (August):106163. doi:10.1016/j.buildenv.2019.106163.
- de Dear, R., J. Xiong, J. Kim, and B. Cao. 2020. A review of adaptive thermal comfort research since 1998. Energy and Buildings 214 (May):109893. doi:10.1016/j.enbuild.2020.109893.
- Dorogush, A. V., V. Ershov, and A. Gulin. 2018. CatBoost: GRadient boosting with categorical features support. arXiv. doi:10.48550/arXiv.1810.11363.
- Faghihimani, M. M., and S. Abdolkarim Hosseini. 2022, July. Study on thermal comfort of low-sweat and high-sweat young men based on heart rate variability analysis under different clothing. In Indoor and built environment, 1420326X221105628. SAGE Publications Ltd STM. doi:10.1177/1420326X221105628.
- Fanger, P. O. 1970. Thermal comfort. Analysis and applications in environmental engineering. Thermal comfort. Analysis and applications in environmental engineering. Copenhagen: Danish Technical Press. https://www.cabdirect.org/cabdirect/abstract/19722700268.
- Fard, Q., Z. S. Z. Zahra, and S. Sadat Korsavi. 2022. Application of machine learning in thermal comfort studies: A review of methods, performance and challenges. Energy and Buildings 256 (February):111771. doi:10.1016/j.enbuild.2021.111771.
- Farhan, A. A., K. Pattipati, B. Wang, and P. Luh. 2015. Predicting individual thermal comfort using machine learning algorithms. In 2015 IEEE International Conference on Automation Science and Engineering (CASE), 708–13. doi:10.1109/CoASE.2015.7294164.
- Gao, G., J. Li, and Y. Wen. 2020. DeepComfort: Energy-Efficient Thermal Comfort Control in Buildings Via Reinforcement Learning. IEEE Internet of Things Journal 7(9):8472–8484. doi:10.1109/JIOT.2020.2992117.
- Gilani, S.I.U.H., M. Hammad Khan, and M. Ali. 2016. Revisiting fanger’s thermal comfort model using mean blood pressure as a bio-marker: An experimental investigation. Applied Thermal Engineering 109 (October):35–43. doi:10.1016/j.applthermaleng.2016.08.050.
- Hoof, J. 2008. Forty years of fanger’s model of thermal comfort: comfort for all? Indoor Air 18 (July):182–201. doi:10.1111/j.1600-0668.2007.00516.x.
- Hu, W., Y. Wen, K. Guan, G. Jin, and K. Jet Tseng. 2018. ITCM: Toward learning-based thermal comfort modeling via pervasive sensing for smart buildings. IEEE Internet of Things Journal 5 (5):4164–77. doi:10.1109/JIOT.2018.2861831.
- ISO 7726:1998. 2022. ISO. Accessed February 13. Ergonomics of the thermal environment — Instruments for measuring physical quantities.
- Jiang, L., and R. Yao. 2016. Modelling personal thermal sensations using c-support vector classification (C-SVC) algorithm. Building and Environment 99 (April):98–106. doi:10.1016/j.buildenv.2016.01.022.
- Jung, W., F. Jazizadeh, and T E. Diller. (2019). Heat Flux Sensing for Machine-Learning-Based Personal Thermal Comfort Modeling. Sensors 19(17):3691. doi:10.3390/s19173691.
- Katić, K., L. Rongling, and W. Zeiler. 2020. Machine learning algorithms applied to a prediction of personal overall thermal comfort using skin temperatures and occupants’ heating behavior. Applied Ergonomics 85 (May):103078. doi:10.1016/j.apergo.2020.103078.
- Kim, J., S. Schiavon, and G. Brager. 2018. Personal comfort models – a new paradigm in thermal comfort for occupant-centric environmental control. Building and Environment 132 (March):114–24. doi:10.1016/j.buildenv.2018.01.023.
- Lee, Y. Y., M. Fadhil Md Din, K. Iwao, Y. Huei Lee, and N. Anting. 2021. Impact of thermal behaviour of different environmental conditions on ambient environment and thermal discomfort in Malaysia. In Indoor and built environment, vol. 30, 4–534 520–534. SAGE Publications Ltd STM. doi:10.1177/1420326X19897956.
- Liu, F. T., K. M. Ting, Y. Yu, and Z. H. Zhou. 2008. Spectrum of variable-random trees. The Journal of Artificial Intelligence Research 32 (May):355–84. doi:10.1613/jair.2470.
- Lopez, G., Y. Kawahara, Y. Suzuki, M. Takahashi, H. Takahashi, and M. Wada. 2016. Effect of direct neck cooling on psychological and physiological state in summer heat environment. Mechanical Engineering Journal 3 (1):15–00537. doi:10.1299/mej.15-00537.
- Ma, N., D. Aviv, H. Guo, and W. W. Braham. 2021. Measuring the right factors: A review of variables and models for thermal comfort and indoor air quality. Renewable and Sustainable Energy Reviews 135 (January):110436. doi:10.1016/j.rser.2020.110436.
- Moon, J. W., S.H. Yoon, and S. Kim. 2013. Development of an artificial neural network model based thermal control logic for double skin envelopes in winter. Building and Environment 61 (March):149–59. doi:10.1016/j.buildenv.2012.12.010.
- Mui, K., T. Tsang, and L. Wong. (2020). Bayesian updates for indoor thermal comfort models. Journal of Building Engineering 29:101117. doi:10.1016/j.jobe.2019.101117.
- Nan, M., L. Chen, H. Jian, P. Perdikaris, and W. W. Braham. 2021. Adaptive behavior and different thermal experiences of real people: A bayesian neural network approach to thermal preference prediction and classification. Building and Environment 198 (July):107875. doi:10.1016/j.buildenv.2021.107875.
- Nkurikiyeyezu, K., A. Yokokubo, and G. Lopez. 2019. Affect-aware thermal comfort provision in intelligent buildings. In 2019 8th International Conference on Affective Computing and Intelligent Interaction Workshops and Demos (ACIIW), 331–36. doi:10.1109/ACIIW.2019.8925184.
- Ole Fanger, P., and J. Toftum. 2002. Extension of the PMV Model to non-air-conditioned buildings in warm climates. Energy and Buildings 34 (6):533–36. Special Issue on Thermal Comfort Standards. doi:10.1016/S0378-7788(02)00003-8.
- Prokhorenkova, L., G. Gusev, A. Vorobev, A. Veronika Dorogush, and A. Gulin. 2019. CatBoost: Unbiased boosting with categorical features. ArXiv:1706.09516 [Cs], January. http://arxiv.org/abs/1706.09516.
- Ren, J., Z. Wang, Y. Pang, and Y. Yuan. 2022. Genetic algorithm-assisted an improved adaboost double-layer for oil temperature prediction of TBM. Advanced Engineering Informatics 52 (April):101563. doi:10.1016/j.aei.2022.101563.
- Somu, N., A. Sriram, A. Kowli, and K. Ramamritham. 2021. A hybrid deep transfer learning strategy for thermal comfort prediction in buildings. Building and Environment 204 (October):108133. doi:10.1016/j.buildenv.2021.108133.
- Wolpert, D. H., and W. G. Macready. 1997. No free lunch theorems for optimization. IEEE Transactions on Evolutionary Computation 1 (1):67–82. doi:10.1109/4235.585893.
- Wu, Y., H. Liu, L. Baizhan, R. Kosonen, S. Wei, J. Jokisalo, and Y. Cheng. 2021. Individual thermal comfort prediction using classification tree model based on physiological parameters and thermal history in winter. Building Simulation 14 (6):1651–65. doi:10.1007/s12273-020-0750-y.
- Wu, Z., L. Nianping, J. Peng, H. Cui, P. Liu, L. Hongqiang, and L. Xiwang. 2018. Using an ensemble machine learning methodology-bagging to predict occupants’ thermal comfort in buildings. Energy and Buildings 173 (August):117–27. doi:10.1016/j.enbuild.2018.05.031.
- Xie, J., L. Haoyang, L. Chuting, J. Zhang, and M. Luo. 2020. Review on occupant-centric thermal comfort sensing, predicting, and controlling. Energy and Buildings 226 (November):110392. doi:10.1016/j.enbuild.2020.110392.
- Xiong, L., and Y. Yao. 2021. Study on an adaptive thermal comfort model with K-nearest-neighbors (KNN) algorithm. Building and Environment 202:108026. doi:10.1016/j.buildenv.2021.108026.
- Yang, B., L. Xiaojing, Y. Hou, A. Meier, X. Cheng, J.H. Choi, F. Wang, H. Wang, A. Wagner, D. Yan, et al. 2020. Non-invasive (non-contact) measurements of human thermal physiology signals and thermal comfort/discomfort poses -a review. Energy and Buildings 224 (October):110261. doi:10.1016/j.enbuild.2020.110261.
- Yao, R., L. Baizhan, and J. Liu. 2009. A theoretical adaptive model of thermal comfort – adaptive predicted mean vote (APMV). Building and Environment 44 (10):2089–96. doi:10.1016/j.buildenv.2009.02.014.
- Yuan, Y., J. Ren, S. Wang, Z. Wang, M. Xiaokai, and W. Zhao. 2022. Alpine skiing optimization: a new bio-inspired optimization algorithm. Advances in Engineering Software 170 (August):103158. doi:10.1016/j.advengsoft.2022.103158.
- Yuan, Y., J. Ren, Z. Wang, and M. Xiaokai. March, 2022. Dynamic analysis of the rigid-flexible excavator mechanism based on virtual prototype. Facta Universitatis Series: Mechanical Engineering 20 (2):341. http://casopisi.junis.ni.ac.rs/index.php/FUMechEng/article/view/8029
- Yuan, Y., M. Xiaokai, X. Shao, J. Ren, Y. Zhao, and Z. Wang. 2022. Optimization of an auto drum fashioned brake using the elite opposition-based learning and chaotic k-best gravitational search strategy based grey wolf optimizer algorithm. Applied Soft Computing 123 (July):108947. doi:10.1016/j.asoc.2022.108947.
- Zhai, D., T. Chaudhuri, Y. Chai Soh, O. Xianhua, and C. Jiang. 2018. Improvement of Energy Efficiency of Markov ACMV Systems Based on PTS Information of Occupants. In 2018 International Joint Conference on Neural Networks (IJCNN), 1–7. doi:10.1109/IJCNN.2018.8489214.
- Zhang, J., X. Zhou, S. Lei, and M. Luo. 2022. Energy and comfort performance of occupant-centric air conditioning strategy in office buildings with personal comfort devices. Building Simulation 15 (5):899–911. doi:10.1007/s12273-021-0852-1.
- Zhou, Z.H. 2012. Ensemble methods: Foundations and algorithms. Chapman & Hall/CRC machine learning & pattern recognition series. Boca Raton, FL: Taylor & Francis.
- Zhou, Z.H., and J. Feng. 2017. Deep forest: Towards an alternative to deep neural networks. In Proceedings of the Twenty-Sixth International Joint Conference on Artificial Intelligence, 3553–59. Melbourne, Australia: International Joint Conferences on Artificial Intelligence Organization. doi:10.24963/ijcai.2017/497.
- Zhou, Z.H., and J. Feng. 2020. Deep forest. ArXiv:1702.08835 [Cs, Stat], July. http://arxiv.org/abs/1702.08835.