
 ?Mathematical formulae have been encoded as MathML and are displayed in this HTML version using MathJax in order to improve their display. Uncheck the box to turn MathJax off. This feature requires Javascript. Click on a formula to zoom.
ABSTRACT
In order to improve the effect of visual communication art design, this paper combines virtual reality technology to analyze the quantitative impact of visual communication art design. The paper aims to address the need for more effective visual communication art design by proposing a new design system incorporating virtual reality technology. Moreover, this paper elaborates two implementations of semi-covered virtual reality graphics through pictures and texts: by translating the turntable or offsetting the detector. In addition to this, this paper expounds the semi-covered virtual reality graphics realized by the translation stage. By interpolating the projection data onto a virtual detector, the half-covering virtual reality graphics realized by the translation stage can theoretically be equivalent to the half-covering virtual reality graphics realized by offsetting the virtual detector. It uses semi-covered virtual reality graphics achieved through the translation stage as the main methodological approach to achieve this goal. It conducts experimental research to evaluate the system’s effectiveness. The experimental research shows that the visual communication design system based on virtual reality technology proposed in this paper has good design performance and can effectively improve the effect of visual communication art design.
Introduction
Design is an activity process that conveys a plan, planning or vision through a visual form formed by two-dimensional or three-dimensional means. In other words, it is to explain the meaning of human life or existence through the process of making. Since the Arts and Crafts movement, more and more people have put forward the concept of RE-DESING (Andreeva et al. Citation2019). Redesign is the re-creation of design itself. In our daily life, what we think we are already familiar with is the blind spot in design. The redesign triggered by this is not a simple redesign, but a deep thinking about design. When the first person made cups and plates out of clay, it can be called creation, but we defamiliarize the common things and give them new meanings. It is also a kind of creation, which is also the concept of redesign. Today, when “design” prevails, styles and genres are no longer the criteria for defining them, and it may be called dissolution, that is, the dissolution of boundaries (Bastogne Citation2017).
Looking back from the perspective of the 21st century, deconstructionism, modernism, decorativeism, classicism and even postmodernism can all find that some of these elements and materials are constantly being played out (Ascott Citation2007). The development of modern technology has made us, as individuals, no longer have the ability to fully control knowledge, and design is still relentlessly catching up with the pace of technology and the increasingly mature consumption era. material, then it is nothing more than the reproduction of the technology itself (Jordan and O’Donoghue Citation2018). The continuous development of technology has in turn injected new blood into design, but we have begun to notice that it is not only the creation of novelty that is created, whether it is in the architectural form of the past or in daily life today as complete Unfamiliar forms are re-created, and it is constantly discovered that the extraordinary in the ordinary is the real sense of existence of the design (Klockars et al. Citation2019).
The essence of design is creation, which is a specific way for people to express and describe the unknown things in their imagination (Wang and Hongyu Citation2019). Design is not only to provide a short-term plan for the current social requirements, but to explore potential social needs., and make creative solutions to these needs. Creating new things is the concrete realization of design, and it is the concrete material way through which many dreams and ideas of human beings can be certified (Knight, Daymond, and Paroutis Citation2020). The power of design comes from people’s dreams, and only based on the ideals or dreams that can represent the new era can it be possible to create new functions required by the new era (Lockheart Citation2018).
The value of an art design work is not determined by the ratio of its material and spiritual aspects, but by the comprehensive value represented by these two aspects. Let us choose a rather special angle to address this issue (Gao, Man, and Wang Citation2022). Throughout the ages, there have always been imitations of artistic design works, especially those classics that have undergone long-term testing, evaluation, and appreciation from social, historical, cultural and artistic aspects (Luo and Dai Citation2017). Their value is determined by the particular time-space value(s) in which they exist. Academically designed knockoffs cannot simply be equated with street-level counterfeit goods (Yin et al. Citation2020). It’s two different things. It is necessary to point out that it is absolutely necessary to comment on the value of art and design works by critics, connoisseurs and the press (Maras Citation2018). But don’t make absolutes. Because it is not without the phenomenon that public opinion is not very objectively oriented. By the way, school art and design education, the high authority of teachers, and one word, may not be a good thing. What is important is that efforts should be made to raise the awareness of the value of correct art and design for all people. The functional value of artistic design works should be reflected in the entire design process. Improving the functional value of the design process will inevitably improve the functional value of the design body (McCartney and Tynan Citation2021). The fundamental requirement for artistic design to obtain aesthetic value is to deeply demonstrate the “living soul.” Art design masters are well aware of the role and status of expressing “living soul” in art design (Areeb et al. Citation2021). They start from observing life, and in the whole process of conception, setting and operation practice, they focus on understanding, characterization and shaping of “living soul” (Mourtzis Citation2020). The deeper aesthetic value requirements for artistic design and its adult form are diverse, gradual, and fickle, and it is also difficult to meet, or even limitless. Things that were recognized, accepted and even loved in the past may become unbeautiful and useless objects that were originally considered aesthetically valuable as time passes (Chen et al. Citation2020). Human beings advocating nostalgia, but also the pursuit of fashion (Nebessayeva et al. Citation2018). The functional value and aesthetic value of artistic design and its body are not constant but full of variables. This is also the characteristic of art design culture, it can create culture and influence life, and at the same time it also changes itself and its value connotation (Ravelomanantsoa, Ducq, and Vallespir Citation2019).
If we focus the perspective of art design on the level of material culture, people must be concerned about the creative ability of art design and how to deal with materials, materials, configuration, color, packaging, etc. (Han Citation2021), and also must be concerned about the development trend of related art design, shape analysis and related scientific and technological knowledge, and even operation strategies in the economic field (Sachdev Citation2019). If we focus the perspective of art design on the spiritual and cultural level, people must be concerned about the rich cultural information contained in the art design process (Srinivasan and Uchino Citation2021). There is a fairly clear understanding of the development trend (Tsai Citation2017). The value forms of artistic design are diverse: such as practical value, political value, moral value, economic value, aesthetic value, etc. (Wan et al. Citation2018). The field of art design should also develop a relatively complete and scientific value theory system. Among the many value forms, the most essential is undoubtedly its functional value and aesthetic value (Tummala et al. Citation2022). The connotations of these two value forms (of course, other value forms can also be included) are organically harmonious in each specific artistic design (Yi Citation2017).
The need for the study is to improve the effectiveness of visual communication art design through the use of virtual reality technology. The paper proposes a new design system that utilizes semi-covered virtual reality graphics to enhance the impact of visual communication art.
To achieve this, the paper describes two semi-covered virtual reality graphics implementations using pictures and text. These graphics are achieved through the translation stage by interpolating the projection data onto a virtual detector. The paper argues that this approach can theoretically be equivalent to the half-covering virtual reality graphics realized by offsetting the virtual detector.
To evaluate the effectiveness of this new design system, the paper conducts experimental research. The methodology used is not fully described, but it appears to involve testing the visual communication design system based on virtual reality technology and comparing its performance to other design systems. The results of this research suggest that the proposed system has good design performance and can effectively improve the effect of visual communication art design.
The paper aims to address the need for more effective visual communication art design by proposing a new design system incorporating virtual reality technology. It uses semi-covered virtual reality graphics achieved through the translation stage as the main methodological approach to achieve this goal. It conducts experimental research to evaluate the system’s effectiveness.
Basic Principles of Artistic Visual Image Reconstruction
Physical Principles of Artistic Visual Image Reconstruction
The radiant intensity of the virtual ray is attenuated as it passes through the medium. In order to simplify the analysis, we assume that the virtual rays generated by the ray source are monochromatic, then we have
represents the attenuation coefficient of the object at
,
is the thickness through which the virtual ray passes, and
is the intensity of the virtual ray at
. After the item is shifted, both sides are divided by
, and
is set to have
The above differential equation is solved, we get
Then, formula (3) is obtained by taking the logarithm of both sides
p(s) is the projection data required by the reconstruction algorithm, s is the thickness through which the virtual ray passes, I(s) is the radiant intensity after the virtual ray passes through the thickness of s, and I(0) is usually obtained by air scanning. Because the attenuation coefficients of different materials inside the object to the virtual light are different, the tomographic image can reflect the internal structure information of the object.
The Equationequation (4)(4)
(4) describes the Beer-Lambert law, which relates the amount of light absorbed by a material to its thickness and the concentration of absorbing material present. In this equation, p(s) represents the optical density of the material at a certain thickness, s. Optical density is a measure of how much light is absorbed by the material at a specific wavelength. I(s) represents the intensity of light that has passed through the material at thickness s, while I(0) represents the initial intensity of the light before it passed through the material. The integral term,
, represents the amount of light absorbed by the material as it passes through a distance s. The quantity μ(η) represents the absorption coefficient of the material at a distance η, which is a measure of how strongly the material absorbs light. The Beer-Lambert law is widely used in spectroscopy and other fields that involve the interaction of light with matter. It provides a way to quantitatively measure the concentration of absorbing material present in a sample, based on the amount of light absorbed at a specific wavelength.
Analytical Reconstruction Algorithms
This paper only describes the 2-dimensional Radon transform, that is, the function line integral. In a 2-dimensional parallel beam art visual image, the Radon transform corresponds to the virtual ray projection transform, which is defined as follows:
Among them, is the attenuation coefficient at the point (x, y) on the xoy plane,
is the Dirac function,
is the angle with the X axis, and the Radon transformation is the line integral of the function
along the straight line
. The 2D Radon inverse transform is
is recorded as the result of the 1-dimensional Fourier transform of the variable t in
, and U(u, v) is the result of the 2-dimensional Fourier transform of the function
. The 2D Fourier Center Slice Theorem states that:
If the line integral (projection data) of the function
in all directions is known, the 1-dimensional Fourier transform is performed on the projection data, the spectrum of the unknown function
(that is, the function
) can be obtained from the formula (7).
The EquationEquation (7)(7)
(7) represents the polar coordinate representation of a two-dimensional function, where U(x,y) is a function of two variables and ϕ is an angle representing the orientation of the coordinate system. In this equation, ξ is the radial distance from the origin to a point (x,y) in the Cartesian coordinate system, which is transformed into polar coordinates using the formulas ξ=√(x^2+y^2) and ϕ=tan^(−1)(y/x). The function U(x,y) describes the value of the original function at the point (x,y) in the Cartesian coordinate system.
By substituting the polar coordinates into the equation, we obtain , which describes the value of the function at a point (ξ, ϕ) in the polar coordinate system. This representation can be useful in situations where the function exhibits some rotational symmetry, such as in problems involving circular or cylindrical geometries.
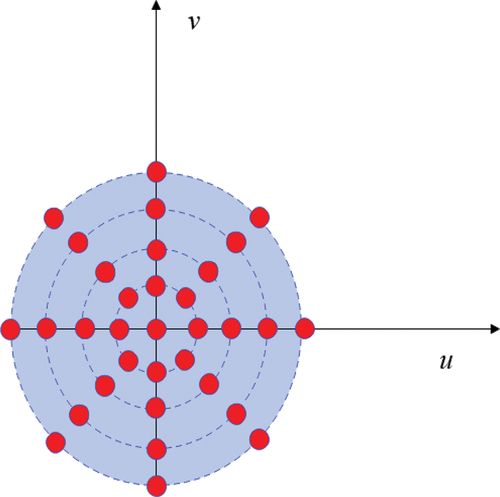
Finally, is obtained by inverse 2-dimensional Fourier transform. At the same time, because the projected Fourier transform
corresponds to a straight line passing through the origin in the frequency domain, that is, the value of
is radially distributed in the frequency domain, as shown in . As shown in , the farther away from the origin (that is, the higher the frequency), the sparser the radially distributed points, and the larger the error of the value. However, the high-frequency components in the image frequency domain correspond to the details of the image, and the error of the high-frequency components will lead to the loss of details in the reconstructed image.
Figure 1. The Fourier transform of the line integral of the function is radially distributed in the frequency domain.
The Filtered Back Projection (FBP) algorithm is derived from another angle and overcomes the shortcomings of the above methods. The derivation is as follows. The attenuation distribution μ(x,y) can be obtained by 2-dimensional inverse Fourier transform
We perform polar coordinate transformation on the frequency domain Cartesian coordinate system (u, v) and transform it into . Among them, there is
. Formula (8) can be written as
Among them, there is . The angle
is segmented integral
, the formula (9) can be transformed into
Because of the following property , formula (10) can be transformed into
We set .
is obtained from formula (7) and is substituted into formula (11) to obtain
Among them, there is
The FBP algorithm is mainly divided into two parts: filtering and back-projection. Formula (13) represents the filtering process, and formula (12) represents the back-projection process.
Classic Iterative Reconstruction Algorithm
Although the analytical reconstruction algorithm is computationally efficient, the assumptions of analytical reconstruction on the artistic visual image system model are too simplistic and ideal. In practical application, the quality of the reconstructed image obtained by the iterative reconstruction algorithm is higher than that of the analytical reconstruction algorithm because it can better model the artistic visual image system.
The tomographic image to be reconstructed is divided into discrete pixel blocks, and the pixel value represents the attenuation coefficient at the pixel block, then the discrete tomographic image and projection data have the following linear relationship:
Among them, is the system matrix,
is the image to be reconstructed (the 2-dimensional image is expanded into a 1-dimensional vector. In this paper, when a 2-dimensional subscript is used,
represents the pixel value at the 2-dimensional image (i, j)). At the same time,
is the projection, M is the number of projections, and N is the number of pixels.
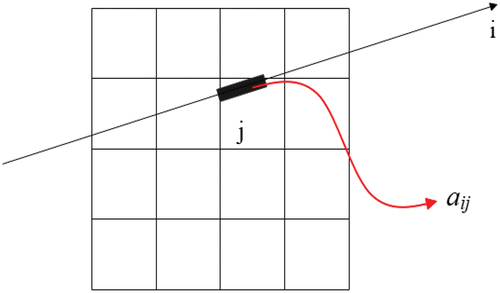
The elements of the system matrix are the solutions of the system model. The line-driven model is intuitive and computationally efficient. The distance-driven model is more accurate than the line-driven model, but it is complex and has low computational efficiency. The regional integral model is the most accurate model in theory, but the calculation is quite complicated, and this model is rarely used. When the size of the pixel block is not much different from the size of the detector unit, the effects of the line-driven model and the distance-driven model are almost the same. Specifically, as shown in , the line-driven model defines the element A of the system matrix as the length of the intersecting line segment between the i-th ray and the j-th pixel block.
Figure 2. Pixel block and line driver.
The formula of the ART algorithm is as follows:
Among them, n is the total number of iterations, is the relaxation factor, and
is the projected value of ray i.
represents the pixel
updated by the i-th sub-iteration in the n-th total iteration, and
is the i-th row of the system matrix A. The ART algorithm converges quickly. However, because the ART algorithm only uses the projection of one ray for each iterative update, due to the instability of the numerical calculation, the reconstructed results of the ART algorithm may have salt and pepper noise.
The formula of the SART algorithm is as follows:
Among them, n is the number of iterations, is the relaxation factor, and there is
.
The Ordered-Subset Simultaneous Algebraic Reconstruction Technique (OS-SART) algorithm is proposed and its convergence is proved. Compared with the SART algorithm, the OS-SART algorithm converges faster. On the other hand, physically, the acceleration of SART algorithm is realized with the help of GPU parallel computing. There are two main forms of OS-SART algorithm, and the formulas are as follows:
Meanwhile, there is
The difference from the SART formula is . The projected index set
is divided into T non-empty subsets
that do not intersect each other.
is called an Ordered-Subset.
Regularization Method Based on Image TV
In order to narrow the feasible region of the solution, the prior knowledge of the tomographic image to be reconstructed is generally described as the objective function. The above linear equations are used as constraints (data fidelity terms), and the optimization model is used to describe the reconstruction of artistic visual images. Because the attenuation coefficients of the same organ tissue in the human body or the same material in the detection object in the industry are the same or similar, it is assumed that the grayscale distribution of the tomographic image to be reconstructed is Piecewise Constant distribution, and its gradient amplitude image (The image (i, j) position element is is sparse. The TV of image f is defined as:
That is, the -norm of its gradient magnitude image.
TV is used for sparse angle art visual image reconstruction, and its model is as follows:
Actual artistic visual image reconstruction is taken into account. Due to the presence of noise in the projection data, that is . In 2008, SidkyEY et al improved the above model as:
Geometry of Semi-Covered Artistic Visual Images
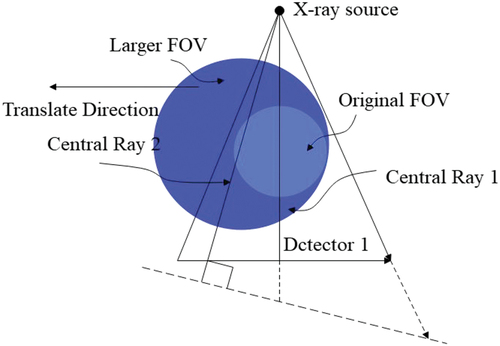
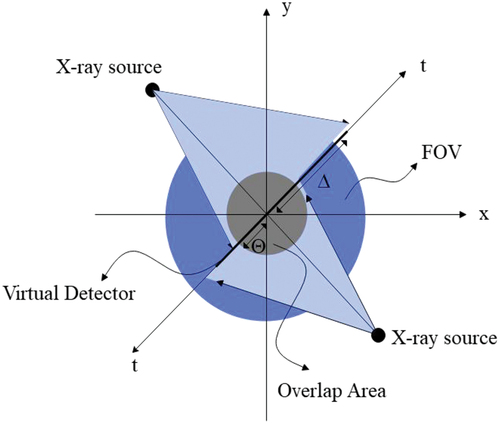
In other application areas of artistic visual imagery, such as industrial artistic visual imagery, the FOV can also be enlarged by a translation stage, as shown in . The dark gray circle is the original FOV with the ray source and detector (Dete art visual image or1) stationary. After translating the turntable to the left (that is, translating the center of rotation), an enlarged FOV (light gray circle with dark gray circles inside) is obtained. The projection data is interpolated to a virtual detector (Dete art visual image or 2), and the new central ray is defined as CentralRay2. The translation stage and the offset detector are theoretically equivalent.
Figure 3. Translation stage.
Because of the above-mentioned equivalence, for the convenience of description, when the half-coverage artistic visual image is illustrated with figures later in this paper, the half-coverage artistic visual image realized by the biased detector is drawn. Some of the terms defined in this paper, such as the FOV coverage of the semi-covered art visual image to be defined below, are also described based on (biased detector art visual image).
Figure 4. Biased detector.
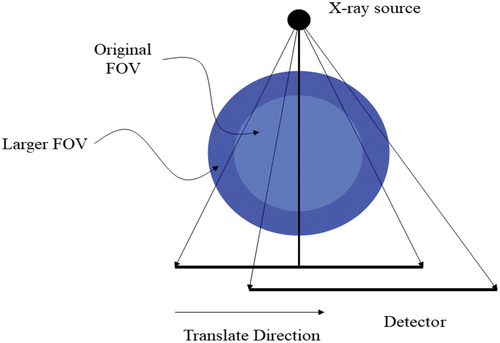
As shown in , the small dark gray circle in the center is the original FOV. By biasing the detectors, the FOV is enlarged into the large light gray circles (with small dark gray circles inside) in . For ease of description, as shown in , it is assumed that there is a virtual detector through the center (the triangle formed by the ray source and the virtual detector is similar to the triangle formed by the ray source and the actual detector). The coverage of the FOV by the semi-covered artistic visual image (abbreviated as FOV coverage) is defined as
Figure 5. Rays are partially redundant.
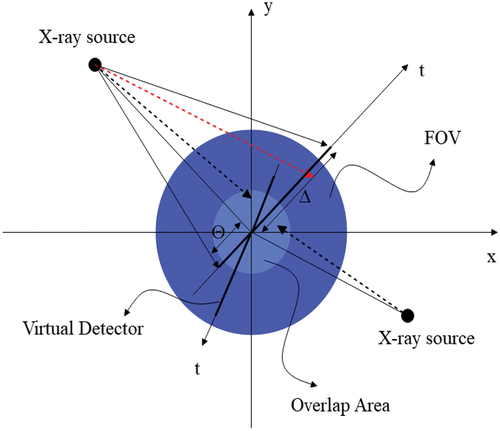
Among them, the definitions of and
are shown in .
Analytical Semi-Coverage Art Vision Image Reconstruction Algorithm
When the scanning rotation angle of the fan-beam art visual image is 2π, the ray projection is redundant. As shown in , the center dark gray circle is the overlapping area, and the light gray large circle (including the center dark gray circle) is the FOV that half covers the artistic visual image. A commonly used weighting function is the Parker weighting function. The Parker weight function is defined as follows:
Figure 6. Location of redundant rays.
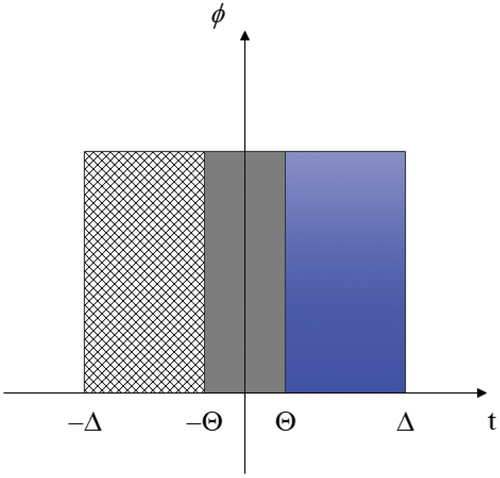
t is the virtual detector coordinate, SO is the distance from the ray source to the rotation center, and is the rotation angle.
Weighted FBP (WFBP) algorithm formula is as follows:
Among them, there is is the Parker weight function,
is the projection, and h(t) is the convolution kernel. Meanwhile, SO is the distance from the ray source to the rotation center,
is the rotation angle, and t is the virtual detector coordinate. WFBP algorithm is fast, but when the coverage of FOV is small, the reconstruction results are not ideal.
Iterative Half-Coverage Art Visual Image Reconstruction Algorithm
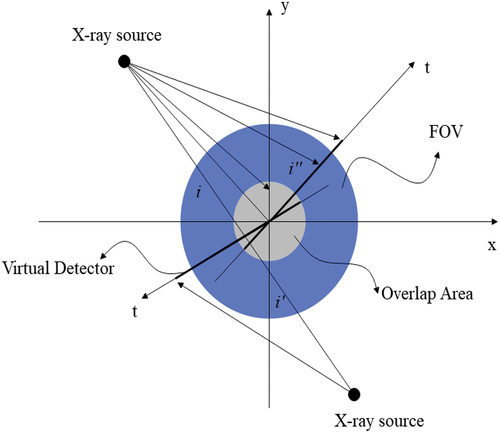
Because in the FOV of the semi-covered artistic visual image, the coverage of the projection is not uniform, and this non-uniformity is caused by part of the projected rays.
The idea of OS-SART algorithm and residual weighting is adopted, and the algorithm is called Weighted OS-SART (W-OS-SART) algorithm. The W-OS-SART algorithm adopts the following reconstruction formula:
Among them, represents the result of the nth iterative reconstruction of pixel j,
is the loose factor of the SART algorithm, and there is
is the projection value of the ray i. Meanwhile,
is the weight of ray i,
is an ordered subset, and
contains the projected rays covering the brown area in . The ray source emitting the two beams is symmetrical about the origin. The algorithm updates each iteration using
projections,
is the number of elements in set
.
Figure 7. An ordered subset of the W-OS-SART algorithm.
The following weighted least squares problem is used as the data fidelity term:
w is the diagonal matrix whose element
is the weight of the i-th projection. The ideas of ART algorithm and WFBP algorithm are combined, and the proposed algorithm is called Weighed ART (WART) algorithm, and its formula is as follows:
Among them, n in represents the nth total iteration, i represents the iteration using the i-th ray, and
is the relaxation factor of the ART algorithm. At the same time, w is a diagonal matrix, and its element
is the result of discrete values of Parker function
in the WFBP algorithm. Since the ART algorithm only uses one projection ray for each iterative update (back projection), it is only necessary to perform residual weighting on the projections used in the current iteration. The weighting process is intuitive and easy to operate.
We consider transforming solving the data fidelity term Af=b into solving the following weighted least squares problem:
Among them, is the system matrix, and
is the image to be reconstructed (the 2-dimensional image is expanded into a 1-dimensional vector). At the same time,
is the projection, N is the number of pixels, and M is the number of projections. V is a
diagonal matrix whose elements are
. Obviously, there is
.
According to the SART algorithm, it essentially uses the gradient descent method to solve the formula (28), and the derivation process will be described in detail below. The iterative formula for the SART algorithm is reviewed:
Among them, n is the number of generations, is the relaxation factor, there is
.
is the value of the nth iteration of pixel j, and
is the value of the projected ray i. Then, the SART iteration formula can be written as:
Among them, V is the diagonal matrix, and its element is
is the
diagonal matrix, and its element is
, that is, the projection normalization of all back-projections to pixel j is performed. In formula (28), the gradient of
to f is
. According to formula (30), the iterative formula of the SART algorithm can be written as:
To sum up, the SART algorithm essentially uses the gradient descent method to solve . Only for each pixel
, the step size of gradient descent is different. For example, the step size of pixel
is
, and the connotation of the step size in the SART algorithm will be explained below. The function of the weighting matrix V in the formula (28) can be regarded as dividing by the thickness of the ray passing through, that is
or written in matrix form
. Projection rays are normalized so that each projection contributes the same, or “unit” to the data fidelity term. The “unit” projection ray
is then used for back-projection, that is
or written in matrix form
. Because the rays used in the back-projection process are “unit,” for pixel j, the “size” of its iterative update is
, that is, the weighted sum of the contributions of all rays passing through pixel j. The 1 multiplied in front of
is the weight of the projected ray i, and 1 means that the ray i is “unit.” By dividing by
, that is
, or matrix form
is written such that for pixel j, its iterative update is “unitary.” Because for each pixel, its iterative update is “unit,” so for the whole image, the iterative update is uniform.
However, in semi-covered artistic visual images, this uniformity of the data fidelity term is destroyed because the projection is partially redundant. We consider the following weighted least squares model to keep data fidelity terms consistent:
is the
diagonal matrix, w is the
diagonal matrix, and the elements of w are obtained by discretizing the Parker weight function (EquationEquation (6)
(6)
(6) ). Therefore, the elements of
are
. The weighted projection i is no longer “unit,” but has a weight of
. As shown in , after weighting, the additional projections, such as projection i and projection
(a pair of rays with opposite incident directions and coincident paths), contribute “unitary” to the data fidelity term because of
. However, non-redundant projections, such as projection
, have a weight of
.
Figure 8. Redundant weighting of rays in a semi-covered artistic vision image.
After the residual weighting, the contribution of each ray is no longer “unit,” but the weight is . Then, we use the co-weighted projection for back-projection, that is,
or
in matrix form. After back-projection, for pixel j, the “size” of its iterative update is
, which is the weighted sum of the contributions of all rays passing through pixel j. The
multiplied in front of
indicates that the weight of ray i is
. Therefore, it needs to be divided by
, which is
, or written in matrix form
. The elements of matrix
are taken as
, so that for pixel j, its iterative update is “unitary.” Because for each pixel, its iterative update is “unit,” for the whole image, the iterative update is uniform.
To sum up, the iterative formula of the developed WSART algorithm for half-coverage artistic visual image reconstruction is as follows:
That is:
Visual Communication Design System Based on Virtual Reality Technology
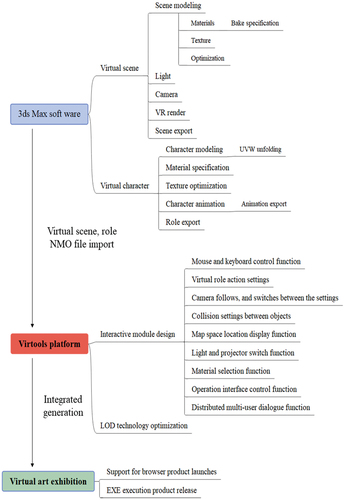
The visual communication design system based on virtual reality technology consists of two parts: the creation of virtual environment and the setting of interactive modules, as shown in .
Figure 9. Visual communication design system based on virtual reality technology.
After the art system is constructed in this paper, the visual communication art design is carried out in combination with the algorithm in the second part, and the quantitative effect evaluation of the visual communication design system based on virtual reality technology proposed in this paper is carried out, and the results shown in and are obtained.
Figure 10. Statistical diagram of the quantitative effect of the artistic design of the visual communication design system based on virtual reality technology.
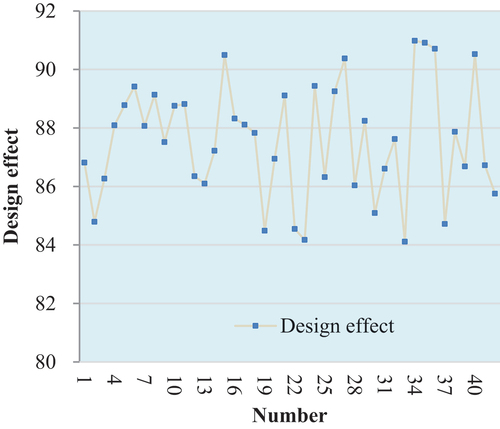
Table 1. Statistical table of the quantitative effect of artistic design of visual communication design system based on virtual reality technology.
It can be seen from the above research that the visual communication design system based on virtual reality technology proposed in this paper has good design performance and can effectively improve the effect of visual communication art design.
In general, VR can be included in art design in a variety of ways. One of the most common approaches is to use VR as a tool for creating immersive and interactive art experiences. Artists can use VR technology to create virtual environments that users can explore and interact with, allowing them to experience art in new and exciting ways. VR can also be used to enhance traditional art forms, such as painting, sculpture, and installation art. For example, artists can create 3D models of their works and use VR technology to create a virtual exhibition that allows viewers to experience the art from different angles and perspectives. This can be particularly useful for large or complex installations that may be difficult to view in a traditional gallery setting. Another way that VR can be included in art design is by using it as a tool for collaboration and experimentation. Artists can work together in virtual environments to create new works of art, or they can use VR technology to experiment with different techniques and approaches to art-making.
Also, VR provides a range of benefits to art design. One of the primary advantages of VR is that it allows artists to create immersive and interactive art experiences. By using VR technology, artists can create virtual environments that users can explore and interact with, providing them with a new and exciting way to experience art. VR also provides artists with a powerful tool for creating new and innovative art forms. By leveraging the capabilities of VR technology, artists can experiment with new techniques, materials, and approaches to art-making, pushing the boundaries of traditional art forms and creating new and unique works of art.
Additionally, VR can provide artists with new opportunities for collaboration and communication. By working together in virtual environments, artists can collaborate on projects in real-time, regardless of their physical location. This can be particularly useful for artists who are located in different parts of the world, or who are working on projects that require complex coordination and communication. Finally, VR technology can also provide artists with new ways to reach and engage with audiences. By creating virtual exhibitions, artists can showcase their work to a global audience, without the limitations of physical space and time. This can help to broaden the reach and impact of their work, and connect them with new and diverse audiences.
Discussion
In this paper, we proposed a visual communication design system that incorporates virtual reality technology and demonstrated how semi-covered virtual reality graphics achieved through the translation stage can be used to improve the effectiveness of visual communication art design. We also suggested that explainable applied AI can contribute to the model by providing interpretable explanations of the system’s decision-making process.
The experimental research conducted in this study demonstrated the effectiveness of the proposed design system in improving the effect of visual communication art design. Our results showed that the system achieved good design performance and provided better outcomes compared to other design systems tested.
The incorporation of explainable applied AI into the design system was found to be promising. By providing clear and interpretable explanations of the system’s decision-making process, designers can gain a better understanding of the system’s strengths and limitations and improve its overall performance.
However, there are limitations to our study. The methodology used in the experimental research was not fully described, which may limit the ability to replicate the results obtained. Additionally, the study focused on a specific aspect of visual communication art design, and it is unclear how well the proposed system would perform in other design contexts.
Furthermore, while explainable applied AI has potential to contribute to the proposed system, more research is needed to fully evaluate its effectiveness and applicability. This includes exploring different algorithms and methods for generating interpretable explanations, as well as evaluating the impact of these explanations on design outcomes.
In conclusion, the proposed visual communication design system incorporating virtual reality technology and semi-covered virtual reality graphics achieved through the translation stage is a promising approach to improving the effectiveness of visual communication art design. Incorporating explainable applied AI has potential to further enhance the system’s performance, but more research is needed to fully evaluate this approach.
Conclusion
The visual communication design system based on virtual reality technology is a system developed by the combination of virtual reality technology and art design. It makes full use of computer, virtual reality, network and other technologies, and combines many design elements of art design to develop a virtual art design platform that is both technical and artistic. As the realization of the interactive function of virtual reality technology, the visual communication design system based on virtual reality technology is more perfect, the simulation of virtual scenes is more realistic, and the display of digital works is more convenient. This paper combines virtual reality technology to analyze the quantitative impact of visual communication art design to improve the effect of visual communication art design. The experimental research shows that the visual communication design system based on virtual reality technology proposed in this paper has good design performance and can effectively improve the effect of visual communication art design.
While the experimental research conducted in this study demonstrated the effectiveness of the proposed design system, there are limitations and future research perspectives that need to be considered.
One limitation of the study is that the methodology used in the experimental research was not fully described. This makes it difficult to replicate the results obtained and limits the ability to evaluate the validity and reliability of the research findings. Future research should aim to provide a more detailed description of the methodology used, including the sample size, experimental design, and statistical analysis methods used.
Another limitation of the study is that it focuses on a specific aspect of visual communication art design. While the proposed system shows promise for improving the effectiveness of visual communication art, it is unclear how well the system would perform in other design contexts. Future research could explore the effectiveness of the proposed system in a variety of design contexts to determine its generalizability and applicability.
Additionally, while the paper suggests that explainable applied AI can contribute to the proposed system, more research is needed to fully evaluate the effectiveness of this approach. Future research could explore different algorithms and methods for generating interpretable explanations, as well as evaluate the impact of these explanations on design outcomes.
In conclusion, while the proposed visual communication design system incorporating virtual reality technology and semi-covered virtual reality graphics achieved through the translation stage shows promise for improving the effectiveness of visual communication art design, there are limitations and future research perspectives that need to be considered. Addressing these limitations and exploring the potential of the proposed system in different design contexts could lead to a better understanding of its effectiveness and applicability.
Disclosure statement
No potential conflict of interest was reported by the author.
Additional information
Funding
References
- Andreeva, Y. M., V. C. Luong, D. S. Lutoshina, O. S. Medvedev, V. Y. Mikhailovskii, M. K. Moskvin, V. P. Veiko, V. V. Romanov, N. N. Shchedrina, and V. P. Veiko. 2019. Laser coloration of metals in visual art and design. Optical Materials Express 9 (3):1310–1307. doi:10.1364/OME.9.001310.
- Areeb, Q. M., R. Imam, N. Fatima, and M. Nadeem. 2021. AI art critic: Artistic classification of poster images using neural networks. In 2021 International Conference on Data Analytics for Business and Industry (ICDABI), 37–41. doi:10.1109/ICDABI53623.2021.9655869.
- Ascott, R. 2007. Syncretic fields: Art, mind, and the many realities. In 17th International Conference on Artificial Reality and Telexistence (ICAT 2007), 3. doi:10.1109/ICAT.2007.63.
- Bastogne, T. 2017. Quality-by-Design of Nanopharmaceuticals–a State of the Art. Nanomedicine: Nanotechnology, Biology and Medicine 13 (7):2151–57. doi:10.1016/j.nano.2017.05.014.
- Chen, Z., L. Chen, Z. Zhao, and Y. Wang. 2020. AI illustrator: Art illustration generation based on generative adversarial network. In 2020 IEEE 5th International Conference on Image, Vision and Computing (ICIVC), 155–59. doi:10.1109/ICIVC50857.2020.9177494.
- Gao, Z., S. Man, and A. Wang. 2022. AI art and design creation industry: The transformation from individual production to human-machine symbiosis. 2022 World Automation Congress (WAC) 52–56. doi:10.23919/WAC55640.2022.9934515.
- Han, Z. 2021. Combined development of artificial intelligence and art design. In 2021 6th International Conference on Intelligent Computing and Signal Processing (ICSP), 1023–26. doi:10.1109/ICSP51882.2021.9408896.
- Jordan, D., and H. O’Donoghue. 2018. Histories of change in art and design education in Ireland: Towards reform: The evolving trajectory of art education. International Journal of Art & Design Education 37 (4):574–86. doi:10.1111/jade.12205.
- Klockars, K. W., N. E. Yau, B. L. Tardy, J. Majoinen, T. Kämäräinen, K. Miettunen, O. J. Rojas, M. Borghei, J. Beidler, and O. J. Rojas. 2019. Asymmetrical coffee rings from cellulose nanocrystals and prospects in art and design. Cellulose 26 (1):491–506. doi:10.1007/s10570-018-2167-7.
- Knight, E., J. Daymond, and S. Paroutis. 2020. Design-Led strategy: How to bring design thinking into the art of strategic management. California Management Review 62 (2):30–52. doi:10.1177/0008125619897594.
- Lockheart, J. 2018. The importance of writing as a material practice for art and design students: A contemporary rereading of the Coldstream reports. Art, Design & Communication in Higher Education 17 (2):151–75. doi:10.1386/adch.17.2.151_1.
- Luo, Z., and J. Dai. 2017. Synthetic genomics: The art of design and synthesis. Sheng Wu Gong Cheng Xue Bao= Chinese Journal of Biotechnology 33 (3):331–42. doi:10.13345/j.cjb.160411.
- Maras, K. 2018. A realist account of critical agency in art criticism in art and design Education. International Journal of Art & Design Education 37 (4):599–610. doi:10.1111/jade.12206.
- McCartney, N., and J. Tynan. 2021. Fashioning contemporary Art: A new interdisciplinary aesthetics in art-design collaborations. Journal of Visual Art Practice 20 (1–2):143–62. doi:10.1080/14702029.2021.1940454.
- Mourtzis, D. 2020. Simulation in the design and operation of manufacturing systems: State of the art and new trends. International Journal of Production Research 58 (7):1927–49. doi:10.1080/00207543.2019.1636321.
- Nebessayeva, Z., K. Bekbolatova, K. Mussakulov, S. Zhanbirshiyev, and L. Tulepov. 2018. Promotion of entrepreneurship development by art and design by pedagogy. Opción 34 (85–2):729–51.
- Ravelomanantsoa, M. S., Y. Ducq, and B. Vallespir. 2019. A state of the art and comparison of approaches for performance measurement systems definition and design. International Journal of Production Research 57 (15–16):5026–46. doi:10.1080/00207543.2018.1506178.
- Sachdev, G. 2019. Engaging with plants in an urban environment through street art and design. Plants, People, Planet 1 (3):271–89. doi:10.1002/ppp3.10055.
- Srinivasan, R., and K. Uchino. 2021. Quantifying confounding bias in AI generated art: A case study. In 2021 IEEE International Conference on Systems, Man, and Cybernetics (SMC), 1775–82. doi:10.1109/SMC52423.2021.9658705.
- Tsai, K. C. 2017. Teacher-student relationships, satisfaction, and achievement among art and design college students in macau. Journal of Education and Practice 8 (6):12–16.
- Tummala, S., S. Narendra Bhargava, S. Shravani, R. Bodke, and N. Kulkarni. 2022. AI virtual hardware. In 2022 IEEE Pune Section International Conference (PuneCon), 1–6. doi:10.1109/PuneCon55413.2022.10014775.
- Wan, Q., S. S. Song, X. H. Li, Q. Zhang, X. Yang, Y. C. Zhang, and A. Design. 2018. The visual perception of the cardboard product using eye-tracking technology. Wood Research 63 (1):165–78.
- Wang, Y., and M. Hongyu 2019. The value evaluation of artificial intelligence works of art. In 2019 International Joint Conference on Information, Media and Engineering (IJCIME), 445–49. doi:10.1109/IJCIME49369.2019.00096.
- Yi, G. 2017. Design research on the network multimedia courseware for art-design teaching. Eurasia Journal of Mathematics, Science and Technology Education 13 (12):7885–92. doi:10.12973/ejmste/80722.
- Yin, Y., Z. Chen, Y. Zhao, L. Jiongqi, and K. Zhang. 2020. Automated Chinese seal carving art creation with AI assistance. In 2020 IEEE Conference on Multimedia Information Processing and Retrieval (MIPR), 394–95. doi:10.1109/MIPR49039.2020.00086.