
 ?Mathematical formulae have been encoded as MathML and are displayed in this HTML version using MathJax in order to improve their display. Uncheck the box to turn MathJax off. This feature requires Javascript. Click on a formula to zoom.
ABSTRACT
The agricultural products price has been affecting people’s livelihood issues and economic and social security and stability. The cyclical fluctuation of the price of agricultural products often indirectly affects the inner psychological demand of agricultural consumers. If the prices of production and processing industries, which rely on cheap raw materials as basic raw materials, are subject to frequent and abnormal fluctuations, it is likely to cause further widespread concerns about people’s lives, and ultimately lead to a vicious cycle of falling commodity prices. In recent years, as a result of lack of timely authoritative information all the time, the market price of agricultural products appeared a lot of varieties before short-term rise and fall repeatedly phenomenon. This paper attempts to take the quantity of garlic produced and sold by pork in China as the key object of analysis and research, and analyzes the level of market price index and the main factors influencing the price of pork sales and edible garlic demand in China in recent ten years. In information economics, financial market theory, statistical methods and other relevant mathematical model as the main guidance, combined with China’s agricultural prices during the period of policy, select the RBF neural network theory and the analysis methods for technical improvements, in a variety of market factors affecting economic operation under the mixed operation China period in our country agricultural prices technology wave prediction rule, broken Based on the traditional artificial statistics and forecasting model method of agricultural product price, the short-term forecasting model of Chinese agricultural product market price theory based on information technology innovation method was established.
Introduction
The forecasting ability of price trend is one of the most important technical elements in market consumption and decision-making process (Chen et al. Citation2019). Price trend prediction can be defined as quantitative prediction of future price changes or trends of all kinds of commodities based on the general rule of historical price changes and other influencing factors (Chen et al. Citation2019). Decision-makers can also analyze and judge the future trend of the historical price index level only by understanding the characteristics of the historical price rules and general facts of the market in the past, so that the harmonious and orderly operation of the market as a whole and the basic order can be effectively guaranteed (Cheng et al. Citation2016). Traditionally, the data methods used to predict the trend of real estate prices generally focus on field research and analysis of social market and artificial data statistics. However, these research methods usually not only cost a lot of expensive human and material resources in society, but also are generally limited in their application areas, which may eventually bring some extremely possible errors to the real estate prediction data results we finally give. With the progress of The Times, the continuous development of technology, the continuous innovation of the network, the high level of information retrieval function makes it possible to process and analyze a large amount of data. Data mining technology is gradually surging into the tide, and the price forecasting industry has correspondingly broken through the limitations of manual data collection (Jia et al. Citation2022). Price forecasting method based on data mining technology has become a hot spot in the field of economic market research (Chiu et al. Citation2021).
The essence of agricultural products is actually quite special. Agricultural products in vegetable production structure is not so stable, mature and has some regional characteristics of agricultural products, and sales of circulation is more special, often may face the potential for short-term supply and demand contradictions appear, agricultural products also will appear frequently neglected or agricultural products sold out or no one bothers to market phenomenon (Yeong Hyeon et al. Citation2022). Therefore, the price trend forecast index of agricultural products really becomes an important and effective means for a country to control the current market price of agricultural products, to avoid conflicts. Suppose the trend of bulk agricultural products is analyzed and predicted by the statistical method of mathematical theoretical modeling. In that case, it can not only effectively improve the work efficiency in the processing of forecast data to a great extent, but also ensure the accuracy of the forecast data results. According to the actual number of predicted analysis objects, price change prediction can also be divided into single factor prediction research method and price combination research and analysis method. Single prediction method is for one entity, while combination analysis method is for multiple entities.
In recent years, the overall fluctuation level of the market price of agricultural products is very large, but the domestic market objectively still lacks a professional and scientific system of analysis and prediction evaluation method, timely effective adjustment control and allocation optimization (Costa and Dolog Citation2019). It is a very important and urgent market demand to establish an accurate, reliable and stable research model for predicting the price trend of agricultural products in China, analyze the price trend of agricultural products accurately and systematically in the future, and maintain the long-term stable and high growth of the national agricultural products market (Da’u and Salim Citation2020). Therefore, the preliminary research direction proposed in this paper should be to establish a more scientific and accurate dynamic calculation and analysis model of short-term agricultural product price index, and hope to use neural network to solve some of the above short-term price change prediction model problems that cannot be perfectly realized by traditional methods. A more accurate quantitative prediction of long-term agricultural price fluctuations would be able to point the way for final consumers and potential producers to make decisions.
Price Analysis of Agricultural Products
Current Situation of Agricultural Prices
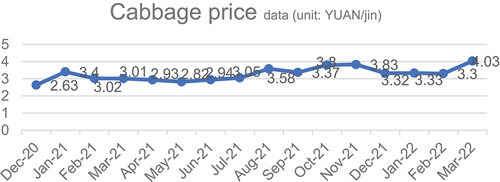
In recent years, China’s bulk agricultural products market on the international spot market price trend and its fluctuations change frequently and violently (Das, Sahoo, and Datta Citation2017). Large and continuous seasonal agricultural price increases and spot prices continue to fall price trend changes have gradually become a historical normal (Dong et al. Citation2017). By analyzing the above price charts, it is relatively easy to clearly observe the latest price trend of several iconic spot price charts of agricultural products in recent years. The price trend charts of soybeans, corn, eggs and Cabbage in China in recent years are shown in respectively:
Figure 1. Soybean price data.
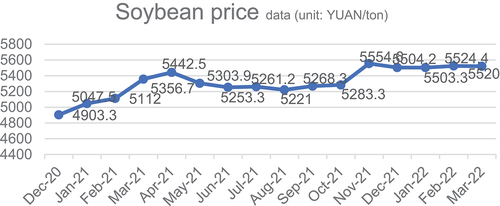
Figure 2. Corn price data.
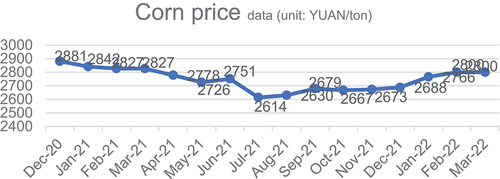
Figure 3. Egg price data.
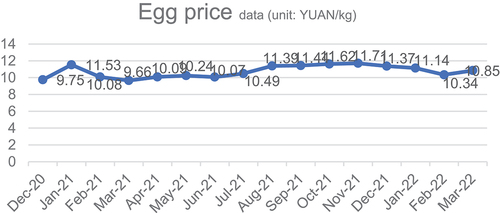
Figure 4. Cabbage price data.
The continuous sharp and rapid increases in the prices of agricultural products, especially meat and poultry, pork, onion, ginger, garlic and other daily necessities, as well as corn and other important basic agricultural products, will have a direct impact on the living standards of the Chinese people (Ran and Zhongwu Citation2020). The consumption of traditional agricultural products such as grain and soybean accounts for the largest share in the total retail consumption of agriculture in China. Once China’s grain prices rise sharply, the whole rural social life of the whole grassroots economy will be greatly affected (Jinhao Citation2020). Most residents will probably feel uneasy about this price change all the time. Phenomena like this one, such as salt looting in 2011, can easily lead to social unrest.
Accordingly, a sharp unilateral fall in agricultural prices in the short term is not necessarily a good thing (Raja et al. Citation2020). From the perspective of short-term impact, the sharp decline in agricultural prices is undoubtedly helpful to the improvement of the material life of ordinary consumers and their families, which can significantly reduce farmers’ production costs and living costs, thus greatly improving the quality of life of residents (Dhelim et al. Citation2020). However, agricultural products are also an important part of the market economy industry chain. In the medium and long run, a small drop in agricultural prices in the short term may lead to a loss of consumer confidence in agricultural demand in the short term. As a result, producers will plant fewer seeds the following season, which in turn will lead to a sharp drop in crop yields the following season and a corresponding spike in market prices (Da’u and Salim Citation2020). This will eventually form a vicious circle of interests that destroys the existing market prices of agricultural products, and will inevitably affect the relative stability and healthy development of market economy prices (Sheikh et al. Citation2019).
It must be mentioned that it is essential to consider the social, cultural, and historical factors that shape the production and consumption of agricultural products, as well as the power dynamics and interests of different stakeholders in the agricultural sector (Liu et al. Citation2019). Furthermore, any analysis of agricultural product prices in China must take into account the environmental impacts of agricultural production and the need for sustainable agricultural practices.
It is crucial to recognize that forecasting models are not a panacea for all problems related to agricultural product prices. Rather, they are just one tool among many that researchers and policymakers can use to understand and address these issues. Therefore, it is essential to adopt a holistic approach that integrates various analytical frameworks and methods and considers the broader contextual factors that influence agricultural production and consumption. By doing so, we can develop more comprehensive and effective solutions that promote sustainable agricultural practices, support the livelihoods of farmers and rural communities, and ensure food security and affordability for all.
Market Risks of Agricultural Products
Domestic Macro Risks
From 2015 to 2018, China’s economic growth began to slow year-on-year (Mingsheng et al. Citation2018). By accelerating the reform of the supply structure and focusing on major reforms, China’s economy is rapidly upgrading from a medium-scale, high-speed and large-scale growth model to a high-quality growth model. However, the innovation process is always accompanied by innovation risks, and some entrepreneurial new technology models often can not withstand the test of the flood of time (Castro Campos Citation2020). In June 2018, a large number of P2P lending companies in China went bankrupt. The phenomenon of serious and disorderly operation, P2P lending industry chain has begun to collapse in the form of a domino, a large number of potential investors have suffered direct capital losses, causing a huge destructive impact on the future of the newly developed virtual network market economy (Iqbal, Aryafar, and Anderton Citation2019). On the other hand, in recent years, the non-performing loan ratio of local commercial banks has risen sharply, many banks have bad debts, local small and medium-sized enterprises have gone bankrupt, and the investment system of local governments has changed, leading to fluctuations in local economy.
International Risks
At present, as the world economy moves toward globalization and integration, agricultural products market is also bound to be seriously affected by the current macroeconomic and international environmental risks (Yaseen et al. Citation2018). As the Federal Reserve decided to end its first quantitative market easing in mid-2014, the short-term supply of US treasuries will be gradually reduced (Xiaojun Citation2017). As the world’s most common major currency at the time, dollar treasuries would begin to appreciate gradually. This led to a gradual decline in the price of international agricultural trade in the short term, which was not conducive to the long-term health and stability of the international market for agricultural products and traded raw materials at that time. At the same time, the real economic growth of developing countries has slowed down due to the impact of previous international economic crises in the United States and the global economic downturn. It also did not show the recovery of economic growth before the advent of the international economic crisis, and the economic development slowed down significantly, nor did it lead to a decline in consumer prices, which had a significant negative social impact on the entire international agriculture and trade.
China has the largest agricultural population in the world and is also an important export source of traditional agricultural products. With the deepening of the globalization strategy of economic development, technical trade conflicts between governments around the world become more and more frequent, and tariff protectionism has become an important factor to reduce the international risk system of agricultural products. As a global hegemon, the United States undoubtedly has a great influence on the global economic situation. Since The election of Donald Trump, the United States has exerted a great influence on the current world economic situation due to its series of capricious commercial and political policies. In 2018, Trump also announced economic and trade sanctions against China. At the start of the trade war with the United States, China hit back, raising tariffs of 25% on Soybean exports to the United States. China imports more than 30% of its soybean consumption from the United States each year. In the United States, the United States ranks first and second in soybean production and consumption, respectively. In 2017–2018, the total output of soybeans reached 120 million tons, accounting for 34.56% of the global total, and the total consumption was 57.11 million tons. U.S. soybeans are China’s largest export crop, accounting for nearly 20% of the country’s agricultural exports. Among them, China is the largest soybean exporter to the United States, accounting for 60% of all U.S. soybean exports.
Natural Risks
China has a vast territory and a complex physical geography. Many natural disasters occur frequently in winter every year. Once a natural disaster occurs in a region, agricultural production capacity will suddenly and rapidly decline, and sometimes there will be no agricultural harvest in some disaster areas for years, leading to a sharp rise in the prices of some agricultural products in a short period of time, causing huge double losses to crop producers and ordinary consumers (Yaseen et al. Citation2018).
In recent years, the global environment deteriorates, water resources decrease, and natural disasters occur frequently. For example, in recent years, typhoons and floods have frequently occurred in South China. Eighteen years ago, typhoon Shanhu and flood Ambi both caused considerable material property and losses to some local farmers, destroying their economic achievements in agricultural labor for a whole year.
Natural risks are those that are not controlled by any corporate group. Because of its high degree of uncontrollable, the huge impact on the price of agricultural products is often the most simple and direct, the most profound (Wan et al. Citation2018). Only by adopting advanced and practical means of disaster information technology, enterprises can transmit disaster information to enterprise producers in a timely and effective manner, so as to minimize the potential damage to natural risk factors (Tang and Wang Citation2018).
Influencing Factors of Agricultural Prices
Supply Factors
The price trend of agricultural products is directly influenced by the changes of demand supply and structural supply and demand. In recent years, as the average housing price continues to rise, the value of residential assets in the land resource market is becoming higher and higher (Kumar and Singh Thakur Citation2018). Although China’s current economic policy in many countries and the city government could be as early as 2018 years ago, has been fully in real estate are implemented national macroeconomic regulation and control, the current our country real estate industry risk is cooled, but along with the policy of real estate funds and funds at present domestic large-scale investment, real estate developers a lot of illegal land acquisition and demolition and recycling, It’s still going on today. More and more agricultural land is forced to change its use into rural urban commercial land, which in turn directly leads to the continuous reduction of planned farmland in China’s rural areas. With less arable land and fewer sources of agricultural products, prices will start to rise. With the development of modern Economic strength of Chinese enterprises, production costs will inevitably continue to rise. Rising commodity prices, labor prices and land prices for urban farming are indirectly affecting the rise of domestic agricultural prices. The further development of production and circulation technology and scientific theory, and the steady improvement of the efficiency and quality competitiveness of China’s agricultural product supply system, also continue to affect the future of the world agricultural product price situation healthy and stable development. As those in some remote areas in China, however, backward production, due to convenient also less developed rural network information transmission, the producer itself cannot guarantee a more comprehensive and timely effective timely access to the latest global market conditions quickly and understand the agricultural information resources data and timely summary, analysis and improvement, lead to products supply is often common serious lag behind the production needs. This is very likely to continue to lead to the agricultural market unsalable product prices and agricultural market price competitiveness.
Demand Factors
Agricultural products have always been an important necessity in people’s family life, and the number of babies born in Chinese families is increasing significantly and rapidly since China gradually opened up its two-child policy (Rosa et al. Citation2018). The number of families in the country is increasing, which naturally leads to the strong demand of residents for various agricultural resources. The price of agricultural products is bound to fluctuate with the gradual increase of consumer demand population. With the rapid improvement of people’s living standards, consumers have begun to pay attention to improve their food and clothing consumption, improve the quality of urban life, so the majority of consumers have a higher level of fresh agricultural products have a new requirement. More fresh, exquisite, high-end quality food materials will become a pursuit of urban people’s consumption. Consumers would rather spend many times more than the high price to buy the world’s cutting-edge high-tech products, rather than a lower price to buy those ordinary products. Such new changes in commodity prices and demand require timely notification by commodity producers to ensure the fundamental general balance between supply and demand and the continued stability of prices in the consumer product market as a whole.
Current Costs
Agricultural products from planting and production, to circulation and sales, and then to table consumption, there is a very complete and complex whole industrial chain, circulation in the whole industrial chain is extremely important. There are many levels of products in China’s agricultural products market. From the hands of agricultural producers and farmers to the hands of ordinary consumers, it is necessary to go through a series of multi-level and complex transportation processes, including processing and packaging, storage and transportation, and sales transportation, which directly lead to the rise of agricultural products prices (Barkan and Koenigstein Citation2016). First it is due to the domestic market circulation network system structure is not perfect, at the bottom of the price and the market coping with asymmetric information between the price of less than, the gray effect of cheap agricultural products trade, middlemen downstream farmers to buy agricultural products at a lower price, not the country ahead of the latest relevant information accurately tell producers, agricultural prices set by the buys and sells at a high price at a low price For intermediate consumers, the gray income in the middle market of agricultural products is very high, and this gray phenomenon makes the price level of domestic agricultural products often produce vicious fluctuations. China’s agricultural products storage technology has not reached the international leading level, cold storage and other equipment to preserve fresh agricultural products is not popular. The transportation of fresh agricultural products often goes through multiple levels, and the limited storage capacity will lead to serious product losses, which increases the flow cost of fresh agricultural products, leading to large fluctuations in the price of fresh agricultural products.
Policy Impact
Agricultural planting is a traditional pillar industry with a long history in China. The government has always attached great importance to and supported agriculture. China’s agricultural price policies generally take a long time to implement, and some agricultural markets also focus on macro-control and micro-environmental control. China has also implemented minimum state purchase prices for pillar agricultural products in some regions, effectively protecting the interests of grain producers and stabilizing market price expectations of pillar agricultural products and consumer public opinion. In 2019, the No. 1 Economic Document of the Central Government once again put forward a plan to boost soybean exports, which coincides with the resolution of the major friction between China and the United States in direct agricultural import and export trade since 2018. In order to effectively avoid the import and export restrictions of agricultural products by other agricultural countries, resulting in the fluctuation of the price of Agricultural products in China, the government should actively carry out relevant macro-control policies to implement regulation and control, and strive to improve the processing quality, efficiency and output of soybean products in China through the progress of soybean science and technology production. In terms of Internet science and technology, the policy puts forward the slogan of “Internet + agriculture,” deeply integrating the Internet, science and technology, and agriculture. E-commerce and the Internet of Things work closely with agriculture, transforming agriculture with technology and stabilizing prices with technology. Promote China from a big agricultural country to a strong agricultural country, strengthen themselves, and stabilize the price market of agricultural products.
Other Factors
There are many other main drivers of the slowdown in the month-on-month growth of agricultural prices. For example, during the Chinese holidays, the Lunar New Year, the Mid-Autumn Festival, the Dragon Boat Festival and other major national holidays, the prices of all kinds of high-quality fresh edible agricultural products, especially the market prices of high-quality fresh agricultural products. Will be completely in an irregular growth of the price index to double the growth, can not really continue to be China’s commodity market supply and demand cycle control early warning signals issued by the continued strong guidance. This is a predictable influence factor, it exists for a long time, but the cycle is very short (Yeong Hyeon et al. Citation2022). There are also unknown factors, such as sudden natural disasters and public opinion. The impact of natural disasters is usually regional. For example, in the second half of 2018, an outbreak of African swine fever in Suqian, Jiangsu Province, resulted in 1,369 dead pigs. Local authorities and health authorities immediately carried out mass culling and treatment. Although the epidemic situation has been controlled and pig disease has not been transmitted to consumers through pork, the epidemic situation has broken out and public opinion has spread, and suqian and surrounding counties and cities as well as the whole Jiangsu Province “smell of pig color.” As a result, pork consumption fell sharply, and the price of pork and its products was fatally affected, all the way down. As China’s economy enters a phase of high-quality development, various data also highlight the impact of agricultural prices. For example, the impact of exchange rate on macro and international export. Urban and rural per capita consumption index, consumer price index, Engel coefficient and other information, also have a certain impact on the price of agricultural products.
Research Status
For all kinds of forecast and methods of the price trend of agricultural products, the traditional analysis and forecast research methods can not meet the market needs of the sustainable development of China’s agricultural products market (Chiu et al. Citation2021). In terms of the collection and utilization of price data information, the traditional price data collection generally adopts the traditional manual survey and statistical analysis method, and obtains the real price data through a large number of market data research and interview analysis (Yang Citation2020). However, due to the huge regional differences between different regions, these market data also often have a large range of deviations, which cannot be shared. Manual recording of large amounts of data and information is not only inefficient, but also prone to error. Working researchers may also frequently experience errors in data recording when manual recording acquires large amounts of data (Sharma, Rana, and Kumar Citation2021). The links such as data collection and circulation are extremely complicated, and the large amount of data that are really in the hands of actual researchers are often due to the lack of relevant data. Although the weighted average of the error derived by manual calculation can compensate the results in time, it has a great influence on the final prediction results. In terms of forecasting methods, traditional agricultural product price forecasting generally adopts empirical estimation method and factor estimation method (Zheng, Noroozi, and Yu Citation2017). Empirical estimation method is based on the rich experience and knowledge of researchers, combined with past years and existing data, to estimate the price trend of agricultural products (Mingsheng et al. Citation2018). This prediction method does not need detailed data resources, but can complete the prediction through a piece of data, but the prediction results are often not convincing (Kumar and Singh Thakur Citation2018). Factor estimation method refers to the mathematical knowledge as the theoretical basis, through the past data to calculate, draw dotted lines, with a straight line trend to evaluate and predict the price of agricultural products (Rosa et al. Citation2018). The calculation of this prediction method is meticulous and complicated, and the manual calculation process is prone to error. In addition, the method cannot predict the price of products with a long cycle, nor can it take into account various factors that may affect the price.
With the development of data mining technology, manual calculation can not meet the demand of product price prediction. What is needed at present is fast data processing speed and high precision prediction results. Neural networks have replaced manual computing (Chen et al. Citation2019). Computers are much more capable of processing data than humans. The processing speed is fast, the precision is high, the working efficiency is greatly improved. Advances in algorithms themselves have made computers smarter at simple operational tasks (Chen et al. Citation2019). Through machine learning algorithm, let it pick out the optimal data, unify and standardize the data, establish agricultural price prediction model, forecast. Neural networks need to process a lot of data, and the results are often more accurate (Costa and Dolog Citation2019).
RBF Neural Network Model
The Radial Basis Function (RBF) neural network model is a type of artificial neural network that has been used for a variety of applications, including time-series forecasting and price prediction (Wenquan and Hui Citation2023). It is a feedforward network with a layered architecture, consisting of an input layer, a hidden layer, and an output layer.
The RBF neural network model uses a radial basis function as its activation function in the hidden layer. The radial basis function calculates the distance between the input vector and a set of predefined centers, which are usually determined through clustering algorithms. The output of the hidden layer is then transformed by a set of weights and biases before being fed into the output layer, which produces the predicted output.
In the context of price prediction, the RBF neural network model can be trained on historical data to learn the underlying patterns and trends in the data, which can then be used to make predictions about future prices. The model is trained using a backpropagation algorithm, which adjusts the weights and biases in the network to minimize the difference between the predicted and actual outputs.
To train the RBF neural network model for price prediction, historical data on various market factors that influence the price of the commodity in question are collected, including supply and demand, production costs, macroeconomic indicators, and other relevant variables. The data is then preprocessed and normalized to ensure that all variables are on a similar scale.
Next, the data is split into training and testing sets. The training set is used to train the RBF neural network model using the backpropagation algorithm, while the testing set is used to evaluate the model’s performance and to make predictions about future prices.
During training, the RBF neural network model learns the relationship between the input variables and the target output variable (i.e., the commodity price). Once trained, the model can be used to make predictions about future prices based on new input data.
RBF has only three layers, the relationship between input and output is nonlinear mapping, and the transformation from hidden layer to output layer is linear. The number of hidden layer neurons is adjusted adaptively in the training process according to the training goal, until the training stops when the daily standard error is reached.
The commonly used activation function of RBF neural network is Gaussian function, so as to realize nonlinear mapping of input to hidden layer, in the form of
Where, x is the n-dimensional input of the network; Is the center of the KTH radial basis function; Is the variance of the Gaussian function,
also known as the expansion constant; H is the number of
hidden layer neurons;
Represents the Euclidean distance between x and. The output layer adopts a linear activation function to realize a linear mapping from the hidden layer to the output, in the form of:
Where, is the connection weight between the neuron of the ith hidden layer and the output layer of the KTH.
Therefore, the training process of RBF neural network is the process of solving the network
center and weight. When the two parameters are determined, the corresponding output can be obtained by giving an input to the network. Therefore, the training of RBF neural network is divided into two stages. In the first stage, the radial basis function center is calculated based on k-means clustering method,
and then the extended constant is calculated
Where, is the maximum distance between the selected centers.
After the center and expansion constants are obtained, the second stage is entered, mainly through the least square method to calculate the neuron connection weight between the hidden layer and the output layer, and the formula is
After the above calculation process, the corresponding output value under the input can be obtained. The network constantly adjusts the center and connection weight by comparing the output error, and adjusts the network internal coefficient accordingly. The process is repeated until the error reaches the set error requirement or the set maximum number of hidden layer neurons to complete the network training.
Empirical Analysis
Research Methods
Statistical Analysis
According to the development status of agricultural products and the theory of price formation, this paper discusses the reasons affecting the price of agricultural products, and probes into them from three different angles: nature, market and society. Secondly, through the analysis of the cost of agricultural product market environment and the change of breeding labor price, further analysis of the reasons for the price fluctuation of agricultural products.
Literature Exploration Method
I have studied the technical theories in relevant literature, summarized and analyzed the current development trend of agricultural products industry, summarized and sorted out the current research methods of price prediction, and mastered the research theory and construction method of neural network model. Lay a theoretical foundation for the final research results of this paper.
Quantitative Analysis
The price index prediction model of pork price and garlic price was established by using RBF neural network method, and the results were analyzed.
Data Sources
Among the data selected for this article, the consumer Price Index (CPI) is compiled according to the data of the National Bureau of Statistics. Ginger price (Z) by the Chinese ginger network data collation. Garlic export elasticity (E) is obtained from the data of international garlic trade network. International garlic Prices (IG) compiled from the United Nations Commodity Trade Statistics Database. Garlic (G) and green onion (A) are based on data from China’s Ministry of Agriculture. Pork import volume (M), pork export volume (X), garlic import volume (GM), garlic export volume (GX) are obtained from the data of the General Administration of Customs. Pork price index (P), chicken price index (CP), feed cost (FC), corn price (C), soybean meal price (B), us dollar and RMB direct exchange rate (ER) are from The Carter Center Laboratory of China Academy of Rural Development.
Selection of Influencing Factors
Because there are too many influencing factors of agricultural product price index, and the interembedding between factors is very serious, it will lead to the neural network model analysis, which has too much input, long prediction process and low prediction accuracy. Therefore, after determining the selection of surrogate price influencing factors, first of all, data preprocessing is used to extract features from the data of influencing factors to eliminate the correlation of original data, and the main element extracted from principal component analysis is used as the model input to establish the price model prediction model of RBF.
In this section, six direct impact parameters, monthly pork exports (X), monthly pork imports (M), monthly chicken price (CP), monthly soybean price (B), monthly corn price (C), and feed cost (VF), and two macroeconomic impact parameters, monthly consumption index (CPI) and monthly exchange rate between the U.S. dollar and the Chinese yuan (ER), for a total of eight impact factors, are selected to analyze their impact on pork price (P) in real terms. Principal Component Analysis (PCA) is performed on the eight selected influencing factors to reduce the dimensionality of the factors without losing the information contained in the original influencing factors.
The correlation coefficients between the influencing factors after the standardization process were calculated, and the results are shown in .
Table 1. Correlation coefficient matrix of price influencing factors.
The correlation coefficients between the influencing factors are formed into an 8 × 8 matrix, which is denoted as M. The eigenvalues of the matrix M and the eigenvectors corresponding to the eigenvalues are calculated and arranged in the order of 0. Then the variance contribution of each eigenvalue is calculated according to the formula
Where, is the variance contribution rate of the kth
principal component; is the kth eigenvalue.
The corresponding eigenvalues, variance contribution rate and their cumulative variance contribution rates of each principal component are calculated as shown in .
Table 2. Variance decomposition principal component extraction table.
Usually, the variance contribution rate refers to the information weight of that principal component to all influencing factors. From , it can be seen that the cumulative variance contribution of the first 6 principal components extracted reaches 97.2738%. That is, the first 6 principal components can express 97.2738% of the information of the 8 influencing factors, so the first 6 principal components (1 ~ 6) are extracted for analysis in this paper, and their score coefficient matrix is shown in .
Table 3. Principal component score coefficient matrix.
Pork Price Prediction Model Design and Research
For RBF neural network modeling, there are two functions available in MATLAB: Newrb and Newrbe. The Newrbe function generates an accurate network model with zero error, but at the same time, its network is too large, making the model less practical. Therefore, in this paper, we choose the more widely used Newrb function to design the RBF neural network, whose call format is
where, net is the trained RBF neural network; P and T are the input and output vectors of the network; GOAL is the expected error, and MSE is usually used as the evaluation index; SPREAD is the distribution density; MN is the maximum number of neurons in the network; DF is the number of neurons added each time. When the training error reaches the set target value, the training is stopped and the network is saved, otherwise the number of neurons in the hidden layer is increased until the error day mark is reached or the number of neurons reaches the maximum set value.
The optimal SPREAD value needs to be determined before creating the RBF neural network. In this paper, the best Spread value is selected by taking the pork price forecasting model as an example, firstly, we set the range of values from 0.5 to 3, and the step size is 0.5, and calculate the MSE of the validation sample under 6 Spread values, and select the best Spread value in the range of 0.5 to 3. Then, the MSE of the validation sample was calculated with the best Spread value of 0.6 in the range of 0.5 to 1.5 with a step size of 0.1. Therefore, when building the RBF neural network price prediction model for pork price prediction, the Spread value is 0.6.
Analysis of Pork Price Prediction Results
The trained RBF neural network model is saved and can be used for forecasting, and it is used as the input of the trained model, and the sim function is called to simulate the trained network model for forecasting. Input 6 principal components of the factors affecting pork price index from June 2018 to November 2018 after principal component analysis, a total of 36 data samples, according to the trained network, predict the price index of pork from June 2021 to November 2021, the predicted and true values are shown in .
Table 4. Predicted and true values of pork prices from 2021.06 to 2021.11.
Garlic Price Forecasting Model Design and Study
Similar to section 4.4, the best Spread value of garlic price forecasting model was tested out to be 0.08, where the number of nodes in the input layer was 6, i.e., 6 inputs after principal component analysis, and the number of nodes in the output layer was 1, i.e., garlic price index.
Analysis of Garlic Price Prediction Results
The trained RBF neural network model is saved and can be used for prediction, and it is used as the input of the trained model, and the sim function is called to simulate the trained network model for prediction. The six principal components of the factors affecting the garlic price index were input after principal component analysis, and a total of 60 data samples were used to predict the price index of garlic from January 2020 to October 2020 based on the trained network, and the predicted and true values are shown in .
Table 5. Predicted and true values of garlic prices from 2021.01 to 2021.10.
As seen in , the RBF neural network model has a large prediction error from January to March and a small error in the rest of the months, and the overall price change trend prediction is accurate.
Summary and Outlook
Summary
For a long time, agricultural market price forecasting has been a challenging topic. Due to the special characteristics of agricultural products such as long production process and complex sales and transportation process, price forecasting of agricultural products can only be achieved to predict its long-term fluctuation direction. Especially for fresh agricultural products, this kind of special transportation environment as the object of study has increased the difficulty of predicting the market price of agricultural products. As one of the world’s largest agricultural countries, changes in agricultural prices have a large impact on people’s lives and production nationwide. Thus, the accurate prediction of the price of agricultural products largely affects the happiness index of our people, and the reasonable formulation of the price of agricultural products is a necessary factor to guarantee the income of farmers as well as the stability of people’s life. For the problem of agricultural products price prediction, this paper mainly accomplishes the following work.
Firstly, the current situation of China’s agricultural products market is analyzed, and the fluctuation of its price index has a great impact on the market and the general people. The importance of analyzing and forecasting the prices of agricultural products is illustrated.
Then we refer to study the research experience and methods of domestic and foreign scholars, and integrate our own ideas into the research, and make preparations for establishing innovative forecasting models. Three forecasting models BP neural network forecasting, NARX neural network forecasting and RBF neural network forecasting models were used to forecast the agricultural price index, compare the real value with the forecast value, and conduct error analysis.
Eight main factors (monthly values) affecting the pork price index were selected through research collection, namely, the monthly value of pork export volume (X), the monthly value of pork import volume (M), the monthly value of corn price (C), the exchange rate of the US dollar against the RMB (refers to ER), the monthly value of chicken price (CP), the monthly value of production index (PPI), and the monthly value of consumption index (CPI). And the data under each influencing factor are pre-processed and analyzed by principal component analysis separately to get new input principal components, reduce data dimensionality to reduce noise and improve model accuracy.
The RBF neural network forecasting models were constructed, and after training them separately, the 6-month pork price index forecasts were performed. The errors were calculated based on the experimental results.
Construct RBF neural network for garlic price prediction model, train them separately and perform garlic price index prediction for 10 months. The error is calculated based on the experimental results.
Finally, the experimental results are compared and analyzed to draw conclusions.
The experimental conclusions obtained in this paper are as follows: the main influencing factors for the fluctuation of pork prices occurring in China in recent years are import factors and substitution factors. China is a large consumer and importer of pork, and changes in the price and quantity of imports have a direct impact on the price of pork in China. As for the prices of agricultural products such as chicken and beef, which are substitutable for pork, their fluctuations and pork price fluctuations are mutual. If the price of pork fluctuates more and the price of chicken fluctuates less, it will lead to a subsequent decrease in the price of pork. Pork and garlic prices have a tendency to rise in the short term. According to the experimental study, China’s pork and garlic prices will see a small wave of increase in the short term. The improved RBF neural network model works well for the price prediction of pork and garlic with high prediction accuracy. The advantage is that the model can eliminate the need for manual statistics of complex data.
Shortcomings
Due to the time constraint and the limited research content and depth of the paper, the paper has some shortcomings despite the results achieved.
First, the experimental data in this paper are not rich enough, and the influence indicators are not considered comprehensively. Since some of the influencing factors are macro data, it is difficult to collect daily or weekly indices, and only monthly indices can be selected, resulting in a large data span and less detailed data. In addition, only eight more representative impact factors are selected in the paper, which may lead to errors in the experimental results due to the neglect of other indicators.
Second, the research on the model is not deep enough, and the applied algorithm is relatively simple. The algorithm optimization will be deepened in the later stage to improve the accuracy of the prediction results.
Finally, due to the interdisciplinary research field of the authors of this paper, the contact with computers and their programming and other technologies is late, and the foundation is relatively weak, so they failed to make deep adjustments to the neural network model. The experimental results of can only be simulated based on the Simulink function in MATLAB software. It is not possible to design a service system for data prediction independently, and it would be more convenient and clear if a data prediction program could be designed.
Some potential limitations of the study are:
Limited data sources and time periods: The study may have used a limited number of data sources and time periods, which could limit the generalizability of the findings.
Data quality: The study may have relied on data that is incomplete, inaccurate, or unreliable, which could affect the accuracy of the analysis.
Variable selection: The study may have focused on a limited number of variables or may not have included all relevant variables, which could limit the scope of the analysis.
Model limitations: The study may have used a specific type of forecasting model, such as the RBF neural network, which may have limitations in terms of accuracy and applicability.
Lack of consideration for broader contextual factors: The study may not have considered the social, cultural, historical, and environmental factors that shape the production and consumption of agricultural products in China, which could limit the applicability of the findings.
Bias: The study may have been influenced by the authors’ personal biases or interests, which could affect the interpretation of the results.
Generalizability: The study may not be generalizable to other contexts, such as different regions or countries, due to differences in cultural, economic, and political factors.
Disclosure Statement
No potential conflict of interest was reported by the author.
Data Availability Statement
The labeled dataset used to support the findings of this study are available from the corresponding author upon request.
Additional information
Funding
References
- Barkan, O., and N. Koenigstein. 2016. Item2vec: Neural item embedding for collaborative filtering. 2016 IEEE 26th International Workshop on Machine Learning for Signal Processing (MLSP), Israel.
- Castro Campos, B. 2020. Are there asymmetric relations between real interest rates and agricultural commodity prices? Testing for threshold effects of US real interest rates and adjusted wheat, corn, and soybean prices. Empirical Economics 59 (1):371–1329. doi:10.1007/s00181-019-01636-1.
- Chen, W., F. Cai, H. Chen, and M. De Rijke. 2019. Joint neural collaborative filtering for recommender systems. ACM Transactions on Information Systems 37 (4):1–30. doi:10.1145/3343117.
- Cheng, H.T., L. Koc, J. Harmsen, T. Shaked, T. Chandra, H. Aradhye, G. Anderson, G. Corrado, W. Chai, and M. Ispir. 2016. Wide & deep learning for recommender systems. Proceedings of the 1st workshop on deep learning for recommender systems. Boston, MA, USA.
- Chen, J., W. Jun, H. Liang, S. Mumtaz, L. Jianhua, K. Konstantin, A. Kashif Bashir, and R. Nawaz. 2019. Collaborative trust blockchain based unbiased control transfer mechanism for industrial automation. IEEE Transactions on Industry Applications 56 (4):4478–88.
- Chiu, M.C., J.H. Huang, S. Gupta, and G. Akman. 2021. Developing a personalized recommendation system in a smart product service system based on unsupervised learning model. Computers in Industry 128:103421. doi:10.1016/j.compind.2021.103421.
- Costa, F. S. D., and P. Dolog. 2019. Collective embedding for neural context-aware recommender systems. Proceedings of the 13th ACM conference on recommender systems. Copenhagen, Denmark.
- Das, D., L. Sahoo, and S. Datta. 2017. A survey on recommendation system. International Journal of Computer Applications 160 (7):6–10. doi:10.5120/ijca2017913081.
- Da’u, A., and N. Salim. 2020. Recommendation system based on deep learning methods: A systematic review and new directions. Artificial Intelligence Review 53 (4):2709–48. doi:10.1007/s10462-019-09744-1.
- Dhelim, S., H. Ning, N. Aung, R. Huang, and M. Jianhua. 2020. Personality-aware product recommendation system based on user interests mining and metapath discovery. IEEE Transactions on Computational Social Systems 8 (1):86–98. doi:10.1109/TCSS.2020.3037040.
- Dong, X., Y. Lei, W. Zhonghuo, Y. Sun, L. Yuan, and F. Zhang. 2017. A hybrid collaborative filtering model with deep structure for recommender systems. Proceedings of the AAAI Conference on artificial intelligence. San francisco USA.
- Iqbal, M., K. Aryafar, and T. Anderton. 2019. Style conditioned recommendations. Proceedings of the 13th ACM Conference on Recommender Systems. Copenhagen, Denmark.
- Jia, H., S. Shen, J. Alberto Ramírez García, and C. Shi. 2022. Partner with a third-party delivery service or not? A prediction-and-decision tool for restaurants facing takeout demand surges during a pandemic. Service Science 14 (2):139–55. doi:10.1287/serv.2021.0294.
- Jinhao, S. H. E. N. 2020. Ethnographic study on traffic violations of takeout delivery clerks. Journal of Chongqing Jiaotong University Social Sciences Edition 20 (2):29.
- Kumar, P., and R. Singh Thakur. 2018. Recommendation system techniques and related issues: A survey. International Journal of Information Technology 10 (4):495–501. doi:10.1007/s41870-018-0138-8.
- Liu, H., J. Wen, L. Jing, and Y. Jian. 2019. Deep generative ranking for personalized recommendation. Proceedings of the 13th ACM Conference on Recommender Systems. Copenhagen, Denmark.
- Mingsheng, F., Q. Hong, Y. Zhang, L. Lu, and Y. Liu. 2018. A novel deep learning-based collaborative filtering model for recommendation system. IEEE Transactions on Cybernetics 49 (3):1084–96. doi:10.1109/TCYB.2018.2795041.
- Raja, G., S. Anbalagan, G. Vijayaraghavan, P. Dhanasekaran, Y. D. Al-Otaibi, and A. Kashif Bashir. 2020. Energy-efficient end-to-end security for software-defined vehicular networks. IEEE Transactions on Industrial Informatics 17 (8):5730–37. doi:10.1109/TII.2020.3012166.
- Ran, L., and L. Zhongwu. 2020. An empirical study on takeout app customers’ continuous use intention in China. AJMI-ASEAN Journal of Management and Innovation 7 (1):90–107.
- Rosa, R. L., G. Maria Schwartz, W. Vicente Ruggiero, and D. Zegarra Rodríguez. 2018. A knowledge-based recommendation system that includes sentiment analysis and deep learning. IEEE Transactions on Industrial Informatics 15 (4):2124–35. doi:10.1109/TII.2018.2867174.
- Sharma, S., V. Rana, and V. Kumar. 2021. Deep learning based semantic personalized recommendation system. International Journal of Information Management Data Insights 1 (2):100028. doi:10.1016/j.jjimei.2021.100028.
- Sheikh, A.S., R. Guigourès, E. Koriagin, H. Yuen King, R. Shirvany, R. Vollgraf, and U. Bergmann. 2019. A deep learning system for predicting size and fit in fashion e-commerce. Proceedings of the 13th ACM conference on recommender systems. Copenhagen, Denmark.
- Tang, J., and K. Wang. 2018. Personalized top-n sequential recommendation via convolutional sequence embedding. Proceedings of the eleventh ACM international conference on web search and data mining. CA, Marina Del Rey, USA.
- Wan, M., D. Wang, J. Liu, P. Bennett, and J. McAuley. 2018. Representing and recommending shopping baskets with complementarity, compatibility and loyalty. Proceedings of the 27th ACM International Conference on Information and Knowledge Management. Torino, Italy.
- Wenquan, X., and H. Hui. 2023. A novel FRBF-Type model for nonlinear time series prediction. Mathematical Problems in Engineering 2023:1–14. doi:10.1155/2023/5753023.
- Xiaojun, L. 2017. An improved clustering-based collaborative filtering recommendation algorithm. Cluster Computing 20 (2):1281–88. doi:10.1007/s10586-017-0807-6.
- Yang, W. 2020. Ux design of a mobile food app for pregnant women mixed-methods approach. IOP Conference Series. Xi'an, China: Materials Science and Engineering.
- Yaseen, S., S. M. Ali Abbas, A. Anjum, T. Saba, A. Khan, S. Ur Rehman Malik, N. Ahmad, B. Shahzad, and A. Kashif Bashir. 2018. Improved generalization for secure data publishing. Institute of Electrical and Electronics EngineersAccess 6:27156–65. doi:10.1109/ACCESS.2018.2828398.
- Yeong Hyeon, G., D. Jin, H. Yin, R. Zheng, X. Piao, and S. Joon Yoo. 2022. Forecasting agricultural commodity prices using dual input attention LSTM. Agriculture 12 (2):256. doi:10.3390/agriculture12020256.
- Zheng, L., V. Noroozi, and P. S. Yu. 2017. Joint deep modeling of users and items using reviews for recommendation. Proceedings of the tenth ACM international conference on web search and data mining. Cambridge, United Kingdom.