
 ?Mathematical formulae have been encoded as MathML and are displayed in this HTML version using MathJax in order to improve their display. Uncheck the box to turn MathJax off. This feature requires Javascript. Click on a formula to zoom.
ABSTRACT
To enhance the efficacy of intermittent hypoxia training in sports, this study presents an intelligent training model that utilizes a graph neural network. The model incorporates the particle filter method to establish a real-time processing system for physiological signals generated during intermittent hypoxia training, enabling frequency tracking and network sorting. Additionally, an ARMA model is utilized to facilitate real-time carrier frequency estimation and time-hopping detection of physiological signals. An enhanced frequency tracking method is proposed based on the Graph Neural Network (GNN) and ARMA model to improve the accuracy of frequency tracking while minimizing algorithm complexity. The experimental results indicate that the fusion of the GNN and the proposed intermittent hypoxia training model can effectively enhance the effects of intermittent hypoxia training in sports.
Introduction
It is well known that severe hypoxia can cause tissue damage to the human body, and athletes endure the stimulation of hypoxia all the time to varying degrees during intense training and competition. On the contrary, appropriate hypoxic stimulation can make the body adapt to hypoxia, improve its tolerance to hypoxia, and protect body tissues from damage. Intermittent normobaric hypoxia training is a new high-altitude imitation training method gradually developed in Russia, the United Kingdom, the United States and other countries in the past ten years (Osipov et al. Citation2019). It mainly uses hypoxic breathing gas generator to make athletes inhale gas lower than normal oxygen partial pressure to cause moderate hypoxia in the body, which leads to a series of anti-hypoxic physiological adaptations that are conducive to improving aerobic metabolism to achieve the purpose of altitude training. The characteristic of this training method is that under the condition of plain training, the corresponding environment of hypoxic stimulation in plateau training is artificially created (it can simulate hypoxic environment at a height of 1000–6000 meters). It does not require a specific plateau training base, but also eliminates the round-trip migration from plain to plateau to plain, which not only saves costs and time, but also maximizes the development of athletes’ functional potential (Henriques-Neto et al.). Its advantages are: convenient, time-saving, economical, safe and effective. In addition, intermittent hypoxia training, as an auxiliary training method, is interspersed with regular training, which can comprehensively improve the body’s metabolic capacity. After training, athletes rest in a normal air pressure environment, which is also conducive to recovery after training (Kravchuk et al. Citation2020).
As a stress, hypoxia has a certain degree of influence on various systems of the human body. The endocrine system, as one of the two most important regulatory systems in the body, plays an important regulatory function together with the nervous system in the process of resisting stress. Therefore, the change law of endocrine system indicators in hypoxic environment has become the focus of research. Testosterone and cortisol are two very important hormones in the endocrine system, and have a certain relationship with athletes’ athletic ability and post-exercise recovery, so they are often used to assess athletes’ functional status (McCord et al. Citation2020). Research on high altitude hypoxia has been carried out earlier, and related research has also been carried out on the effect of high altitude hypoxia on testosterone and cortisol, but the effect of intermittent hypoxia on it is still less studied. Regarding the physiological mechanism of testosterone changes caused by high altitude hypoxia, most scholars believe that the decrease in serum testosterone caused by high altitude hypoxia exercise is not central (Politko Citation2018). Testosterone is an aerobic metabolism when it is synthesized in the mitochondria of Leydig cells. Insufficient oxygen supply in hypoxic environment will inevitably affect the synthesis of testosterone. From this point of view, altitude training is more likely to cause a decrease in testosterone. Under the condition of intermittent hypoxic stimulation, there are few researches on the changes of endocrine system indicators such as testosterone and the reasons for such changes (Chang Citation2021).
Intermittent Hypoxic Training (IHT) is to let athletes intermittently inhale gas lower than the normal partial pressure of oxygen with the help of a hypoxic instrument on the plain, causing moderate hypoxia in the body, resulting in a series of benefits that are beneficial to improve aerobic Anti-hypoxia physiological and biochemical adaptation of metabolic capacity to achieve the purpose of high altitude training (Silva and Clemente Citation2017). In sports practice, intermittent hypoxia training, as an auxiliary training method, interspersed with routine training, can maximize the development of athletes’ functional potential, and has a positive effect on the overall improvement of the body’s metabolic capacity and extreme functional ability (Ariani Citation2021). Or used for routine sports training, to promote the recovery of athletes’ fatigue, and sometimes as an adaptive training in the early stage of altitude training. therefore. Intermittent hypoxia training has been widely used in sports practice in Russia, the United States, Japan, Canada, France, Germany, the United Kingdom, Spain, Australia, Brazil, Finland, Poland and other countries. Intermittent hypoxia training has achieved certain results in sports practice, and has been generally recognized by experts in disciplines such as training science and sports bioscience. More and more countries have invested a lot of money to apply intermittent hypoxia training to different levels.
Professional athletes in different sports (Z. L. Kozina et al. Citation2017). Sports events mostly focus on endurance events such as running, skiing, and cycling. In recent years, this method has also been applied in mountaineering training, pilots and astronauts’ hypoxia tolerance training. Research data show that intermittent hypoxic training can effectively improve exercise level and athletic performance (Titova et al. Citation2018). Intermittent hypoxia training method is one of the methods of simulating altitude training, and its application is the enrichment and development of altitude training methods. Altitude training has attracted attention from all walks of life with its unique training method and remarkable training effect. Many athletes also make altitude training an integral part of their training program. Nowadays, the intermittent hypoxia training method has been widely used all over the world, and has achieved good practical results (Chernykh, Mulik, and Okun Citation2019).
Physical fitness enhancement during exercise training is the body’s adaptive response to sustained exercise load. Tissue hypoxia induced by heavy exercise, as a basic stimulus, can induce and guide the adaptive exchange of tissues. The greater the load intensity, the greater its adaptive effect, but excessive load will cause cell damage, resulting in decreased immune function, prone to excessive fatigue and sports injuries. High altitude training takes advantage of the special environment of high altitude hypoxia. In addition to the exercise training load, hypoxic hypoxia load is imposed, thereby increasing the physiological function burden of the athlete’s respiratory and circulatory systems, that is, increasing the body’s load intensity. Therefore, it has a good effect on improving and improving heart and lung function and improving exercise ability (Kostiantyn et al. Citation2017). However, the limitation of plateau geographical conditions and the many problems caused by it have become obstacles to plateau training. Intermittent hypoxia training is under the condition of plains, with the help of special equipment, athletes are allowed to enter the mixed gas of low oxygen partial pressure, so as to accept the hypoxic hypoxia load similar to the plateau. Use it as a training tool interspersed with regular training. The mode of exercise training in the plateau hypoxic environment was changed to the mode of plain training plus a simulated plateau hypoxia load (Sarafyniuk et al. Citation2019).
Athletes in high altitude training need to receive two aspects of hypoxic stimulation, one is the hypoxic stimulation caused by exercise load (Artiuh et al. Citation2019); Studies have shown that changes in oxygen partial pressure at an altitude of 1760 m begin to affect the human body. In order to achieve greater stress, fully obtain adaptive responses, and make the changes in red blood cells and hemoglobin more significant, athletes should train in areas above 1760 m above sea level. However, the higher the altitude, the lower the training load (Strykalenko et al. Citation2019).
When receiving exercise load, the sensory nerves (muscles, tendons) send out impulses, which are regulated by the cerebral cortex, resulting in the formation of compensatory ability, which is mainly manifested as increased blood supply to skeletal muscles (Fachrezzy et al. Citation2021). The enhancement of respiration and blood circulation caused by this compensatory effect is much higher than the increase of pulmonary ventilation and circulating blood volume through chemoreceptors (Kons, Franchini, and Detanico Citation2018). If the hypoxic stimulation formed by the low oxygen partial pressure increases the minute ventilation by 2–3 times and the circulating blood volume by 1.5 times, then the minute ventilation can be increased by 20 times and the circulating blood volume by 7–10 times (Kozina et al. Citation2019).
It can be seen that the compensatory response of hypoxic load caused by low oxygen partial pressure is largely displayed in hematopoietic organs, heart and brain tissue. And the hypoxia induced by the exercise training load makes the adaptive larvae especially in the muscle tissue. This shows that the exercise training load is the main contradiction in enabling athletes to obtain neural and muscle adaptations. High altitude training creates objective conditions for the formation of hypoxic adaptability due to the hypoxic hypoxic load unique to high altitude, but the accompanying side effect is that the load and intensity of exercise training are reduced, which makes the plain training center. The acquired nerves and muscles are less adaptable and risk losing the best competitive state. Intermittent hypoxia training is a combination of regular exercise training under plain conditions and hypoxic hypoxia load training, that is, hypoxic hypoxia load training and regular training aimed at improving motor skills are alternated, usually arranged in After the exercise load is over. In this way, because the two loads are performed asynchronously, the contradiction of mutual restriction is avoided, the corresponding exercise training load is guaranteed, and the sports performance is improved (Zalyapin et al. Citation2019).
This paper makes several key advances in the field of intermittent hypoxia training in sports. Firstly, it proposes an intelligent training model based on a graph neural network, which can enhance the efficacy of intermittent hypoxia training. Secondly, the model incorporates the particle filter method, enabling real-time processing of physiological signals generated during training, which facilitates frequency tracking and network sorting. Thirdly, the model utilizes the ARMA model for real-time carrier frequency estimation and time-hopping detection of physiological signals. Fourthly, the paper proposes an improved frequency tracking method based on the ARMA model, which balances the tradeoff between tracking accuracy and algorithm complexity. Finally, the experimental results demonstrate that the proposed model can effectively enhance the effects of intermittent hypoxia training in sports.
This paper is organized into three main sections, namely, Real-time Processing of Physiological Signals of Intermittent Hypoxia Training Based on ARMA, Simulation Analysis, and Conclusion.
The second section, Real-time Processing of Physiological Signals of Intermittent Hypoxia Training Based on ARMA, discusses the development of a real-time processing system for physiological signals generated during intermittent hypoxia training, incorporating the ARMA model. This section describes the particle filter method used in the model for frequency tracking and network sorting of physiological signals.
The third section, Simulation Analysis, presents the experimental setup and results of the proposed intermittent hypoxia training model, incorporating the graph neural network and the ARMA model. The section presents the experimental results and a detailed analysis of the performance of the proposed model, along with a comparison with existing models.
The final section, Conclusion, provides a summary of the key contributions of the paper, discusses the limitations of the study, and suggests directions for future research. The conclusion emphasizes the significance of the proposed model for enhancing the efficacy of intermittent hypoxia training in sports and highlights the potential for further research in this area.
Real-Time Processing of Physiological Signals of Intermittent Hypoxia Training Based on ARMA
In order to construct a real-time processing system of physiological signals for intermittent hypoxia training, and to realize frequency tracking and network sorting, the particle filter method was introduced into the model. First, the frequency is estimated by the adaptive update of the particles. Then, the source signal waveform is recovered to estimate the carrier frequency of the signal, and the time-domain ARMA model is established by using the estimated value of the carrier frequency, and the hopping moment is detected in real time by using the model. In this paper, a sparse Bayesian learning-based method for frequency tracking of physiological signals in multi-intermittent hypoxia training is proposed, and a Bayesian sparse representation model is established to estimate the frequency in the frequency dwell time and detect the hopping time, so as to realize the frequency tracking. The real-time processing algorithm based on particle filtering and sparse Bayesian learning can effectively improve the accuracy of frequency tracking and time-hopping detection of physiological signals in intermittent hypoxia training, and complete signal DOA estimation, but the algorithm is too complicated and the amount of calculation is too large.
In view of the above problems, considering the frequency tracking accuracy and algorithm complexity, an improved frequency tracking method based on ARMA model is proposed in this paper.
Mathematical Model
If it is assumed that N source signals are received by an M-element uniform linear array, the antenna spacing is d, and the receiver sampling periods are , and
, the mixed signal data received at time t is:
If K sampling point signals are received in the frequency dwell time period, the received signal can be expressed as:
Frequency Tracking Algorithm Based on ARMA
It can be seen that the N + 1 order ARMA model can be expressed as:
The following formula is the conjugate form of the ARMA model:
Among them, is the coefficient of the following equation of order N whose root is
:
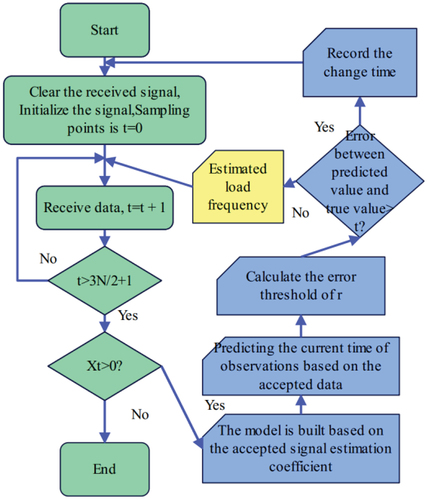
The above time-domain ARMA model is associated with N + 1 consecutive observation samples during the frequency dwell time. Once the frequency hopping occurs, the samples at the time before and after the time hopping will deviate from the constructed model. Therefore, hoppinging moments can be successfully detected by evaluating the prediction error with the model at each moment. shows the principle flow chart of real-time carrier frequency estimation and time-hopping detection of physiological signals in intermittent hypoxia training using the ARMA model.
Figure 1. Flow chart of frequency tracking of physiological signals in intermittent hypoxia training based on ARMA.
In order to use this method to solve the problem of frequency tracking of physiological signals in intermittent hypoxia training, the ARMA model is first established, so the coefficients of the model are calculated first. At time , the coefficients of the model can be obtained from the observed data by the following formula:
Among them,
Among them, the reason to satisfy the current moment is to make the matrix
full rank, that is,
can be obtained.
Using the ARMA model and the received data, the signal prediction at the current time is:
When frequency hopping occurs, the prediction error will increase greatly. According to the size of the prediction error, time hopping detection can be realized. The standard of hypothesis test is:
The value of is determined by the noise variance and the model coefficients, but the noise variance is unknown. Therefore, in practical applications,
is estimated using the received signal observations. If the starting time of the frequency dwell time is assumed to be t = 1, then
can be estimated by the following equation:
If no frequency hopping occurs, the estimated model coefficient is brought into Equationequation (5)
(5)
(5) to get:
By taking into the above formula, the estimated carrier frequency is obtained as:
The ARMA model is used to predict the signal at the current time based on the received data. EquationEquation (11)(11)
(11) shows the predicted signal at time
based on the N previous observations of the signal. However, when frequency hopping occurs, the prediction error increases significantly. Therefore, to detect the occurrence of frequency hopping, the prediction error is compared with a threshold value γ using the hypothesis test shown in Equationequation (12)
(12)
(12) .
The value of γ is determined by the noise variance and the model coefficients, but the noise variance is usually unknown in practical applications. Therefore, in Equationequation (13)(13)
(13) , γ is estimated using the received signal observations. If no frequency hopping occurs, the estimated model coefficients are used to determine the carrier frequency of the signal, as shown in Equationequation (14)
(14)
(14) . This formula calculates the estimated carrier frequency by taking the complex exponential of the estimated coefficients and then calculating the angle of the resulting complex number. The estimated carrier frequency is then obtained by dividing this angle by 2π times the sampling period
, as shown in Equationequation (15)
(15)
(15) .
Overall, the ARMA model is used to predict the signal at the current time, and the prediction error is used to detect the occurrence of frequency hopping. If frequency hopping occurs, the estimated carrier frequency cannot be calculated, and additional steps must be taken to detect and track the new frequency.
Improved ARMA Frequency Tracking Algorithm
Due to the small number of samples and the existence of noise, the performance of using FFT alone to solve the frequency is not good, so the data received by multiple array elements is comprehensively used for frequency estimation. The specific methods are as follows:
M array elements are used to receive the mixed signal sample by sample, and it is assumed that each array element has received signal samples and there is
. Moreover, the FFT transformation is performed on the M groups of signal samples respectively, the amplitude-frequency characteristic curve is drawn, and the corresponding frequency at the peak position is recorded. The peak position is selected according to the condition of
to remove the influence of low-amplitude points caused by noise, where A is the amplitude vector obtained after FFT, and i is the position corresponding to the frequency.
We assume that the vector composed of the corresponding frequencies at the peak positions of M groups is F, and use the clustering algorithm to process F. When two frequency values and
satisfy the following formula, it is considered to be a class:
The class is determined according to the number of elements, and the cluster center is obtained by calculating the mean within the class. When the number of clusters is equal to the number of source signals, the clustering ends.
After obtaining the estimated value F of the carrier frequency, is brought into the formula (14) to solve the model coefficients, and the signal prediction and time-hopping detection are carried out according to the formulas (11) and (12).
Since there is no need to estimate the model coefficients according to the received signal, the improved algorithm does not need the restriction of . However,
is generally required to ensure that the frequency obtained by the FFT transformation of the K sampling point signals will not have a large error, and it generally has K > 4.
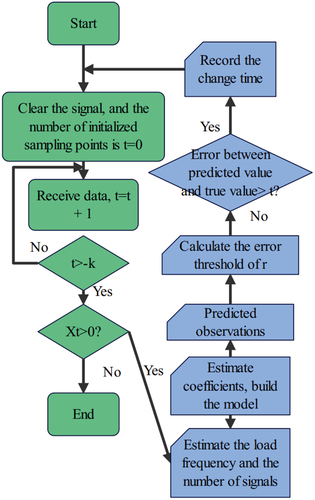
In summary, the improved ARMA model-based intermittent hypoxia training physiological signal frequency tracking flowchart is shown in . The specific implementation steps of the algorithm are as follows:
Figure 2. Flow chart of improved ARMA intermittent hypoxia training physiological signal frequency tracking.
The algorithm initializes the number of samples f = 0;
The channel receives the signal sample by sample, t=t + 1. After receiving K signal samples, that is, when f≥K, the algorithm performs FFT on the signal received by each channel, and records the number of peaks of the amplitude-frequency curve and the frequency at the peak;
The algorithm performs clustering on the number of peaks obtained by the M channels, and obtains an estimate of the number N of source signals, which is used as the order of the model and the number of classes of the clustering;
The algorithm performs central clustering on the frequencies at the peaks obtained by the M channels to obtain an estimate of the carrier frequency;
The algorithm uses formula (14) to solve the ARMA model coefficient c according to the estimated value of the carrier frequency;
The algorithm obtains the signal prediction value
according to formula (11), and calculates the error
The algorithm uses formula (13) to calculate v, and performs time-hopping detection according to formula (12). If the frequency hopping occurs, record the time hopping, and the algorithm returns to step (1), otherwise it returns to step (2) until all signal sample data are processed.
Particle Filter-Based Sorting Algorithm for Network Stations
The in the mixing matrix
is defined as the frequency azimuth product. Through the ARMA model and the particle filter method, the carrier frequency and the frequency azimuth product can be estimated in real time, and the real-time DOA estimation of the network station can be realized.
can be further expressed as:
Therefore, Q N-dimensional frequency orientation product particles can be initialized as:
The particles are updated every time a new set of data is received. First, generate new particles as follows:
Then, the acceptance probability of each particle is calculated as follows:
The normalized weights of the new particles are calculated as:
The frequency bearing product can be estimated using the following equation:
The final DOA estimate is:
Overall, this passage describes a method for estimating the real-time DOA of a network station using physiological signals from intermittent hypoxia training. We introduce a mixing matrix and a parameter , and propose a method for estimating the frequency orientation product using the particle filter method. The final DOA estimate is calculated using the estimated frequency-bearing product and known parameters.
Simulation Analysis
In scientific research, it is crucial to establish the reliability and validity of the data acquired through various methods and techniques. This means the data must be accurate, consistent, and free from biases or errors. Similarly, any proposed action or method must be rigorously tested and evaluated to determine its potential benefits and drawbacks. This ensures that the proposed method is effective and suitable for achieving the intended objectives without causing unintended consequences or negative impacts. To achieve this, the suggested procedures must agree, which means that the methods used for acquiring data and testing the proposed course of action must be consistent and in agreement with each other. This ensures that the data acquired is accurate and reliable and the results obtained from testing the proposed course of action are trustworthy and valid.
The ARMA model is used in this paper for frequency tracking and time-hopping detection of physiological signals during intermittent hypoxia training. The ARMA model is a widely used statistical model that can capture both the autocorrelation and moving average properties of a time series. It has been used in various applications such as financial forecasting, speech recognition, and signal processing.
In the context of hypoxia forecasting in sports training, the ARMA model is particularly suitable because it can accurately estimate the carrier frequency of the physiological signals in real-time. This is important because during hypoxic training, the carrier frequency of the physiological signals may change due to frequency hopping, which can lead to inaccuracies in frequency tracking. The ARMA model-based approach proposed in this paper can help mitigate the effects of frequency hopping and provide accurate estimates of the carrier frequency.
Moreover, the ARMA model is computationally efficient and can be easily implemented in real-time processing systems. This is essential for the practical application of the proposed approach, as real-time processing of physiological signals is necessary to provide timely feedback to athletes during training. Therefore, the use of the ARMA model in this paper is justified due to its ability to accurately estimate the carrier frequency of physiological signals during intermittent hypoxia training and its suitability for real-time processing systems.
The GNN was used in this paper because it is well-suited for modeling complex relationships between different physiological signals during intermittent hypoxia training. GNNs are a type of neural network designed to operate on graphs, which are mathematical structures that can represent relationships between entities or nodes. In the context of hypoxia forecasting in sports training, physiological signals such as oxygen saturation, heart rate, and respiration rate can be considered as nodes in a graph, with edges representing the relationships between them. By using a GNN to model these relationships, the model can capture complex interactions and dependencies between different physiological signals that may not be apparent using traditional machine learning approaches.
Furthermore, GNNs have been shown to be effective in a wide range of applications, including natural language processing, computer vision, and social network analysis. By applying GNNs to the problem of hypoxia forecasting in sports training, the paper extends the use of this powerful machine learning technique to a new domain, which can potentially lead to improved training outcomes for athletes. Overall, the use of GNNs in this paper is a novel approach to modeling the complex relationships between different physiological signals during intermittent hypoxia training, which can help optimize the training regimen and improve the performance of athletes.
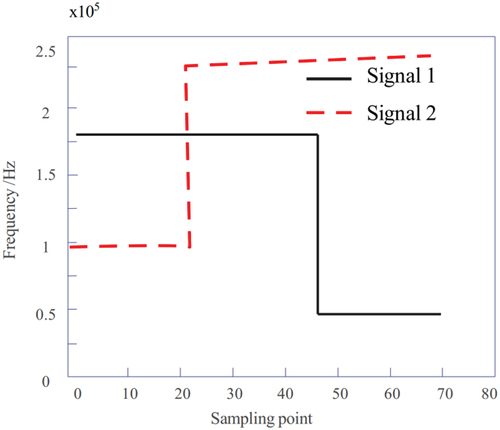
The physiological signal of intermittent hypoxia training adopts asynchronous networking, the number of signals is N = 2, the receiving end is a multi-channel uniform linear array, and the signal arrival angles are and
, respectively. The signal sampling frequency is
. We assume that each signal hoppings in frequency only once during the observation time, and the first signal has frequencies
and
for 48 and 24 samples, respectively. The frequencies of the second signal are
and
, which last for 24 and 48 sampling points, respectively. The frequency variation of the source signal is shown in . The weight factor
has 512 points, and the central clustering threshold
is 1,000,000.
Figure 3. Schematic diagram of frequency variation of source signal.
If the simulation experiment is repeated three times under the same conditions, the number of experiments to correctly detect the time hopping is seven, and the time hopping detection probability is defined as:
If is set, the time hopping detection probability obtained by using the improved algorithm in Section 1.3 changes with the number of channels as shown in .
Figure 4. Time hopping detection probability graph.
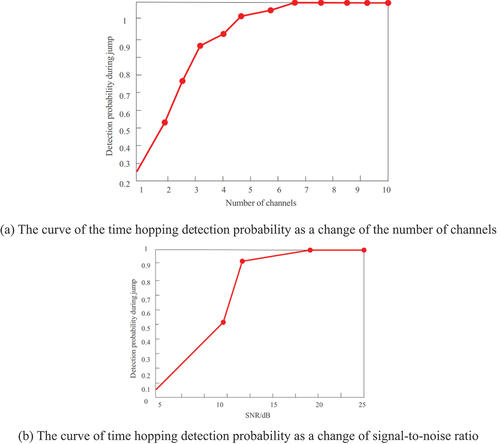
It can be seen from that the time hopping detection probability increases with the increase of the number of channels.
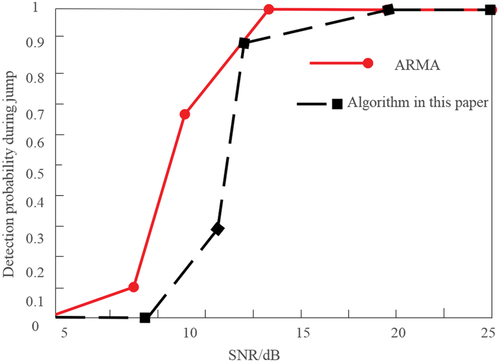
The number of channels M is 10, and the SNR is 5–25 dB. If L = 500, the curve of the time-hopping detection probability of the improved algorithm with the signal-to-noise ratio is shown in .
The following compares the time-hopping detection probability of the improved algorithm and the original ARMA algorithm under low signal-to-noise ratio. Taking the SNR as 5:20, the curve of the detection probability of the two algorithms with the signal-to-noise ratio is shown in . It can be seen that the time-hopping detection probability of the improved algorithm in this chapter is better than the original algorithm.
Figure 5. The curve of the time-hop detection probability as a change of the signal-to-noise ratio.
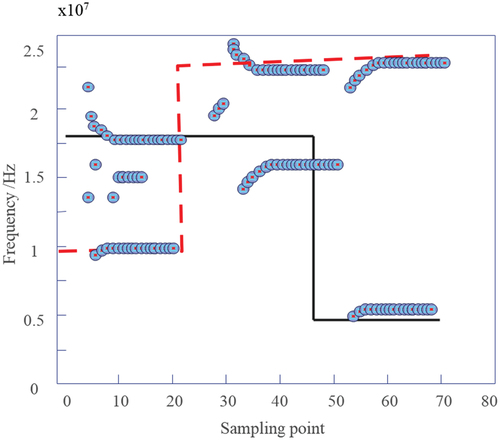
If it is assumed that the number of channels M is 8 and the SNR is 15 dB, the frequency tracking simulation diagram obtained by using the improved algorithm in Section 1.3 is shown in . Since K = 5, no frequency estimation is performed for the 4 sampling points at the initial time, and their values are all set to zero.
Figure 6. Frequency tracking scatter plot.
In order to evaluate the performance of carrier frequency estimation, the relative error of carrier frequency estimation is defined as:
Among them, is the total number of estimated carrier frequency points,
is the actual value of the carrier frequency, and
is the estimated value.
We set M to be 8, and calculate the error value of the carrier frequency estimate corresponding to the -th signal sample. The received signal can be divided into three segments according to the time hopping, and each segment lasts for 24 points. In order to observe the error curve more intuitively, the mean value of the three-segment signal estimation error at each sampling point in the 24 sampling points is calculated, and in order to exclude the influence of frequency hopping on the carrier frequency estimation, the value of
is 23. are the relative error curves of carrier frequency estimation obtained by the improved algorithm and the original ARMA algorithm when the SNR is
and
, respectively. Using SBL, a sparse representation model of physiological signals for intermittent hypoxia training is established. Through the adaptive iterative solution of sparse vectors, the carrier frequency and time hopping of signals can be estimated with high accuracy.
Figure 7. Error curve of carrier frequency estimation.
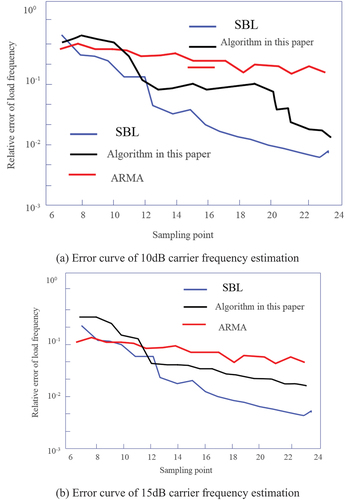
As can be seen from the figure, when the number of received signal samples is small, the error of using the algorithm in this chapter to estimate the signal frequency is larger, and the frequency estimation accuracy of the ARMA and SBL algorithms is better. However, with the increase of the number of received samples, the accuracy of the FFT calculation frequency is greatly improved, and the improved algorithm is gradually better than the ARMA algorithm. When enough samples are received, the frequency estimation accuracy of the improved algorithm is obviously better than that of the ARMA algorithm. Among these three algorithms, SBL has the highest carrier frequency estimation accuracy, but its algorithm complexity is also the largest.
Below we briefly analyze the amount of computation required for each algorithm to estimate the carrier frequency of a sample point. The ARMA algorithm only needs formula (15) and formula (16) to complete the carrier frequency estimation. The algorithm in this chapter needs to perform M times of 512-point FFT and peak amplitude operations, as well as the clustering calculation of N cluster centers.The adaptive iterative solution of the sparse vector. Among them, each iteration needs to update the mean matrix, covariance matrix, noise variance matrix and sparse vector until the target vector satisfies the preset conditions. In order to ensure the sparsity of the signal, P is set to be large in the SBL algorithm, resulting in a large number of matrix dimensions processed in each iterative operation. Moreover, in order to estimate the carrier frequency more accurately, the number of iterations of the sparse vector is also more, so the SBL algorithm has the largest amount of calculation and the longest time-consuming among the three algorithms.
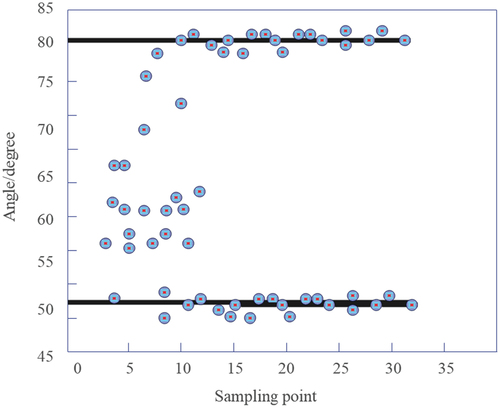
The carrier frequency duration is extended from 24 sampling points to 32 sampling points. Taking the first 32 data received as an example, the real-time DOA estimation algorithm for intermittent hypoxia training physiological signals based on particle filtering is used. When it is 20 dB, the DOA estimation value of the obtained signal is shown in .
Figure 8. Scatter plot of real-time DOA estimation of physiological signals of intermittent hypoxic training.
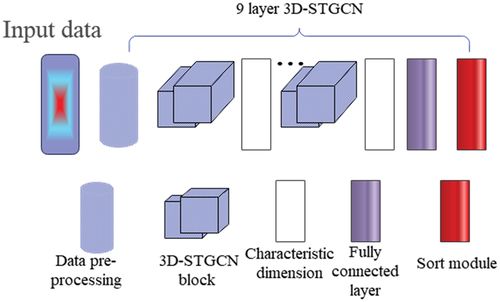
is the structure diagram of the intermittent hypoxia training behavior recognition model based on 3D graph convolution. The input data is the joint point coordinates of the human skeleton sequence. After data preprocessing, it is input into the 3D spatiotemporal graph convolution network for feature extraction. Among them, the hole convolution method adopted by the 3D spatiotemporal graph convolution network has a total of 9 layers, and is finally connected to the SoftMax classifier for action classification.
Figure 9. Structure diagram of behavior recognition model for intermittent hypoxia training based on 3D spatiotemporal graph convolutional network.
The effect of the intermittent hypoxia training model in sports based on the graph neural network is verified, and the test results are obtained as shown in .
Table 1. Validation of the effect of intermittent hypoxia training model in sports based on graph neural network.
From the above research, it can be seen that the intermittent hypoxia training model proposed in this paper can effectively improve the effect of intermittent hypoxia training in sports with the fusion graph neural network.
Conclusion
As a stress, hypoxia has a certain degree of influence on various systems of the human body. As one of the two most important regulatory systems in the body, the endocrine system, together with the nervous system, plays an important regulatory function in the process of resisting stress. Therefore, the change law of endocrine system indicators in hypoxic environment has become the focus of research. Testosterone and cortisol are two very important hormones in the endocrine system, and have a certain relationship with athletes’ exercise ability and post-exercise recovery, so they are often used to evaluate athletes’ functional status. This paper combines the graph neural network to verify the effect of intermittent hypoxia training in sports training to improve the scientificity of sports training. The novelty presented in this paper is due to the particular application of using graph neural network (GNN) and ARMA model-based frequency tracking algorithm to improve the effectiveness of intermittent hypoxia training in sports. This approach is novel because it is specifically tailored to address the hypoxia forecasting problem in sports training, which involves predicting the physiological responses of athletes to intermittent hypoxic training.
The paper proposes an intelligent training model based on GNN, which is designed to capture the complex relationships between different physiological signals, such as oxygen saturation, heart rate, and respiration rate, during intermittent hypoxia training. This allows the model to provide accurate and real-time feedback to athletes during training, which can help optimize their training regimen and improve their performance.
Additionally, the paper introduces the ARMA model-based frequency tracking algorithm to accurately estimate the carrier frequency of the physiological signals during intermittent hypoxia training. This approach helps to mitigate the effects of frequency hopping, which can occur during hypoxic training and can lead to inaccuracies in frequency tracking.
Overall, the novelty presented in this paper is due to the unique application of GNN and ARMA model-based frequency tracking algorithm to address the hypoxia forecasting problem in sports training. By combining these approaches, the paper proposes an intelligent training model that can improve the effectiveness of intermittent hypoxia training in sports and provide athletes with real-time feedback to optimize their training regimen.
The experimental study shows that the intermittent hypoxia training model in sports based on graph neural network proposed in this paper can effectively improve the effect of intermittent hypoxia training.
Disclosure statement
No potential conflict of interest was reported by the authors.
Additional information
Funding
References
- Ariani, L. P. T. 2021. The effect of repetition sprint training method combined with the level of physical fitness toward the speed of 100 meter run. International Journal of Engineering, Science and Information Technology 1 (3):59–1421. doi:10.52088/ijesty.v1i3.89.
- Artiuh, V. V., Z. L. Kozina, V. O. Koval, D. V. Safronov, S. V. Fomin, and Y. O. Novikov. 2019. Influence of application of special means of development of equilibrium and precision-target movements on the level and structure of psychophysiological indicators, physical and technical readiness of archers. Health, Sport, Rehabilitation 4 (4):7–16. doi:10.34142/HSR.2018.04.04.01.
- Chang, G. 2021. RETRACTED ARTICLE: Urban air pollution diffusion status and sports training physical fitness measurement based on the internet of things system. Arabian Journal of Geosciences 14 (16):1–11. doi:10.1007/s12517-021-07947-x.
- Chernykh, T., V. Mulik, and D. Okun. 2019. Study of the level of physical fitness of young acrobat athletes at the initial stage of training. Слобожанський науково-спортивний вісник 7 (5(73)):27–30. doi:10.15391/snsv.2019-5.010.
- Fachrezzy, F., I. Hermawan, U. Maslikah, H. Nugroho, and E. Sudarmanto. 2021. Profile physical fitness athlete of slalom number water ski. International Journal of Educational Research & Social Sciences 2 (1):34–40. doi:10.51601/ijersc.v2i1.29.
- Kons, R. L., E. Franchini, and D. Detanico. 2018. Relationship between physical fitness, attacks and effectiveness in short-and long-duration judo matches. International Journal of Performance Analysis in Sport 18 (6):1024–36. doi:10.1080/24748668.2018.1545198.
- Kostiantyn, P., G. Grygoriy, P. Vasyl, B. Sergiy, B. Valentin, A. Volodymyr, and T. Pavlo. 2017. Correlation analysis of readiness indicators of athletes and their competitive results in kettlebell sport. Journal of Physical Education and Sport 17 (3):2123–28.
- Kozina, Z. L., M. Cieslicka, K. Prusik, R. Muszkieta, I. N. Sobko, O. A. Ryepko, S. A. Korol, S. B. Polishchuk, A. V. Osiptsov, and S. A. Korol. 2017. Algorithm of athletes’ fitness structure individual features’ determination with the help of multidimensional analysis (on example of basketball). Physical Education of Students 5 (5):225–38. doi:10.15561/20755279.2017.0505.
- Kozina, Z., I. Sobko, L. Ulaeva, D. Safronov, Y. Boichuk, A. Polianskyi, and V. Protsevskiy. 2019. The impact of fitness aerobics on the special performance and recovery processes of boys and girls 16-17 years old engaged in volleyball. International Journal of Applied Exercise Physiology 8 (1):98–113.
- Kravchuk, T. M., N. M. Sanzharova, J. V. Golenkova, and I. B. Katrechko. 2020. Influence of means of parterre gymnastics on physical fitness of young athletes in acrobatic rock and roll. Health, Sport, Rehabilitation 6 (3):19–25. doi:10.34142/HSR.2020.06.03.02.
- McCord, M., P. Davis, J. McCord, M. Haran, and K. Davison 2020. An exploratory investigation into the relationship between energy performance certificates and sales price: A polytomous universal model approach. Journal of Financial Management of Property and Construction252. Emerald Publishing Limited:247–71. 10.1108/JFMPC-08-2019-0068
- Osipov, A. Y., R. S. Nagovitsyn, F. H. Zekrin, D. A. Zubkov, T. V. Zhavner, and T. Vladimirovna Zhavner. 2019. Crossfit training impact on the level of special physical fitness of young athletes practicing judo. Sport Mont 17 (3):9–12. doi:10.26773/smj.191014.
- Politko, О. 2018. Model characteristics of physical development and special physical preparedness of swimmers 12–15 years old. Слобожанський науково-спортивний вісник 64 (2):37–40. doi:10.15391/snsv.2018-2.009.
- Sarafyniuk, L. A., A. V. Syvak, Y. I. Yakusheva, and T. I. Borejko. 2019. Correlations of cardiointervalographic indicators with constitutional characteristics in athletes of mesomorphic somatotype. Biomedical and Biosocial Anthropology 35 (35):17–22. doi:10.31393/bba35-2019-03.
- Silva, B., and F. M. Clemente. 2017. Physical performance characteristics between male and female youth surfing athletes. The Journal of Sports Medicine and Physical Fitness 59 (2):171–78. doi:10.23736/S0022-4707.17.08036-7.
- Strykalenko, Y., O. Shalar, V. Huzar, R. Andrieieva, I. Zhosan, and S. Bazylyev. 2019. Influence of the maximum force indicators on the efficiency of passing the distance in academic rowing. Journal of Physical Education and Sport 19 (3):1507–12.
- Titova, A. V., O. G. Chorniy, A. A. Dolgov, T. A. Gladyr, A. N. Slatvinskіy, V. S. Yarovenchuk, and I. M. Buchii. 2018. Parameters of biochemical control as a criteria of adaptive changes in the organism of athletes with various fitness levels engaged in the conditions of power fitness. Ukraïnsʹkij žurnal medicini, bìologìï ta sportu 3 (2):278–83. doi:10.26693/jmbs03.02.278.
- Zalyapin, V. I. I., A. P. Isaev, A. S. Bakhareva, and A. S. Aminova. 2019. Modelling the spectral characteristics of the circulatory system of athletes-skiers. Journal of Computational and Engineering Mathematics 6 (4):57–68. doi:10.14529/jcem190405.