
 ?Mathematical formulae have been encoded as MathML and are displayed in this HTML version using MathJax in order to improve their display. Uncheck the box to turn MathJax off. This feature requires Javascript. Click on a formula to zoom.
ABSTRACT
The integration of Artificial Intelligence (AI) into the financial industry has witnessed significant growth, transitioning from an academic concept to widespread adoption in the industrial sector. This trend has given rise to various AI technologies, presenting both novel opportunities and potential risks within the financial landscape. In light of this development, the present research article aims to investigate the expanding role of AI in the financial sector, focusing on its applications and impact across financial products, channels, and service methodologies. To accomplish this objective, a specific AI algorithm called Support Vector Machine for Regression (SVR) has been selected for analysis. The SVR algorithm is particularly well-suited for small sample learning, making it an appropriate choice for examining trends in Shibor. By employing a combination of theoretical analysis, case studies, and risk assessment, this article contributes to fostering a profound and robust integration of AI and finance. Consequently, it delivers both theoretical insights and practical significance, offering valuable knowledge for industry practitioners and academic researchers alike.
Introduction
In today’s rapidly evolving technological landscape, all industries must stay up-to-date with the latest advances. Technological innovations have the ability to transform industries and even entire eras. One such technological advancement that has garnered increasing attention is Artificial Intelligence (AI) (Ahmed et al. Citation2022). From the historic defeat of a world chess champion by Deep Blue to driverless cars, from smart translation to smart homes and factories, AI is a leading force driving a new era of industrial transformation. As AI technology becomes more deeply integrated into all aspects of life, it continues to reshape and revolutionize various sectors.
AI application has had a significant impact on the financial industry. As a heavily information-dependent industry, financial services have always had close association with information and data (Königstorfer and Thalmann Citation2020). The rapid development of AI technology has led to machine simulation of human functions at a large scale, enabling mass humanized and personalized customer service, with profound implications for high-end finance in the deep service value chain. The application of AI at the front end can serve customers, while middle-stage operational support can cover credit approval, diverse financial transactions, and analysis decisions (Ghosh and Kozarevic Citation2018). Background application is useful for risk prevention and control and supervision. The AI-based paradigm shift has impacted the existing financial structure, making financial services (banking, insurance, wealth management, lending, investment, etc.) more personalized and intelligent (Mamoshina et al. Citation2018). It is clear that AI technology will herald a new wave of changes across financial products, service channels, service methods, risk management, credit financing, investment decisions, and more.
The rapid advancement of internet technology has brought AI services to the forefront of people’s attention, finding widespread usage and appraisal in various domains. After AlphaGo’s victory over S.Li, interest in AI discussion peaked at new heights worldwide (Jones, Johnstone, and Wilson Citation2017). This technological trend continues to grow, not just in China but across the globe. Currently, the theoretical discussion revolves around AI application in medical equipment, security robots, voice assistants, smart cars, and other fields. In China and the United States, more than 30% of AI patent applications are related to robot technology, reflecting significant interest in AI’s application in the financial industry. Most literature focuses primarily on specific AI applications in finance, with a dearth of comprehensive analysis on AI and finance integration. Thus, this research article generates theoretical value by offering such an in-depth analysis.
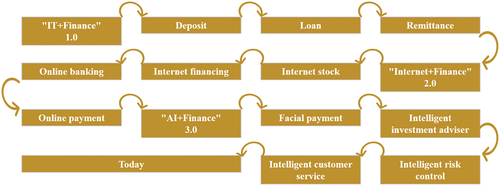
The evolution of smart finance applications in China is depicted in . In the early “IT+Finance” 1.0 era, computers and information technology were gradually integrated into the daily financial business transactions and office work of financial institutions, realizing electronic accounting of deposits, remittances, loans, and improving the processing capabilities of infrastructure such as magnetic stripe credit cards, ATM machines, and POS machines, which significantly improved data processing capabilities and financial service efficiency. The following “Internet+Finance” 2.0 era saw the emergence of internet technology, big data, and cloud computing, which expanded the financial business channels and enhanced business processing efficiency, giving rise to online banking, mobile banking, card-free payment, internet credit, and internet personal financial management. This era marked the start of the historical process of the integration of finance and technology. Presently, people are experiencing the “AI+Finance” 3.0 era. Since 2014, technologies such as machine learning, computer vision, and information processing have been widely applied in the financial industry. This era witnesses the emergence of intelligent customer service, intelligent marketing, intelligent risk control, and intelligent investment advisory, signifying the beginning of China’s smart finance revolution (Ahmed et al. Citation2022).
Figure 1. Application history of smart finance in China.
The financial industry is an information-intensive industry that relies on big data. AI brings superior data processing capabilities compared to humans, owing to its data mining, machine learning, and precise profiling features. The integration of AI in financial business transactions creates opportunities for improving operational efficiency, reducing transaction costs, and expanding business scope. The combination of finance and AI has, therefore, become an inevitable trend. This research paper holds crucial practical significance, as it aims to facilitate the integration of finance and AI, identify potential challenges, and mitigate risks.
The understanding of the factors influencing the call rate trend is crucial for policymakers, financial institutions, and market participants. While previous studies have identified the significance of variables such as the Consumer Price Index (CPI), exchange rate, and interbank pledged repo rate, there remains a need to incorporate more comprehensive and up-to-date information to enhance predictive accuracy. Therefore, this study aims to fill this gap by including the variable for the previous month’s Shibor rate, allowing for the leverage of all relevant past information. By doing so, we seek to improve the understanding and forecasting of the call rate trend, which has implications for monetary policy decisions, risk management strategies, and market participants’ actions.
The Integration Basis of “AI + Finance”
Big Data
Throughout the Age of Discovery, capital and mechanical kinetic energy have been the primary driving forces of global modernization. However, in the next technological revolution and social change, data will become the core driving force. With the emergence of the Internet, mobile Internet, and the Internet of Things, data has shown explosive growth, and the finance industry has accumulated a vast amount of data, including customer information, transaction information, asset and liability information, and more (Chen, Härdle, and Moro Citation2011; Huang, Wu, and Wang Citation2017). Moreover, with big data and cloud computing at the forefront, AI technology empowers various participants and business links in the financial industry, thereby upgrading services. From a business angle, the financial field is the best fit for AI as it is the only purely digital and monetary field. Thus, using AI technology as the primary driver will aid in service and industrial upgrading in the financial industry.
Due to its close ties with data, AI finds easy application, especially in the financial industry where businesses primarily revolve around data processing. Several aspects of the finance industry, including investment, wealth management, and credit, rely on data. Investigations and risk control also rely heavily on these data. However, manual processing of this data is tedious and delivers unsatisfactory processing effects. Integrating AI into these tasks will significantly improve work efficiency, reduce the error rates in data processing, and ultimately reduce the risk rate in the finance industry.
Cost Reduction
Fintech companies are utilizing AI and its advanced analytical techniques more frequently to provide added value in the capital market. In securities issuance in the primary market, fintech platforms are targeting inefficient vehicles for securities sales. In the underwriting link of the stock or bond market, issuers and investors are shifting toward a single solution platform, such as stock exchanges and bill markets. The objective of AI is to enhance intermediary work, provide buyers and sellers with matching predictions that comply with regulatory requirements, efficiently identify potential customers for companies, and screen corresponding asset targets for institutional customers. In the secondary market, it encompasses all aspects of pre-transaction, transaction execution, and post-trade.
Furthermore, numerous positions in the financial industry are structured positions that only necessitate processing through certain models and analysis software. Relying solely on manual labor to perform these structured tasks may result in numerous errors, and processing efficiency may also remain low. The use of AI to manage human-related work can address these challenges. By enhancing accuracy, AI can also resolve the issue of low processing efficiency caused by manual handling (Lahmiri and Bekiros Citation2019). Thus, the innate connection between the financial industry and data, coupled with the intense demand, enable AI to fully leverage its capabilities and continue to drive the innovation of the financial industry.
Soaring Investment
The progression of any industry depends heavily on investment support. The profound integration of AI and finance is set to revolutionize the economic and financial sectors, making it an enticing opportunity for investors. It is found that the amount and volume of AI investments in China continued to escalate between 2012 and 2016. This growth hit exponential levels after 2014. In 2016, China’s investment in AI surged to 1.66 billion US dollars, with investment volume multiplying by 285 times. Accenture’s latest survey results indicate that global fintech investment more than doubled to US. 14 billion financing making a substantial contribution. It’s clear that the remarkable enthusiasm of investors and the significant investments made have become the key foundation for bolstering the integration of “AI+Finance.”
Changes in Ideas and Demands
In traditional consumer and bank credit, most loans are allotted for considerably large amounts, and daily consumption comprises a minimal proportion. Credit cards, generally reserved for individuals with a sound credit rating, serve as the conduit. However, with the advent of e-commerce and the internet, there has been an upsurge in the number of younger customers seeking consumer credit, wealth management, convenient payment, and personalized marketing experiences. The mounting requirements of e-commerce firms for small loans and precise marketing have led to impediments for traditional financial institutions due to factors such as systemic and structural limitations. Consequently, customer demands have driven financial institutions to implement AI technologies such as data mining, language, and image recognition and machine learning to cater to the preferences of their customers, enhance their experience, cater to the entire spectrum of consumer and microfinance, gain insightful preference and intelligent matching, and attain smart and well-informed wealth management.
Case Studies of AI in the Financial Sector
The financial industry has embraced AI technology more extensively than any other sector. It encompasses technology companies providing AI services to financial institutions, traditional financial institutions utilizing technology, emerging financial formats, and financial regulatory authorities. Intelligent financial models are categorized into intelligent investment advisory, intelligent customer service, intelligent risk control, intelligent marketing, and other services, depending on AI technology’s application in various financial services.
Robo- Advisor
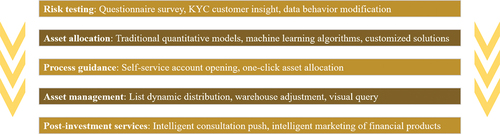
Robo-advisor is a term referring to the utilization of AI technologies such as big data and cloud computing in financial investment advisory. It is primarily focused on enhancing asset management and allocation capabilities in addition to providing information and consultation services. Robo-advisors have surfaced as robot fund managers, which have become more visible to the public. As illustrated in , the robo-advisory process typically encompasses the following steps: Firstly, risk testing that entails collating necessary customer information via risk questionnaires, KYC customer insight, data behavior correction, preference insight, among others. Secondly, asset allocation employing personalized solutions, machine learning algorithms, and traditional quantitative models. Thirdly, self-service account opening and one-click asset allocation through process guidance. Fourthly, asset management achieved through dynamic distribution of the asset portfolio, trading, position adjustment, and visual queries. Lastly, post-investment services are delivered through intelligent consultation and wealth management product marketing.
Figure 2. Flowchart of the intelligent investment account service.
With the rapid advancement of big data and AI, robo-advisors have gained enormous popularity in the financial market. Despite their relatively short entrance into the Chinese market, robo-advisors have taken the financial industry by storm in a relatively brief span. According to the analysis report, by 2020, China’s robo-advisory industry’s asset management scale is anticipated to hit 5.22 trillion yuan, and the management fee scale is projected at 15.66 billion yuan. In addition to using big data for information collection and processing, AI is used for some investment research, qualitative and quantitative research, which necessitates a certain degree of quantitative experience and aptitude. Strong technical support is essential to the applications of robo-advisors in their respective scenarios.
Numerous financial institutions currently offer “robo-advisor” products and services; however, the investment targets, strategies, and risk disclosures of these products tend to differ. This article aims to compare and analyze the “smart investment advisory” offerings of three commercial banks and financial institutions, namely China Merchants Bank’s “Capricorn Smart Investment,” ICBC’s “AI Investment Advisory,” and Bank of China’s “BOC Smart Investment,” and investigate their further development in China. From a market viewpoint, the “smart investment advisory” product offerings of all three banks under CCMG have placed in the top three, with a total investment scale of approximately 17 billion yuan. Industrial and Commercial Bank of China followed suit.
This study compares the data of listed funds during the same period, with a trading start date of 2017-06-30 and a closing date of 2018-06-30, as shown in .
Figure 3. Listed fund yield range report at the same time.
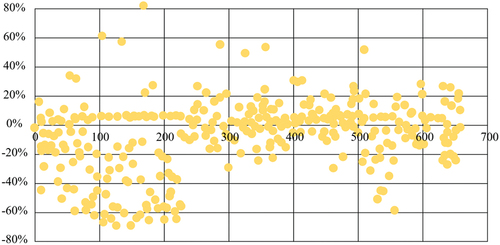
The Listed Fund Yield Range report aims to provide insights into the performance and variability of listed funds during a specific period. In this case, the study focuses on comparing the data of listed funds with a trading start date of 2017-06-30 and a closing date of 2018-06-30. The report analyzes the yield range of these funds to understand the extent of their returns over the given period.
The yield range refers to the range of returns achieved by listed funds during the specified timeframe. It provides an indication of the potential gains or losses that investors may have experienced with these funds. By examining the yield range, investors, fund managers, and analysts can gain insights into the volatility and risk associated with different funds.
The report likely includes statistical measures such as minimum and maximum yields, as well as measures of central tendency like the average or median yield. These measures help summarize the distribution of fund returns and provide an overview of the performance range exhibited by listed funds during the stated period.
Additionally, the report may present graphical representations, such as box plots or histograms, to visualize the distribution of fund yields. These visuals can help identify outliers, skewness, or patterns within the data, further enhancing the understanding of the yield range.
By analyzing the listed fund yield range, investors and stakeholders can make informed decisions about fund selection, risk management strategies, and portfolio diversification. It allows for a comprehensive assessment of the potential returns and variability associated with different listed funds during the specified period, aiding in the evaluation and comparison of investment options.
The data reveals that most listed funds during the same period recorded negative returns, mainly attributable to China’s current market environment. Nevertheless, the robo-advisory offerings introduced by the three banks recorded positive returns that are higher than the market average. This indicates that robo-advisor products continue to exhibit higher short-term income returns than those attainable in conventional markets, and reinforces the inherent advantages of using AI technologies.
Presently, all banks employ a “black box” investment strategy for their “robo-advisor” product portfolio strategy. Banks have publicly stated that their “robo-advisor” products do not feature complete “robot investment” and primarily rely on a “human + machine” combination to serve investors, whereby they adjust investment portfolio ratios based on market conditions. As such, there is still much work to be done to improve and advance robo-advisors. With 5 G’s advent, information processing speeds will increase, and robo-advisors will use AI self-learning and big data to create independent asset portfolios. This will better equip robo-advisors to respond to market changes, significantly reduce labor costs, and enhance asset allocation efficiency.
Intelligent Risk Control
Intelligent risk control involves the smart utilization of big data to integrate relevant information regarding risk control, along with the implementation of machine learning to grasp risks independently (Goel and Uzuner Citation2016). Such a proactive approach allows for the establishment of risk management firewalls and warning lines which can be standardized and managed intelligently. Despite decreased relevant indicators in the subsequent years after the 2008 financial crisis, the non-performing loan ratio of commercial banks has reached its highest point in the last decade largely due to credit lock-up caused by the financial market decline. Conversely, in recent years, non-performing loans and non-performing loan ratios have significantly increased, especially since 2014 in the four major banks. Additionally, SMEs’ difficulty in obtaining financing has been a major issue impeding China’s macroeconomic development.
demonstrates how intelligent risk control has been established as a standard protocol for commercial bank loans, incorporating pre-lending, during lending, and post-lending phases, all of which utilize various AI technologies to further enhance risk management.
Table 1. Intelligent risk control flow sheet.
The table presents a flow sheet outlining the intelligent risk control process, highlighting the different stages and components involved in managing risk throughout the loan lifecycle. The flow sheet is divided into three main sections: Pre-loan, Loan period, and Post-loan. Each section consists of specific activities and technologies employed in different phases of the loan process.
Pre-loan:
Marketing Customer: This stage involves activities related to identifying potential customers and promoting loan products or services to them. It may include market research, customer segmentation, and targeted marketing strategies.
Loan Application: This step involves the submission of loan applications by customers interested in obtaining a loan. It could include collecting customer information, verifying eligibility criteria, and assessing initial loan requirements.
Loan Review: In this phase, the loan applications are thoroughly reviewed and evaluated. It may involve assessing the applicant’s creditworthiness, conducting background checks, and analyzing financial information to determine the risk associated with the loan.
Loan Management: This stage focuses on managing the loan process once it has been approved. It includes activities such as structuring the loan, setting terms and conditions, and documenting the loan agreement.
Loan Period:
Machine Learning: This component represents the utilization of machine learning techniques in the risk control process. It indicates the application of advanced algorithms to analyze data, detect patterns, and make predictions or decisions related to risk management.
Face Recognition: Face recognition technology is employed to identify and verify individuals during loan processing. It can help authenticate the identity of loan applicants or borrowers.
Micro Expression Recognition: Micro expression recognition involves the analysis of subtle facial expressions to assess emotional states and intentions. It may be utilized during loan period monitoring to identify potential fraud or unusual behavior.
Speech Recognition: Speech recognition technology is used to transcribe and analyze spoken language. It may be applied in loan-related communication, such as customer service interactions or loan agreement discussions.
Knowledge Mapping: Knowledge mapping refers to the process of organizing and visualizing information and expertise within an organization. It can aid in decision-making, risk assessment, and resource allocation during the loan period.
Post-loan:
Overdue Collection: This component focuses on managing and collecting overdue loan payments. It involves strategies and processes for identifying and addressing delinquent accounts, including reminders, notifications, and debt recovery procedures.
Learning Speech Communication: Learning speech communication encompasses activities aimed at improving communication skills and customer interactions. It may involve training loan officers or customer service representatives to effectively communicate with borrowers or address inquiries.
Overall, the flow sheet highlights the integration of various technologies, such as machine learning, face recognition, micro expression recognition, and speech recognition, in different stages of the loan process. These technologies and activities are designed to enhance risk control, streamline operations, and improve decision-making in loan management. The flow sheet provides an overview of the intelligent risk control framework, emphasizing the importance of technology-driven approaches in managing risk throughout the loan lifecycle.
ZRobot, a subsidiary of JD Digits, is an innovative big data service provider that uses cutting-edge AI technologies like data mining and machine learning to deliver intelligent risk control solutions for financial institutions. Its services help improve the overall risk control capability of these enterprises across various domains like banks, consumer finance, auto financing, and more. In recognition of its exceptional accomplishments, ZRobot was presented with the “Financial Technology Risk Control Leadership Award” at the “2017 Ninth Annual Meeting of Financial Technology and Payment Innovation Decision Makers,” and the “Big Data Application Platform Award” at “2018 China Golden Fingertip Awards.”
ZRobot offers a comprehensive range of data services that include shopping, transaction, and financial data across multiple e-commerce scenarios, as well as access to external data sources including operators, UnionPay, public security, and industry sharing, covering more than 400 million users. By leveraging bank credit data that complements each other, ZRobot’s billion-level anti-fraud database and modular decision-making engine provide a reliable and stable risk control model, while also offering expert technical services such as model design, development, and application to enhance the bank’s in-house risk control capability.
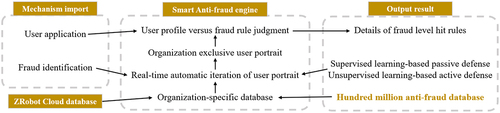
ZRobot is a powerful platform that enables banks to access intelligent risk control services. In , it can be seen how ZRobot offers banks credit scores and user portrait products based on insights drawn from hundreds of millions of customers. These features help banks evaluate customers accurately during the approval process. ZRobot also includes intelligent anti-fraud and decision-making engines that banks can use to complete online credit business approvals. Additionally, banks can take advantage of ZRobot’s risk control model building, tuning, and operation consulting services to streamline the approval time to credit and loan within seconds. With access to ZRobot’s proprietary data, banks can identify over 18% more high-quality customers.
Figure 4. Schematic diagram of intelligent risk control application.
Smart Marketing
Intelligent marketing revolves around the integration of big data and AI to gain valuable insights into customer behavior (Cioffi et al. Citation2020). Through online social channels and offline activities, AI-powered perspective analysis helps businesses acquire customers in a smart and efficient manner. With features such as automatic sales report generation and intelligent analysis, businesses can leverage big data informatization to accurately match products with customer needs, resulting in increased efficiency and reduced costs. Significantly, intelligent marketing targets a wide range of consumer groups and automates complex marketing tasks based on big data. It also evaluates products and markets to ensure customer retention, ultimately reducing the costs of manual operation.
In , the first step in intelligent marketing is the use of cloud computing and quantitative data analysis to identify consumer consumption patterns and characteristics. This information is then utilized to create groups of customers, accurately target users, and carry out precise marketing and personalized recommendations. The second stage in the intelligent marketing process is automation, which involves attracting traffic, acquiring customers and making accurate recommendations. By utilizing big data analysis, intelligent marketing ensures a closed-loop management process that includes customer analysis, marketing planning, execution, and evaluation. This process accurately portrays user portraits, enabling the development of effective marketing plans that result in precise marketing campaigns and personalized recommendations. Real-time monitoring ensures optimization of the strategic plan, while customer feedback is integrated into the database for subsequent analysis. Finally, marketing execution comprises two segments; precision marketing, which aims to attract and acquire new customers, and personalized recommendations, which enhance customer retention and activation.
Figure 5. Flow chart of intelligent marketing.

Qiji Intelligence leverages its self-developed big data analysis application to help banks screen, analyze, and classify their customer consumption behavior data. Through this process, Qiji Intelligence can make informed judgments on customer consumption preferences and behaviors, enabling the creation of customer-centric marketing plans. Using its product development capabilities, Qiji Intelligence customizes mail-order products that cater to target customer groups. The company then recommends and sells these products to customers through the banking system, primarily offering precious metal products and commemorative coins that reflect cultural and sentimental value. Additionally, Qiji Intelligence leverages credit card consumption installment policies to offer interest-free installment services of different periods (6, 12, and 24 months) to consumers. During this period, customers pay for their goods in installments every month, resulting in a better customer experience and increased bank card usage. After successfully generating sales revenue, Qiji Intelligence shares revenue with the bank based on the sales results. This commodity mail order installment business is currently Qiji Intelligence’s primary service offering, with partnerships established with nine large banks. Once a bank card customer confirms the purchase, Qiji Intelligence mails the goods to the customer directly.
SVR Model-Based Overnight of Shibor Forecast
The Shibor system, which has been in operation since 2007, provides limited monthly data for overnight Shibor. This scarcity of data presents a challenge for forecasting purposes. In order to address this challenge and leverage the unique characteristics of the research subject, we have employed a SVR to develop a forecasting model. The selection of SVR is motivated by its inherent advantages in handling small sample sizes, non-linearity, non-stationarity, and high-dimensionality, which are prevalent in this context.
Support Vector Machines (SVM) are primarily applied in practical problem-solving for classification and pattern recognition tasks. However, SVR incorporates an insensitive loss function into the classification process of SVM, which has proven to be effective in tackling regression problems. In classification, SVM constructs an optimal surface to segregate samples into two distinct types. In the context of regression fitting, the objective is to minimize the distance between the classification surface and all training samples, thereby transforming non-linear regression tasks into linear regression problems in high-dimensional space. This transformation aids in approximating the relationship between input and output variables.
The choice of SVR as a modeling technique was likely driven by several factors that made it a suitable option for their research objectives. Here are some reasons why this study considered SVR as a good modeling tool:
Nonlinearity: SVR is particularly well-suited for handling nonlinear relationships between variables. It can capture complex patterns and nonlinearities in the data, allowing for more accurate predictions. This flexibility is especially important when dealing with financial data, as relationships between variables in financial markets are often nonlinear and subject to various dynamic factors.
Robustness to outliers: SVR is known for its robustness to outliers in the data. Outliers are extreme values that may skew the analysis or affect the model’s predictive performance. By employing SVR, the authors can minimize the impact of outliers and obtain more reliable predictions, ensuring that extreme observations do not unduly influence the model’s performance.
Effective in high-dimensional spaces: SVR can handle datasets with many variables, making it suitable for situations where multiple independent variables are considered simultaneously. In the authors’ case, they incorporated several variables, such as the Consumer Price Index, exchange rate, interbank pledged repo rate, and the Shibor rate, to capture the multifaceted nature of the financial market dynamics. SVR’s ability to handle high-dimensional data makes it a powerful tool in this context.
Generalization performance: SVR aims to achieve good generalization performance, which refers to the model’s ability to make accurate predictions on new, unseen data. By optimizing the model’s parameters during the training phase, SVR can effectively generalize from the training data to make accurate predictions on future observations. This is an important consideration when building a predictive model, as it ensures that its performance extends beyond the specific dataset used for training.
Established methodology: SVR is a well-established and widely used machine learning technique. It has been applied successfully in various fields, including finance and economics, making it a trusted and recognized tool for predictive modeling. The authors likely considered the existing literature and empirical evidence supporting the use of SVR in similar contexts, which would have contributed to their decision.
By considering these factors, this research concluded that SVR was a suitable modeling tool for the research objectives. Its ability to handle nonlinear relationships, robustness to outliers, capability in high-dimensional spaces, good generalization performance, and established methodology made SVR a compelling choice for this study.
The derivation process of the SVR algorithm is outlined below:
Given training set sample pair ; Construct the regression function (linear) in the high dimensional (can be infinite dimensional) feature space (equation 1):
where w is weight vector, Φ(x) is a nonlinear mapping function, b for bias. Define the C-linear insensitive loss function. The C-linear insensitive loss function is a type of loss function commonly used in SVR models. SVR is a variant of SVM that is used for regression tasks. The C-linear insensitive loss function is specifically designed to handle regression problems where a certain degree of tolerance or insensitivity to errors is desired.
In regression tasks, the goal is to predict continuous numerical values rather than discrete classes. The C-linear insensitive loss function aims to minimize the difference between the predicted and actual values while allowing for a certain margin of error or tolerance. It penalizes errors that exceed a predefined threshold, known as the ε-insensitive zone.
The C-linear insensitive loss function is defined as follows (equation 2):
In the equation, L represents the loss, y is the true target value, f(x) is the predicted value, and ε is the margin of tolerance. If the absolute difference between the true and predicted values is smaller than ε, the loss is zero, indicating that the prediction falls within the ε-insensitive zone. However, if the difference exceeds ε, the loss increases linearly with the magnitude of the difference.
The parameter C in the C-linear insensitive loss function represents the penalty factor that determines the trade-off between minimizing the error and allowing for deviations within the ε-insensitive zone. A larger value of C emphasizes the importance of reducing errors and results in a more strict regression model, while a smaller value of C allows for more tolerance to errors.
By minimizing the C-linear insensitive loss function, the SVR model aims to find the optimal hyperplane that best fits the training data while satisfying the tolerance defined by ε. This loss function enables the model to focus on reducing significant errors while allowing for smaller deviations within the tolerance zone.
It is important to note that the C-linear insensitive loss function is just one of several loss functions available for SVR models. The choice of the loss function depends on the specific requirements of the regression problem and the desired trade-off between accuracy and tolerance to errors.
Type, (x) as the predicted value, y is a true value, the corresponding ε is to control the fitting precision is not sensitive coefficient. The introduction of slack variable , minimizing the objective function is constructed according to the rule of SVR (equations 3 and 4):
The introduction of slack variables, denoted as , is an important component in constructing the objective function for Support Vector Regression (SVR). SVR is a variant of Support Vector Machines (SVM) used for regression tasks.
In SVR, the goal is to find a hyperplane that best fits the training data while simultaneously allowing for a certain degree of error or tolerance. The introduction of slack variables allows for the modeling of deviations from the desired fit within specific bounds.
The objective function in SVR consists of two components: a loss term and a regularization term. The loss term measures the errors between the predicted values and the actual target values, while the regularization term controls the complexity of the model to prevent overfitting.
To incorporate the slack variables, the objective function is constructed based on the following principles:
Minimizing the Errors: The slack variables are introduced to measure the degree of deviation or error for each training sample. These variables represent the distances between the predicted value and the actual target value. By minimizing the slack variables, the objective function aims to reduce the overall error of the model.
Considering Tolerance Bounds: SVR allows for a tolerance region or margin around the hyperplane, within which deviations are acceptable. The slack variables help enforce these tolerance bounds by penalizing deviations that exceed the specified margin.
Balancing Error and Complexity: The objective function combines the loss term, which penalizes errors, and the regularization term, which penalizes model complexity. This balance ensures that the model achieves good generalization by minimizing errors while keeping the model’s complexity in check.
The slack variables are introduced to represent the errors on the positive and negative sides of the tolerance region, respectively. They are subject to constraints that enforce the bounds and ensure that the deviations fall within the specified margin.
The complete objective function in SVR can be expressed as:
subject to:
In the objective function, ||w||^2 represents the squared Euclidean norm of the weight vector, which controls the complexity of the model. C is the regularization parameter that balances the trade-off between minimizing the error and controlling the complexity. The term sums up the slack variables, representing the total error.
The constraints ensure that the deviations from the desired fit fall within the margin of tolerance (ε) and are captured by the slack variables. The non-negativity constraints onThe non-negativity constraints on ensure that the slack variables are non-negative.
By minimizing this objective function, SVR aims to find the optimal hyperplane that minimizes the error while satisfying the tolerance bounds and the regularization requirements. The introduction of slack variables enables the modeling of deviations and provides flexibility in handling data points that lie outside the margin of tolerance.
In the equation 4, C > 0 as the penalty factor, said the training samples of error is greater than the ε penalties. By introducing Lagrange function, the dual optimization problem can be obtained as follows (equations 5 and 6):
where, as the kernel function, commonly used with polynomial kernel function, Sigmoid kernel function and radial basis kernel function, this paper chooses radial basis kernel function. From the type of solution of
,
, then w* and b*, the regression function is (equation 7):
Based on the comprehensive analysis conducted above, it becomes evident that the Consumer Price Index (CPI), exchange rate, and interbank pledged repo rate exert a substantial influence on the trend of the call rate. In order to incorporate all pertinent historical information, the variable representing the Shibor (Shanghai Interbank Offered Rate) from the previous month is included. For the purpose of this research, monthly data pertaining to four independent variables was selected, encompassing the time span from January 2007 to November 2015. These variables include the month-on-month growth rate of the exchange rate and the pledged repo rate. In conjunction with the monthly arithmetic mean data of overnight Shibor from February 2007 to December 2015, a total of 107 data sets were acquired. It is worth noting that the monthly data for the four interest rate driving factors must consistently align with the subsequent month’s overnight Shibor rate in order for the predictive model to possess practical significance.
To establish the SVR predictive model, 86 out of the 107 data sets were employed for training purposes, while the remaining 21 sets were used to evaluate the model’s predictive performance. The model was then utilized to forecast the monthly mean value of the overnight Shibor from April 2014 to December 2015. As illustrated in , the SVR predictive model demonstrates a reasonable level of accuracy in predicting the overnight Shibor, owing to the relatively stable nature of the monthly mean data.
Figure 6. Prediction rendering of SVR model.
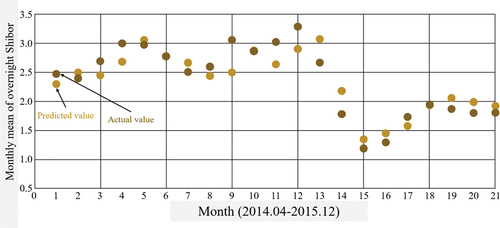
The SVR predictive model was employed to generate forecasts for the monthly mean value of the overnight Shibor from April 2014 to December 2015. The model, built upon a dataset comprising 86 training sets, aimed to accurately predict the future trends of the overnight Shibor rate. By utilizing the principles of Support Vector Regression, the model incorporated a range of variables, including the CPI, exchange rate, interbank pledged repo rate, and the Shibor rate from the previous month.
The SVR model was designed to capture the underlying patterns and relationships within the dataset, enabling it to make informed predictions. Through a process of training, the model learned from the historical data and developed an understanding of the factors influencing the overnight Shibor rate. This training phase involved optimizing the model’s parameters to minimize errors and enhance its predictive capability.
Following the training phase, the SVR model was evaluated using 21 test sets, allowing for an assessment of its performance and accuracy. These test sets represented a separate subset of data that was not used during the training process. By evaluating the model’s predictions against the actual values of the overnight Shibor rate, the effectiveness of the SVR model in forecasting the rate could be gauged.
The following presents the significance of variables in the SVR Model.
Table 2. Significance of variables in the SVR model.
In the above table includes columns for the variable name, coefficient estimate, standard error, t-value, and p-value. The p-value column indicates the significance level of each variable, with values less than the predetermined threshold (0.05) considered statistically significant. The symbols “<” and “>” are often used to denote very small p-values, such as “<0.001,” indicating that the p-value is smaller than 0.001.
The model’s predictive performance was assessed by comparing the forecasted values with the actual monthly mean values of the overnight Shibor. illustrates the outcomes of this evaluation process, demonstrating the accuracy of the SVR model in generating predictions. Notably, the model was able to achieve reasonably accurate forecasts due to the relatively low volatility observed in the monthly mean data. This suggests that the SVR model was successful in capturing the underlying patterns and trends in the overnight Shibor rate, allowing it to make reliable predictions for the specified time period.
If high volatility of monthly mean data occurs, it can affect the performance of the SVR model. The model’s ability to function well in the presence of high volatility depends on various factors, including the magnitude and frequency of the volatility, the underlying patterns in the data, and the model’s capacity to capture and adapt to such fluctuations. Here are some considerations:
Model Sensitivity: High volatility can introduce increased noise and variability in the data, making it more challenging for the model to accurately capture the underlying patterns. The SVR model may become more sensitive to fluctuations, potentially leading to less reliable predictions. In such cases, the model’s performance may be compromised, and the accuracy of the forecasts may be reduced.
Training Data Representation: If the training data used to build the SVR model does not adequately represent the high volatility periods, the model may struggle to learn and generalize from such data. This can result in poorer predictive performance during volatile periods. It is crucial to ensure that the training dataset includes a diverse range of observations that cover both high volatility and stable periods.
Model Adaptability: The SVR model’s adaptability to changing market conditions and volatility is essential. If the model has been trained on historical data that includes periods of high volatility and the underlying relationships between the variables remain stable, it may still exhibit reasonable predictive capability during volatile periods. However, if the model has not been adequately trained on such data, its performance may suffer.
Feature Engineering and Model Updates: During periods of high volatility, it may be necessary to revisit the feature engineering process and consider additional or alternative predictors that capture the changing dynamics of the market. Adjusting the model’s input variables or incorporating additional variables specific to volatile periods can potentially enhance its performance.
Model Evaluation: It is crucial to assess the model’s performance during periods of high volatility separately. Metrics such as MSE, RMSE, MAE, or MAPE can provide insights into the model’s accuracy and stability in capturing volatile trends. Comparing the model’s performance during high volatility periods with that during stable periods can help identify any deterioration or improvement in its predictive ability.
In summary, the SVR model’s performance during high volatility depends on multiple factors, including the nature and representation of the training data, the model’s adaptability, and the presence of appropriate features. While high volatility can pose challenges, proactive measures such as proper training data representation and feature engineering can help mitigate the impact and enhance the model’s performance in such conditions.
Potential Risks of Applying AI in the Financial Industry
Technical Risk
AI is still in the developmental stages, moving from perceptual intelligence to cognitive intelligence. While some in the financial industry believe that machines will replace most human tasks and have already done so, this transition still has a long way to go. Currently, AI has the ability to perceive human voices and images, but the processing of this perception information still requires manual programming. Cognitive intelligence, which enables machines to think like humans, remains a technical breakthrough, allowing them to think abstractly and understand the essence of things. While perceptual intelligence applications in finance are gradually maturing, cognitive intelligence improvements are still needed. Additionally, an article in PNAS highlights AI’s deep learning limitations, including vulnerability to adversarial attacks, unstable applications, and a lack of interpretability. The article concludes that deep learning is not the answer to achieving human intelligence.
The risk control system in traditional securities trading operates with a transaction response time of only seconds. However, this is insufficient for the requirements of high-frequency arbitrage trading. The risk control system developed using traditional IT technology causes significant delays and impedes the prompt placement of orders. This is the main reason why risk control measures in each link are ineffective. Meeting these challenges is a significant task for AI-based transactions in the future.
As AI technology plays an increasing role in the financial industry, financial infrastructure and communication systems that rely on AI are vulnerable to external attacks. Unfortunately, cyber-attacks targeting financial information have risen in recent years. Hackers are employing advanced persistent threats and other methods to illegally acquire data, steal customer funds, and launder databases. As technologies continue to develop, protection methods must evolve and be strengthened to match these advancements. It is essential to update technical support systems continually to ensure protection against potential cyber-attacks.
AI technology is a vital component of the financial industry and operates exclusively through network connections. However, malicious network hackers can attack connected financial systems, leading to data leakage, related departmental involvement, and, in severe cases, significant economic losses. Furthermore, most financial networks utilize independent host computers. When a host computer is targeted by network hackers, it can cause direct economic losses or even paralyze the entire financial network system. Viruses can also impact financial network systems, leading to operation failure and fundamental statistical errors. Defense mechanisms against network attacks have always been a crucial element of information technology. Yet, it is essential to acknowledge that some of these problems may not be solely resolved through technology. An effective risk management system requires a multi-level and diversified institutional arrangement to prevent such incidents from occurring.
Information Security Risks
Information security is a vital concern across industries, particularly in finance, where data is abundant. Startlingly, more than 10 million records were leaked worldwide in the first half of 2018, resulting in several grave incidents, no less than 10 of which caused financial losses of tens of thousands. In smart finance, two data challenges exist: data information silos and effective data application. Data Monopoly occurs when vast amounts of data are monopolized by internet giants, such as Ali, Baidu, and Tencent, causing information islands that hinder information exchange among smart financial companies. Effective data application will only arise when extensive, authentic, and precise data is available. Despite having access to vast quantities of financial data, receiving and processing it efficiently is a significant challenge for Smart Finance. Neglecting data analysis may lead to preposterous outcomes, necessitating a thorough understanding of both finance and data logic to unearth the true worth of data.
Risks at the Regulatory Level
AI technology’s ongoing development not only yields technological benefits but also presents a complicated regulatory landscape. This landscape’s first challenge is the diversification of regulatory targets, followed by the blurring of legal definitions and increased complexity for responsible parties, highlighting the need for thorough discussions of specific risks within the dynamic market.
At the core of AI lies its algorithm, which, when opaque and undisclosed, creates the “algorithm black box,” a significant problem for human society. Therefore, regulating algorithms has become an insurmountable challenge for lawmakers. To guarantee technical security in the AI era, it is imperative to keep algorithms open, transparent, and fair. Only then can the problem of the “algorithmic black box” be addressed responsibly.
Anti-money laundering refers to the prevention of criminal proceeds and concealment of illegal activities such as drug trafficking, organized crime, terrorism, smuggling, corruption, bribery and financial frauds. Traditional anti-money laundering rules are paper-based and hence, inadequate in the AI era. Such rules do not apply to certain forms of electronic payments. In the AI era, paperless financial businesses can be remotely operated, making it even more challenging for relevant departments to track funds flows.
Centralized AI and self-learning methods for risk management and control can be disruptive. While it enables real-time analysis of customer risk judgments, it may lead to pro-cyclical behavior, potentially increasing micro-financial risks. Financial technology companies typically leverage technology to quickly respond to market changes. Although such instantaneous response can be beneficial, it can also cause market reactions. In the event of bad news, the system may prompt institutions to sell, causing the market environment to fluctuate substantially. To avoid such pro-cyclical risks, it is essential to adopt macro-prudential supervision and counter-cyclical operations.
Measure Risks Numerically
Risk measurement is a fundamental aspect of risk management, and various quantitative methods are used to quantify and assess different types of risks. Some commonly used quantitative measures for risk assessment include:
Value at Risk (VaR): VaR is a statistical measure that estimates the maximum potential loss within a specific confidence level over a given time horizon. It quantifies the potential downside risk by providing a numerical estimate of the amount that an investment or portfolio could lose under adverse market conditions.
Expected Shortfall (ES): Also known as Conditional Value at Risk (CVaR), ES represents the average expected loss beyond the VaR level. It provides a measure of the severity of losses in the tail of the distribution and offers additional information beyond VaR.
Standard Deviation: Standard deviation is a measure of the dispersion or volatility of returns. It quantifies the extent to which individual observations within a dataset deviate from the mean. Higher standard deviation indicates higher volatility and, consequently, higher risk.
Beta: Beta is a measure of systematic risk or market risk associated with an investment relative to the overall market. It represents the sensitivity of an asset’s returns to changes in the market returns. A beta greater than 1 indicates higher volatility compared to the market, while a beta less than 1 indicates lower volatility.
Credit Ratings: Credit rating agencies assign numerical ratings to assess the creditworthiness and default risk of debt issuers. These ratings range from high-quality (e.g., AAA) to low-quality (e.g., D) and provide an indication of the level of credit risk associated with an investment.
Sharpe Ratio: The Sharpe ratio measures the risk-adjusted return of an investment by considering the excess return earned relative to the risk-free rate per unit of total risk. A higher Sharpe ratio indicates a more favorable risk-return trade-off.
It is important to consider the appropriate risk measurement techniques and indicators based on the specific context and requirements of the study or analysis.
Conclusion
The rapid advancement of AI has had a profound impact on the finance industry, particularly in the high-end segments of the deep service value chain. This influence stems from several key factors, including the ripple effects generated by AI, its ability to process vast amounts of data, its cost and efficiency advantages, and its capacity for managing emotions within financial contexts. However, alongside these benefits, the application of AI in finance also carries certain risks that must be considered. These risks encompass technical challenges, information security vulnerabilities, regulatory implications, moral hazards, and investment uncertainties.
In light of the AI era, traditional financial professionals are required to undergo a transformative process, evolving into compound talents who possess multidisciplinary expertise. Simultaneously, financial institutions must accelerate their pace of adaptation and development. This entails keeping abreast of financial technology advancements, allocating more resources to research intelligent technologies, and enhancing risk prevention and control management measures. Additionally, financial regulatory authorities play a crucial role in this paradigm shift. They must clarify their regulatory responsibilities and leverage AI techniques to enhance the intelligence level of regulatory automation, thereby ensuring more effective oversight and compliance.
Given that opportunities and risks coexist in this AI-driven landscape, the financial industry must embrace the potential benefits of AI while proactively addressing its drawbacks through strategic adaptation and robust safeguards.
To analyze the trends in Shibor, a specific approach was adopted due to the limited availability of data. The SV) algorithm was chosen as it is well-suited for small sample learning scenarios. This decision was prompted by the fact that Shibor has only been operational since 2007, resulting in a relatively short history of monthly data. Through a comprehensive analysis of the factors influencing call rates and conducting correlation tests, an SVR prediction model was established to forecast monthly Shibor data. Empirical evidence demonstrates that the SVR prediction model can provide reasonable and reliable predictions for overnight Shibor rates.
Limitations of the Current Study
Sample size limitation: The study acknowledges the limited availability of monthly data for Shibor, which has only been operational since 2007. This relatively short period of available data may limit the robustness and generalizability of the findings.
Dependency on the SVR algorithm: The selection of the SVR algorithm for predicting Shibor rates may have certain limitations. While SVR is suitable for small sample learning, its performance and accuracy may vary depending on the specific dataset and the chosen parameters. Alternative algorithms and methodologies could be explored to validate and compare the results.
External factors and dynamic nature: The study does not explicitly address the influence of external factors and their impact on Shibor rates. It is important to consider the dynamic nature of financial markets and the potential effects of macroeconomic indicators, policy changes, or global events on interest rates. Future research could incorporate a more comprehensive analysis of these external factors.
Generalizability: The study focuses specifically on Shibor rates, which are applicable to the Shanghai interbank market. The findings may not be directly applicable to other interbank markets or financial systems in different regions. Further research could explore the generalizability of the proposed model across different financial markets.
Future Work
Longitudinal analysis: To address the limited sample size, future research could extend the study to include a longer time frame, capturing more monthly data points. This would enhance the reliability of the predictions and enable a more comprehensive analysis of trends and patterns in Shibor rates.
Comparative analysis: Conducting a comparative analysis of different prediction models and algorithms would provide a more comprehensive understanding of their performance. This could involve exploring machine learning techniques such as neural networks, random forests, or ensemble models to compare and validate the results obtained using the SVR algorithm.
Integration of external factors: Future studies could investigate the impact of macroeconomic indicators, policy changes, and global events on Shibor rates. This would provide a more holistic understanding of the factors influencing interest rates and improve the accuracy of the prediction model.
Cross-market analysis: Extending the analysis to include other interbank markets or financial systems would enable a comparative study of interest rate dynamics across different regions. This could provide valuable insights into the similarities and differences between markets and enhance the applicability of the research findings.
Risk analysis: Considering the risks associated with AI application in finance, future work could explore the potential risks and challenges specific to the integration of AI in the prediction of interest rates. This would contribute to a more comprehensive understanding of the implications and help develop appropriate risk management strategies.
Overall, future research should aim to address the limitations of the current study while exploring new avenues for improving the accuracy, generalizability, and robustness of the prediction model.
Disclosure statement
No potential conflict of interest was reported by the author(s).
Additional information
Funding
References
- Ahmed, S., M. M. Alshater, A. E. Ammari, and H. Hammami. 2022. Artificial intelligence and machine learning in finance: A bibliometric review. Research in International Business and Finance 61 (October):101646. doi:10.1016/j.ribaf.2022.101646.
- Chen, S., W. K. Härdle, and R. A. Moro. 2011. Modeling default risk with support vector machines. Quantitative Finance 11 (1):135–2027. doi:10.1080/14697680903410015.
- Cioffi, R., M. Travaglioni, G. Piscitelli, A. Petrillo, and F. Felice. 2020. Artificial Intelligence and machine learning applications in smart production: Progress, trends, and directions. Sustain 12 (2):492. doi:10.3390/su12020492.
- Ghosh, B., and E. Kozarevic. 2018. Identifying explosive behavioral trace in the CNX nifty index: A quantum finance approach, invest. Management and Financial Innovations 15 (1):208–23. doi:10.21511/imfi.15(1).2018.18.
- Goel, S., and O. Uzuner. 2016. Do sentiments matter in fraud detection? Estimating semantic orientation of annual reports, intell. Intelligent Systems in Accounting, Finance and Management 23 (3):215–39. doi:10.1002/isaf.1392.
- Huang, S. C., T. K. Wu, and N. Y. Wang. 2017. An intelligent system for business data mining, glob. Business and Finance Review 22 (2):1–7. doi:10.17549/gbfr.2017.22.2.1.
- Jones, S., D. Johnstone, and R. Wilson. 2017. Predicting corporate bankruptcy: An evaluation of alternative statistical frameworks. Journal of Business Finance and Accounting 44 (1–2):3–34. doi:10.1111/jbfa.12218.
- Königstorfer, F., and S. Thalmann. 2020. Applications of artificial intelligence in commercial banks–A research agenda for behavioral finance. Journal of Behavioral and Experimental Finance 27:27. doi:10.1016/j.jbef.2020.100352.
- Lahmiri, S., and S. Bekiros. 2019. Can machine learning approaches predict corporate bankruptcy? Evidence from a qualitative experimental design, quant. Financ 19 (9):1569–77. doi:10.1080/14697688.2019.1588468.
- Mamoshina, P., L. Ojomoko, Y. Yanovich, A. Ostrovski, A. Botezatu, P. Prikhodko, E. Izumchenko, A. Aliper, K. Romantsov, and A. Zhebrak. 2018. Converging blockchain and next-generation artificial intelligence technologies to decentralize and accelerate biomedical research and healthcare. Oncotarget 9 (5):5665. doi:10.18632/oncotarget.22345.