
 ?Mathematical formulae have been encoded as MathML and are displayed in this HTML version using MathJax in order to improve their display. Uncheck the box to turn MathJax off. This feature requires Javascript. Click on a formula to zoom.
ABSTRACT
Addressing the pressing challenge of insurance fraud, which significantly impacts financial losses and trust within the insurance industry, this study introduces an innovative automated detection system utilizing ensemble machine learning (EML) algorithms. The approach encompasses four strategic phases: 1) Tackling data imbalance through diverse re-sampling methods (Over-sampling, Under-sampling, and Hybrid); 2) Optimizing feature selection (Filtering, Wrapping, and Embedding) to enhance model accuracy; 3) employing binary classification techniques (Bagging and Boosting) for effective fraud identification; and 4) applying explanatory model analysis (Shapley Additive Explanations, Break-down plot, and variable-importance Measure) to evaluate the influence of individual features on model performance. Our comprehensive analysis reveals that while not every re-sampling technique improves model performance, all feature selection methods markedly bolster predictive accuracy. Notably, the combination of the Gradient Boosting Machine (GBM) algorithm with NCR re-sampling and GBMVI feature selection emerges as the most effective configuration, offering superior fraud detection capabilities. This study not only advances the theoretical framework for combating insurance fraud through AI but also provides a practical blueprint for insurance companies aiming to incorporate advanced AI strategies into their fraud detection arsenals, thereby mitigating financial risks and fostering trust systems.
Introduction
The applications of machine learning (ML) in insurance companies have become increasingly popular as a result of technological advancements and the reality of big data in the insurance industry. Insurers are significantly impacted by the pervasive issue of insurance fraud. Since fraud results in significant expenses and losses for the insurance industry, it can undermine trust in the sector and disrupt insurance company economies (Benedek, Ciumas, and Zsolt Nagy Citation2022). Therefore, the detection of fraud stands as a pivotal task and essential competency within the insurance sector. If fraud were reduced, the losses incurred by the insurance would be reduced; this would boost trust in the financial system of the insurers and, directly or indirectly, reduce the premiums paid by policyholders. The insurer uses actuarial science to examine insurance data in order to carry out its essential functions. Additionally, the convergence of data science and actuarial science is essential for the survival and profitability of insurers in our contemporary epoch.
This study aims to comprehend how Ensemble machine learning (EML) algorithms can assist insurance companies in identifying trends that indicate the possibility of fraud and enhance the models accuracy. This study presents thorough research for the insurance industry, which includes the Random Forest algorithms (RF), and the Gradient Boosting Machine algorithms (GBM) for the classification task, feature selection methods for the elimination of noisy features, re-sampling methods for the treatment of the imbalance problem, and applied explainable artificial intelligence (XAI) to assess the relative weight of the input features in making the forecast.
Insurance databases frequently have numerous unrelated attributes. These unrelated attributes may have a negative impact on how accurately prediction algorithms forecast future events(Hanafy and Ming Citation2022). Therefore, applying feature selection before building ML algorithms to eliminate low-impact features seems essential. Moreover, it is clear that insurance datasets frequently include a substantial proportion of imbalanced data, and imbalanced data could considerably lower the accuracy of ML models. Consequently, it seems important to apply re-sampling methods before building ML algorithms to solve the imbalanced data issue (Hanafy and Ming Citation2021a). It is more difficult to comprehend ML models since they are frequently black-box models. Model interpretability is essential because of regulatory restrictions in many industrial applications, such as banking and insurance. We evaluated the input variables’ relative relevance using XAI techniques.
The motivation behind this study is the paramount importance of enhancing precision in detecting car insurance fraud. By doing so, it will effectively mitigate the financial losses incurred from fraudulent activities. This, in turn, will have a favorable impact on the insurance industry, policyholders, and the overall economy. Furthermore, it will aid insurance companies in anticipating fraudulent claims, which will significantly impact their revenue and the satisfaction of their customers.
Furthermore, improving the precision of identifying auto insurance fraud is crucial since it can reduce the financial losses linked to deceitful actions. This enhancement will have a beneficial effect on the insurance industry, policyholders, and the overall economy. Moreover, it will empower insurance companies to predict fraudulent claims, therefore impacting their income and improving customer satisfaction.
This study also contributes to the improvement of insurance fraud detection by proposing an innovative method to address prevalent challenges, including imbalanced datasets and overfitting. The work effectively addresses the issue of class imbalance and improves the generalization of the model in fraud detection by using approaches such as the Synthetic Minority Over-Sampling technique (SMOTE) and stacking strategy with cross-validation. This ensures a strong and reliable performance.
Furthermore, the proposed approach greatly enhances the ability to detect fraudulent activities for those involved in the insurance sector, providing them with practical benefits. By integrating the suggested model into current systems, it is possible to reduce financial losses and improve security for financial institutions and automotive insurance companies. The model’s precision improves fraud investigation procedures by optimizing resource allocation and decreasing expenses. This ultimately leads to greater fraud prevention and efficacy, reduced costs, and increased confidence in specific sectors.
Although machine learning and deep learning approaches have made great progress, along with the use of ensemble methods, there is still a need for additional improvement in predicting vehicle insurance fraud detection. Even though these strategies have demonstrated potential in several fields, the distinct attributes and difficulties linked to auto insurance fraud require the creation of innovative models specifically designed for this sector.
Ensemble approaches have demonstrated notable gains in prediction accuracy, resilience, and generalization over single models through strategies like bagging, boosting, and stacking. To fully utilize ensemble methods’ potential to improve the effectiveness and dependability of machine learning algorithms in real-world applications, further research and development must be done in this area.
Therefore, this study endeavors to bridge gaps in the current literature by integrating a multifaceted approach that combines EML algorithms with advanced feature selection, re-sampling techniques, and XAI methodologies to detect insurance claim fraud more effectively. Unlike existing studies that might focus on isolated aspects of fraud detection, our research employs a comprehensive strategy that synthesizes these elements to tackle the challenge of insurance fraud holistically. By employing RF and GBM algorithms alongside innovative re-sampling and feature selection methods, we aim to enhance both the accuracy and interpretability of fraud detection models. Furthermore, this study integrated approach allows for a more nuanced understanding of the model’s decision-making process, addressing the black-box nature of typical machine learning models. Our comparative analysis reveals that while the literature provides valuable insights into separate components of fraud detection systems, there is a paucity of research that amalgamates feature selection, re-sampling, and XAI to offer a comprehensive solution. By filling this void.
Our study aims to make substantial contributions to the existing academic literature by improving the techniques employed for identifying and detecting fraudulent actions in many ways. First and foremost, this study provides an in-depth examination of an actual program used to identify instances of insurance claim fraud. Furthermore, the study highlights the detrimental impact of unbalanced data issues and the presence of noisy, irrelevant, and/or redundant features on the accuracy of EML models. Furthermore, this study employs both local and global interpretability techniques to tackle the challenge of understanding black-box models. Additionally, this paper evaluates our findings concerning the latest state-of-the-art methodologies discussed in prior research. Regrettably, the existing literature on insurance fraud scores lacks research that integrates all the mentioned approaches (feature selection, re-sampling, and XAI methodologies) to examine a dataset and develop a classification algorithm. Moreover, this study offers practical guidance for insurance companies looking to leverage cutting-edge AI technologies in their fraud detection efforts.
The remaining research is structured as follows: A review of the literature is covered in the second section. Ensemble machine learning, feature selection, data re-sampling, and Explanatory Model Analysis, as well as statistical analysis, are presented in the third section. The results are discussed in the fourth part. The fifth section summarizes the findings and recommendations for further research.
Related Work
In modern years, the application of artificial intelligence has grown in popularity due to the increased accuracy and efficacy of prediction that artificial intelligence can provide in the insurance sector. Since one of the indispensable strategies in the insurance industry is to use hybrid models, which combine several artificial intelligence techniques (Hanafy and Ming Citation2022), the significance of this research resides in the ability to create and select models with the maximum degree of precision and efficiency.
This section focuses on reviewing significant and recent studies that applied ML techniques in the insurance industry and also tried to overcome the imbalance data. For instance, in the study of (Guoming et al. Citation2022), they put out a model for identifying health insurance fraud relying on the consortium blockchain and the explainable BERT-LE model. The studies on two real datasets demonstrate the effectiveness and explainability of the suggested strategy for preventing medical insurance fraud.
The work proposed by (Xu et al. Citation2023) introduced deep-boosting decision tree models (DBDT), an innovative method for fraud detection that combines gradient boosting with neural networks. To use the benefits of traditional approaches and deep learning, this study began by creating a soft decision tree (SDT). This model is constructed as a decision tree, with neural networks serving as its nodes. We then enhance the performance by combining many SDTs using the technique of gradient boosting. The results demonstrate that the utilization of DBDT can effectively enhance performance while still preserving a high level of interpretability.
Furthermore, the study introduced by (Hu, Quan, and Fung Chong Citation2022) proposed changing the CART tree’s conventional splitting function to overcome the imbalance issue. Finally, they look at synthetic datasets that mimic insurance losses and compare the predictive ability of modified tree-based algorithms with the conventional algorithm. The outcomes demonstrate that such adjustment produces significantly different tree architectures and enhanced prediction capabilities.
Moreover (Severino and Peng Citation2021), examined multiple ML algorithms for fraud prediction in property insurance. The findings indicated that deep neural networks and ensemble-based techniques (such as RF and GBM) produced the best outcomes, outperforming all other classifiers used in their study. Additionally, they used explainable AI techniques to quantify the influence of each attribute on the overall classification performance.
The major objective of (Seema et al. Citation2021) is to apply feature techniques to choose the important variables for claim submission. Eight classification algorithms are used to successfully complete the claim analysis for two insurance datasets. The findings show that the RF is the most effective classifier with appropriate feature selection techniques for both datasets. Similarly, the study of (Taha, Cosgrave, and McKeever Citation2022) put up a frame for enhancing predictive ML methods in the insurance industry through the choice of pertinent attributes. The experimental results highlight the significance of using feature selection to eliminate noisy features prior to executing ML models. The results show that using feature selection methods improves the ML models’ performance.
The research presented by (Gomes, Jin, and Yang Citation2021) aimed to present an innovative deep learning technique for gaining a practical understanding of an insured person’s behavior utilizing unsupervised variables of importance. It provides a framework for deriving insights into an insured person’s fraud activity. They suggest a brand-new variable significance methodology that incorporates the autoencoder and variational autoencoder, two well-known unsupervised deep learning algorithms.
The paper showcased by (Ul Hassan et al. Citation2021) presented a computational intelligence method for forecasting insurance’s healthcare expenses utilizing several ML models. This research methodology makes use of k-Nearest Neighbors, Linear Regression, Decision Trees, Random Forest Regression, Support Vector Regression, Ridge Regression, Stochastic Gradient Boosting, and Multiple Linear Regression. The findings appear that the best algorithm is the Stochastic Gradient Boosting algorithm.
The study offered by (Kaushik et al. Citation2022) trained and assessed a regression-based artificial intelligence network model to forecast health insurance premiums. The authors made predictions about people’s health insurance costs based on their characteristics. The model was developed and assessed utilizing various features, including geographic region, age, body mass index, smoking behaviors, gender, and the number of children.
The article presented by (Vijaya and Vijaya Citation2022) outlines a system for predicting customer turnover in the insurance industry utilizing meta-heuristic techniques. The selected attributes are then input into ensemble algorithms such as Boosting and Bagging. Compared to any single model, the results demonstrate that the efficiency of the Firefly technique enhanced in combination with ensemble boosting methods achieves the highest accuracy value.
The study by (Vosseler Citation2022) unveiled a Bayesian histogram-based anomaly detector (BHAD) that produced reasonable prediction outcomes. Additionally, they present a general way to algorithm explanation using a supervised surrogate algorithm.
The main aim of the study (Henckaerts et al. Citation2020) is to develop comprehensive tariff plans using ML approaches based on the frequency besides claims severity. They have compared various models, including regression trees, RF, and gradient boosting machines, with modern GLMs. The outcomes demonstrate that the boosted trees perform better than the traditional GLMs.
The paper by (Dhieb et al. Citation2019), they created an extreme gradient boosting model (aka XGBoost) based automated fraud detection method for vehicle insurance firms. The results show that XGBoost performs better than other ML algorithms (Decision Tree, Naive Bayes, and Nearest Neighbor) in identifying and categorizing fraudulent claims.
The paper introduced by (Pesantez-Narvaez, Guillen, and Alcañiz Citation2019) assessed the relative performances of the XGBoost and LR techniques for forecasting the existence of accident claims. The results demonstrated the suitability of the logistic regression model. Whereas XGBoost requires more work in terms of interpretation and various parameter-tuning processes to meet the efficiency of the LR algorithm.
The study conducted by (Dhieb et al. Citation2020) created an automated and safe insurance system architecture that minimizes human involvement, secures insurance operations, warns and educates about high-risk clients, uncovers false claims, and lowers financial loss for the insurance industry. They suggest utilizing the XGBoost and comparing its results with those of other cutting-edge algorithms (DT, SVM, and KNN). The acquired results demonstrate that the XGboost outperforms others when used on a vehicle insurance dataset.
The study proposed by (Boodhun and Jayabalan Citation2018) seeked to improve risk assessment in life insurance companies through the use of predictive analytics. Features reduction has been carried out to choose prominent features that may increase the models’ predictive ability. In order to forecast the risk level of applicants, ML models such as REPTree, Multiple Linear Regression, Random Tree, and Artificial Neural Network models were implemented on the dataset. Findings showed that the REPTree algorithm with correlation-based feature Selection achieved the best performance compared to the others.
The purpose of this work (Cinaroglu Citation2020) was to compare the performances of LR and RF algorithms with a balanced over-sampling approach in order to identify families that may experience catastrophic out-of-pocket medical expenses. The results show that the balanced oversampled data set gave accurate estimates, and that RF was more effective than the LR model.
The paper introduced by (Hanafy and Ming Citation2021b) showed how ML algorithms could be utilized with large-scale insurance data. To predict the likelihood of a claim, they utilize various ML techniques, including K-nearest neighbor, Logistic regression, RF, Decision trees, Naïve Bayes, and XGBoost. They used the over-sampling technique to address the dilemma of unbalanced data. The outcomes demonstrated that RF is superior to other techniques.
The study outlined by (Kotb and Ming Citation2021) assessed various SMOTE methods to solve the issue of unbalanced data. In order to evaluate how well the SMOTE methods performed in handling the imbalanced situation, this study used a range of ML algorithms. The results from the various assessment metrics reveal that ML algorithms struggle with imbalanced data, demonstrating the need to solve this issue. The results show that the hybrid SMOTE approaches are superior to others.
The paper showcased by (Hanafy and Ming Citation2021c), they compare thirteen ML methods using actual data. To solve the issue of unbalanced data, this paper seeks to provide a strategy that enhances the results of ML models by using different re-sampling approaches. The results of this study demonstrate how all ML algorithms become more efficient after applying re-sampling approaches.
The article introduced by (Hanafy and Ming Citation2021a) attempted to address the problem of imbalanced data in the insurance sector using a variety of data-level methodologies. They created 32 ML algorithms to predict the occurrence of insurance claims using different re-sampling algorithms. They compared the models’ performance to realize how well the algorithms performed at making predictions. The hybrid technique and the AdaBoost algorithm with over-sampling had the most precise predictions, it was discovered.
The paper proposed by (Mohamed and Omar Citation2021) showed how several regression models can forecast medical insurance costs. They also used a number of other models, including Multiple Linear Regression, deep Neural networks, SVM, RF, KNN, Generalized Additive Model, XGBoost, SGB, and CART. According to the findings, the SGB model is the most effective strategy.
The paper presented by (Hanafy and Ming Citation2022) attempted to create acceptable decision algorithms by mixing feature discretization, feature selection, data re-sampling algorithms, and binary classification. They conducted comprehensive testing on three various datasets to assess the validity of the selected algorithms. The outcomes show that after using the feature discretization methodology, feature selection techniques, and re-sampling strategies, the models perform noticeably better.
The study showcased by (Majhi Citation2021), they suggested a hybrid fraud detection approach for vehicle fraud, where a new fuzzy clustering technique is hybridized with a modified version of whale optimization. The suggested method determines how far away each data point is from the respective cluster centers, which serves as the basis for the detection of questionable classes. The suspect classifications were confirmed by the classifiers, including DT, XGBoost, LightGBM, RF, and CatBoost. It has been found that the CatBoost and XGBoost classifiers perform with higher sensitivity and accuracy than the other classifiers.
The study outlined by (Yan et al. Citation2020), the identification of vehicle insurance fraud is suggested using an Artificial Bee Colony technique-based Kernel Ridge Regression. The suggested model’s performance is assessed and contrasted on eight benchmark data sets with existing approaches. According to the experiment’s findings, the suggested model has a quicker run time and better generation performance.
The study offered by (Kate, Ravi, and Gangwar Citation2022), two approaches to data balance were suggested. At first, they suggest employing a generative adversarial network to create artificial minority class data through over-sampling. The other approach, they present a hybrid approach to tackle data imbalance by mixing the oversampled data produced by the generative adversarial network with the under sampled data produced by the OCSVM. The method’s effectiveness was shown using datasets for loan default prediction, auto insurance fraud detection, and churn prediction.
(Harjai, Khatri, and Singh Citation2019) presented a novel technique for developing a car insurance fraud detector based on ML that can foretell false insurance claims. Where SMOTE, which eliminates the dataset’s class imbalance, is used to build the proposed model. The findings demonstrate that data balancing has been a successful strategy for raising the classifier’s predicted accuracy.
The major aim of the paper of (Nian et al. Citation2016) was to suggest a technique for detecting fraud by spotting abnormal dependency relationships between feature variables. They offer a new unsupervised spectral ranking technique for anomalies. The results of an auto insurance claim data set show that their proposed SRA greatly outperforms current outlier-based fraud detection techniques.
The study introduced by (Sundarkumar and Ravi Citation2015), the authors suggest a novel hybrid technique that combines the one-class support vector machine (OCSVM)and the k Reverse Nearest Neighborhood to solve the issue of data imbalance. To show the usefulness of the suggested model, they used two datasets: one for consumer Credit Card Churn prediction and the other for auto insurance fraud detection. The Group Method of Data Handling, Support vector machine, Decision Tree, Multi-Layer Perceptron, Probabilistic Neural Network, and LR were all employed throughout the article. On the insurance and credit card churn prediction datasets, they saw that Decision tree and SVM, respectively, produced the highest sensitivity.
The study presented by (Sundarkumar, Ganesh, and Siddeshwar Citation2016), the minority class was combined with support vectors that were recovered from the majority class by utilizing the OCSVM to create new, balanced training data. The datasets for credit card customer churn and automobile insurance demonstrate that OCSVM-based under sampling enhances classifier performance.
Similarly, the research presented by (Salmi and Atif Citation2022) discusses a data mining strategy to identify false claims. They used RF and Logistic Regression together with two sampling techniques, SMOTE and ROSE to solve the imbalanced data problem and experimented with two distinct feature subsets. The outcomes showed that the algorithms created utilizing the second feature selection work somewhat better; moreover, statistically, the difference between SMOTE and ROSE is negligible.
Additionally (Hassan and Abraham Citation2016), suggested a new insurance fraud recognition method. The concept was built on developing Artificial neural network, DT, and SVM algorithms for detecting fraud based on the under-sampling of the majority class to deal with the unbalanced distribution of data. According to the results, DT performs better than other models.
Moreover (Li et al. Citation2018), suggested an algorithm Based on the RF, PCA, and Potential Nearest Neighbor approaches. The proposed approach is used to identify fraudulent auto insurance claims. The findings of the experiments demonstrate that the suggested strategy leads to higher classification accuracy and a reduced variance.
Furthermore (Kumar et al. Citation2019), introduced a fuzzy clustering approach to perform under sampling. After under sampling, the balanced dataset for auto fraud detection is subjected to classification. These Classifiers include the RF, Logistic Regression, and XGBoost. The findings show that the proposed fuzzy clustering technique, along with XGBoost, generates the best classification performance.
(Aslam et al. Citation2022) proposed a method for fraud recognition utilizing predictive algorithms in the automobile insurance industry. They used the Boruta model to choose the most important features. Three prediction algorithms (LR, SVM, and NB) are used. According to the results, the SVM achieved the highest accuracy score while the LR obtained the highest f-measure value.
The paper introduced by (Yankol-Schalck Citation2022), A neural network and a GBM were utilized to determine the fraud score. The local interpretable model-agnostic explanations are used to interpret the results. Additionally, they found that the GBM methodology outperforms the other strategy.
(Abakarim, Lahby, and Attioui Citation2023) introduced an innovative approach to address the challenge of imbalanced data through the utilization of analysis-based techniques. The study incorporates three pre-trained Convolutional Neural Network (CNN) models, namely AlexNet, InceptionV3, and Resnet101, which undergo a streamlined process by removing redundant layers. These CNN models are subsequently integrated in parallel with a novel 1D CNN model using Bagged Ensemble Learning, facilitating an effective solution for imbalanced data classification. In this approach, SVM classifier is utilized to extract individual predictions from each CNN model (Maiano et al. Citation2023). introduced a new method to deal with imbalanced data by employing the over-sampling method and the proposed model is based on the XGBoost algorithm to improve fraud detection efficiency (Xu et al. Citation2023). introduced a new method called deep boosting decision trees (DBDT) for vehicle fraud detection. This methodology combines gradient boosting and neural networks. To harness the benefits of both traditional approaches and deep learning.
provides a comprehensive summary of the latest research on AI techniques in the insurance sector. It is evident from the table that none of these studies reviewed have employed all the mentioned methods (such as feature selection, re-sampling, classification, and Explanatory model analysis) simultaneously in processing a dataset and developing a classification algorithm. Previous works have been found to lack one or more of these crucial components. As a result, our study proposes a novel strategy to fill this gap and address the limitations identified in the existing literature.
Table 1. Review of AI research projects used in the insurance industry.
Materials and Methods
This section presents the dataset as well as the model that has been developed.
Data
The dataset is given by Angoss Knowledge-Seeker Software Caruana and Grech Citation2021 and includes 15,420 samples, and only 923 of them are fraud. After deleting the id attribute, this dataset has 32 attributes. It gives broad information on insurance claims and their owners, such as personal information about the insured, vehicle information, insurance policy information, and accident data. The aim is to determine whether or not a claim application is fraudulent; describes the dataset. Many models need all predictor variables to be numeric. As a result, we convert all categorical variables into numeric representations using label encoding, which is a pure numeric conversion of a categorical variable’s levels by assigning them integer values.
Table 2. Attribute information of the insurance data.
Ensemble Machine Learning (EML)
The idea behind EML is to train multiple individual models and then combine their results to improve the algorithm’s performance. EML methods typically outperform individual models. In the context of EML, Individual models whose results are to be combined are referred to as base learners. Ensemble methods, including bagging and boosting. When boosting and bagging are being compared, there are some main differences, as shows.
Table 3. Principal distinctions between bagging and boosting.
Bagging
Bagging is an ensemble learning method proposed by (Breiman Citation1996). It stands for “bootstrap aggregation.” This method is based on training multiple base learners (for example, decision trees) and combining their outputs to produce a single final prediction. Bagging is a technique that trains multiple sub-models in parallel on training set bootstrap samples. Each sub-model then votes on the prediction for new cases. The RF can be considered as a Bagging extension. “Random Forests,” which, as the name suggests, adds more randomness to the individual trees. This model combines a number of decision trees that were built using a randomly selected subset of the training data. In the case of the classification task, the majority of the predictions made by each decision tree in the forest are combined to create the final prediction (Cutler, Cutler, and John Citation2012).
In the RF Algorithm, each tree is developed by repeatedly choosing random features from training sets made up of bootstrap samples from the original data and then generating two daughter nodes at the feature that offers the best split. Nodes continue partitioning until a stopping requirement is satisfied. Each tree ultimately offers a classifier that is tree structured. The majority vote of every individual tree classifier is combined to form the RF classifier. in particular,
Boosting
Boosting is another popular EML that enhances weak learners’ performance to a stronger level. In boosting, the final prediction is decided by a vote among ensembles of models that have been trained on resampled data. In boosting, the resampled datasets are first created specifically to produce complementary learners. Second, rather than providing every learner an equal vote, boosting provides each learner’s vote with a weight based on their prior performance. The final prediction made by the ensemble is more influenced by models with better performance (Anurag et al. Citation2022; Oyedele et al. Citation2021).
Gradient Boosted Machine (GBM) is one example of a boosted tree algorithm (Friedman Citation2001). GBM is performed by iteratively creating a collection of functions ,
, … ,
from a loss function
(
,
). If function
has been created, we can improve our estimations of
by finding a different function
=
+
, which
decreases the estimated value of the loss function. Thus,
Where stands for the group of potential decision trees that the ensemble is considering. A further benefit of the definition of
is that it allows us to describe the expected value of the loss function
:
A reasonable approximation of the that minimizes
+
can be found by observing the direction in which the gradient of
with respect to
is falling the fastest. These circumstances allow us to estimate
as:
Because it uses the partial derivatives (such as gradients) of the loss function with respect to the function
to calculate
, this method is referred recognized as the original idea of GBM.
Feature Selection
In classification tasks, multidimensionality, known as the “dimensional curse,” is one of the fundamental problems. It is a serious barrier to reducing classification algorithm accuracy (Chizi and Maimon Citation2009). Feature selection techniques are utilized to lower the dimension of a dataset by removing irrelevant or unnecessary features. Filter methods, wrapper strategies, and embedded approaches are the three main categories of the feature selection (Solorio-Fernández, Carrasco-Ochoa, and Martínez-Trinidad Citation2020), as depicted in .
Figure 1. The techniques for selecting filters, wrappers, and embedded features.
Filter Methods
Filter techniques are used without any predictive algorithms. Instead of using ML algorithms, they select features based on general feature characteristics like variance, consistency, correlation, and information. They are frequently utilized as they are quick, applicable, and scalable to high-dimensional data and can handle larger amounts of data. These methods’ univariate nature is a common drawback where interactions between features are not considered when calculating feature scores. The Chi-squared test (Uysal and Gunal Citation2012) and the Relief algorithm (Solorio-Fernández, Carrasco-Ochoa, and Martínez-Trinidad Citation2020) are some examples of filtering algorithms that were used in our study.
Wrapper Methods
Wrapper approaches utilize a predetermined learning algorithm to select the optimum subgroups of characteristics that increase classification algorithms accuracy (Arai et al. Citation2016; Guo and Zhu Citation2018). Their computation takes a long time. The exhaustive search Algorithm, Hill climbing search algorithm, and recursive feature elimination are some examples of wrapper algorithms that were used in our study.
Embedded and Hybrid Methods
Embedded methods: are created by combining the filter method and wrapper strategy. Algorithms carry it out with internal feature selection mechanisms based on feature importance. It is less prone to overfitting and less computationally expensive than the wrapper method (Wang, Tang, and Liu Citation2015; Ang et al. Citation2016) tree- Based algorithms are frequently used in embedded methods. In this study, we used embedded algorithms with variable importance of GBM and RF models.
Hybrid methods: are suggested in order to combine the best qualities of filters and wrappers. The feature space dimension space is first reduced using a filter method, potentially yielding several candidate subsets. Following that, a wrapper is used to identify the ideal candidate subset. A hybrid approach can be created using almost any filter and wrapper combination, but a number of intriguing methodologies have recently been suggested, including a hybrid genetic algorithm (Il-Seok Oh, Jin-Seon Lee, and Byung-Ro Moon 2004; Li et al. Citation2017), which we used in this study.
shows the techniques for selecting filters, wrappers, and embedded features. Filtering techniques carry out feature selection regardless of classification model creation. Wrapper techniques use the classification model’s prediction accuracy to iteratively choose or reject a set of features. In embedded techniques, feature selection is a crucial component of the classification model.
Re-Sampling Techniques
In binary classification, when classes of the target variable are imbalanced, ML algorithms typically create algorithms that tend to assign all classes to the dominant class. While the minority class, which is frequently of utmost importance, will suffer from low accuracy Due to their underrepresentation in the training set (Hanafy and Ming Citation2022). Thus, re-sampling techniques come to address the imbalanced data dilemma. There are three major categories of re-sampling methods: under-sampling, over-sampling, and combining both under-sampling and over-sampling, as illustrated in .
Figure 2. The illustration of over-sampling, under sampling, and hybrids techniques.
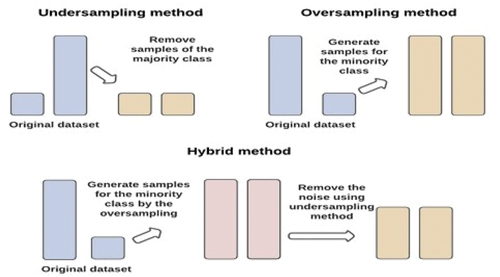
Under-Sampling Methods
The under-sampling methods are used to remove observations from the majority class to balance the datasets. One benefit of this method is that it lowers the cost of the learning phase. One drawback of under-sampling techniques is removing a sizable portion of the training set; this can result in the loss of significant cases, which could make classification and prediction challenging. In this study, we applied Random Under-Sampling (Batista, Prati, and Carolina Monard Citation2004), Condensed Nearest Neighbour (Gowda and Krishna Citation1979), Edited Nearest Neighbor (Wilson Citation1972), Neighbourhood Cleaning Rule (Laurikkala Citation2001), One Side Selection (Kubat and Matwin Citation1997), and Tomek Link as under-sampling methods.
Over-Sampling Methods
In contrast to under sampling, over-sampling methods are being developed to address the problem of an unbalanced training set by replicating the minority class instances. The main drawback of the over-sampling technique is that it increases the likelihood of overfitting by producing observations of existing samples that are strikingly similar. Furthermore, when the minority class is oversampled, the ML models tend to learn too much from the specifics of the few cases, which prevents them from generalizing well. The second drawback of over-sampling is that it lengthens learning times by increasing the number of training observations. In this study, we applied Random Over-Sampling (Batista, Prati, and Carolina Monard Citation2004), Synthetic Minority Over-sampling Technique (Chawla et al. Citation2002), and Adaptive Synthetic Sampling Approach (He et al. Citation2008) as over-sampling methods.
Hybrid Methods
The hybrid sampling technique combines sampling and over-sampling methods simultaneously. As previously indicated, over- or under-sampling approaches can be utilized to address the issue of class imbalance. Nevertheless, there are drawbacks to both over-sampling and under sampling. Under-sampling techniques have the primary drawback of losing potentially usable data that could be crucial for prediction, while over-sampling techniques can increase the danger of overfitting. This study applied SMOTE-ENN and SMOTE-Tomek as hybrid re-sampling methods. The process of the hybrid sampling technique includes two steps: first, using SMOTE, and then finishing under sampling on the majority of class samples to coalesce their advantages (Batista, Prati, and Carolina Monard Citation2004).
Model Explanation
For humans to trust AI systems, models must be understood by users. AI interpretability sheds light on what is happening inside these systems. Model Explanation offers a generic structure for revealing black boxes and describing “why” AI-generated predictions. In the literature, a number of methodologies have been put forth to deal with the results and ML models’ explainability and interpretability. We will employ both a “local” and a “global” approach. While global explainability concentrates on all records, local explainability facilitates comprehension of the model’s decision-making for a particular sample. For a thorough analysis of our model, we used both types of explainability, and their specifics are presented below in more detail.
Local Approach
A local approach is a study of how the classifier responds to minor changes in the features of the observation. It helps to understand the explanatory factors that impact a model’s prediction for a single observation. In this study, for this purpose, we will use Break-Down (BD) plot for additive attributions. When attempting to comprehend a model’s prediction for a single observation, the question of “which variables contribute to this result the most?” is probably the one that comes up most frequently. To answer this question, there isn’t a single best method that can be applied. The (BD) plots can be used to display “variable attributions,” which is the decomposition of the prediction made by the model into contributions that can be attributed to various explanatory variables. It should be noted that this approach is akin to the EXPLAIN algorithm, which was introduced by (Robnik-Sikonja and Kononenko Citation2008).
Global Interpretation
By “global approach,” we mean that we train a straightforward algorithm that makes sense for the model’s predictions. To understand how the algorithm operates, we must connect the features of the observation to the model’s estimated output.
For the global approach, we will use the concepts of Shapley Additive Explanations and variable importance.
Shapley Additive Explanations (SHAP): According to (Lundberg and Lee 2017), the SHAP technique enables us to quantify the influence of various variables and features on the results of ML classifiers. This approach took inspiration from cooperative game theory, which involves calculating the SHAP value, which serves as a gauge of a feature’s significance. More specifically, a feature’s SHAP value assesses how much it influences the classifier’s prediction positively or negatively. The SHAP method seeks to explain a prediction by estimating every feature’s influence on the prediction itself.
Variable Importance: It produces a ranking of the features’ relative importance in order to determine which variables are crucial for making predictions. Starting with the most significant variable, the variables are ranked from top to bottom.
Statistical Analysis
In this study, we used the area under the receiver operating characteristic curve (AUROC) and the area under the precision-recall curve to assess the effectiveness of EML algorithms (AUPRC). The quantitative characteristics of binary classifiers derived from such models and represented graphically using various cutoff points are called the ROC curves, which show how False Positive Rate (FPR) and True Positive Rate (TPR) are linked. The FPR and TPR could be computed by Calculations 5,6, respectively (Bradley Citation1997).
Where TP stands for true positives, and FN indicates false negatives. Besides, FP indicates “false positives,” which indicates that the algorithm incorrectly predicted the positive class, and TN indicates “true negatives,” which indicates that the algorithm correctly predicted the negative class.
The AUROC area is below the ROC curve; it is determined by calculating the probability thresholds for the eventuality that an object belongs to the positive or negative class.
The Precision-Recall Curve (PRC) for the classifier illustrates the relationship between precision (Positive Predictive Value – PPV) and recall (TPR) (Boyd, Eng, and Page Citation2013). Equation (7) calculates the PPV as follows:
The AUPRC calculates a model’s accuracy in predicting an outcome by comparing positive predictive values (also known as precision) to true positive rates (also known as recall) (Davis and Goadrich Citation2006). PRCs frequently have oscillating zigzag curves. As a result, they frequently cross over more than ROCs. For a comprehensive overview when evaluating and comparing classifier models, PRCs are advised in addition to ROCs (Saito, Marc, and Brock Citation2015). In particular, when dealing with uncommon case outcomes (such as insurance fraud), the AUPRC’s expected value of a random classifier tends to be close to zero, while the AUROC’s tends to have an expected value of 0.5 (Ozenne, Subtil, and Maucort-Boulch Citation2015).
System Overview
Datasets need to be divided into training, validation, and test subsets for ML algorithms to measure their performance. The split ratio for the dataset’s training, validation, and test categories was 70%:15%:15%. The training set (which made up 70% of the data) was used for training the model; the validation set (15%), was used to test models and fine-tune hyperparameters., and the test set (15%) was assessing the effectiveness of the algorithms. We must choose the ideal set of hyperparameters for the algorithm. To achieve this, we run a grid-search pipeline for each algorithm to determine the optimally performing hyperparameters with 10-fold cross-validation to guarantee better prediction outcomes. We choose the best set of hyper-parameters based on the best AUROC. describes each model’s hyperparameter settings.
Table 4. Search Grid for the Tuning Parameters of RF and GBM.
In our study, we have suggested a new data pipeline to identify fraudulent insurance claims, the techniques used in our study are listed in . The main aim of the study is to discover the following.
The impact of the feature selection techniques on EML classification algorithms.
The impact of the re-sampling techniques on EML classification algorithms.
The impact of combining re-sampling methods and feature selection on EML classification algorithms.
Offer a general framework for opening black boxes and elucidating the “why” behind predictions made by AI.
Compare our results to the most recent cutting-edge techniques outlined in the previous studies.
Table 5. The selected techniques in our proposed approach.
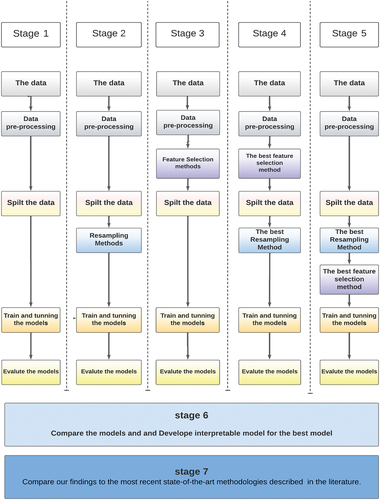
Our study consists of several stages to reach the best model.
We applied the ML models without the feature selection methods and re-sampling methods.
We applied 11 Re-sampling methods (3 over + 6 under + 2 hybrids), then we applied ML models.
We applied 7 feature selection methods (2 filter + 2 wrapping + 3 embedded), then we applied ML models.
Combining the best re-sampling method in scenario 2 with the best feature selection method in scenario three into one model and applying this hybrid to the best ML model (here, we applied the resembling first and then the feature selection)
Combining the best feature selection method in scenario 2 with the best Re-sampling method in scenario three into one model and applying this hybrid to the best ML model (here, we applied the feature selection first and then the re-sampling method)
Applied explainable Artificial Intelligence (XAI) methods (BD, SHAP, and feature importance) with the best model.
Compare our results to the most recent cutting-edge techniques outlined in the previous studies.
summarizes the procedures used in this study to identify fraud. It must be noted that feature selection methods were applied to the whole data set to ensure complete uniformity between the train, validation, and test sets. In addition, the re-sampling techniques were the sole processing technique utilized on only train set.
Figure 3. System overview.
Results and Discussion
We present our results in a comprehensive manner, outlining the findings through the following stages of analysis:
The First Stage: Algorithm Comparison
The first stage offers a preliminary evaluation of the performance of each EML algorithm. These algorithms are GBM and RF. In the first stage, GBM achieves the highest values, while the RF achieves the lowest values concerning both AUROC and AUROC values.
The Second Stage: Re-Sampling Techniques
The second stage shows the results of integrating the EML with 11 re-sampling technique types. From , it is clear that not all re-sampling methods cause the algorithms’ performance to be improved since some of the re-sampling methods lead to a decrease in performance, wherewith regard to AUROC and AURPC values, as follows:
The logarithm GBM has decreased its performance after applying SMOTE, ADYSON, RUS, SMOTE+TOMAK, and SMOTE+ENN.
The logarithm RF has decreased its performance after applying ADYSON, RUS, ENN, and SMOTE+ENN.
Table 6. The classification results from each research stage.
On the other hand, some re-sampling methods have improved the performance of logarithms Where concerning AUROC and AURPC values as follows:
The performance of GBM has improved after applying ENN, TOMEK, OSS, NCR, and CNN.
The performance of RF has improved after applying ROS, SMOTE, TOMEK, OSS, NCR, CNN, and SMOTE-TOMAK.
By comparing all the models in the second scenario, we find that:
The best performance of the GBM in the second scenario is with the NCR, with AUROC and AUPRC values of 0.8454135 and 0.2736956, respectively.
The best performance of the RF in the second scenario is with the ROS with AUROC and AUPRC values of 0.8347012 and 0.255262, respectively.
Therefore, the chosen algorithm from the second stage is the GBM with the NCR.
The Third Stage: Feature Selection Technique
The third stage shows the results when integrating the EML with seven feature selection techniques. In the third Stage, it is clear that all feature selection methods cause the algorithms’ performance to be improved. By comparing all the models in the third scenario, we find that:
The best performance of the GBM in the third scenario is with the GBMVI with values of AUROC and AURPC 0.847519 and 0.2870593, respectively.
The best performance of the RF in the Third scenario is with the HCS, with values of AUROC and AURPC 0.8415633 and 0.2500911, respectively.
Therefore, the chosen algorithm from the third stage is the GBM with the GBMVI as it is the best model in the third stage.
The Fourth and Fifth Stages: Combining the Best Two Models from Stage 2 and Stage 3
From , it is obvious that the top model in the second stage is GBM +NCR and that the best model in the third stage is GBM + GBMVI.Therefore, NCR as the under-sampling method and GBMVI as the feature selection method are combined to see if this will improve the performance of GBM or not.
In the fourth stage, the merger takes place based on applying the best feature selection method (GBMVI) first and then applying the best re-sampling method (NCR).
In the fifth stage, the merger takes place based on applying the best re-sampling method (NCR) first and then applying the best feature selection method (GBMVI).
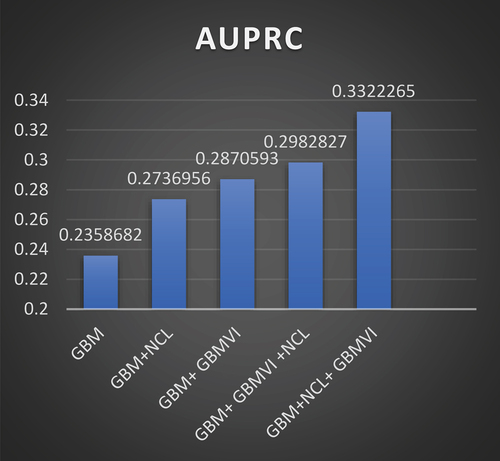
By comparing the logarithm in the fourth stage with the logarithm in the fifth stage, we find that the best algorithm’s performance is in the fifth stage, with values of AUROC and AURPC 0.8954822 and 0.3322265, respectively.
indicates that the performance of the GBM algorithm outperforms the RF algorithm, either in the first, second, or third stages. Therefore, we used GBM to make the optimal combination in the fourth and fifth stages. show how the GBM model performs through the five stages, and these figures show that the best performance for the GBM model is with the fifth stage.
Figure 4. The performance of the GBM model through the five stages based on the AUROC values.
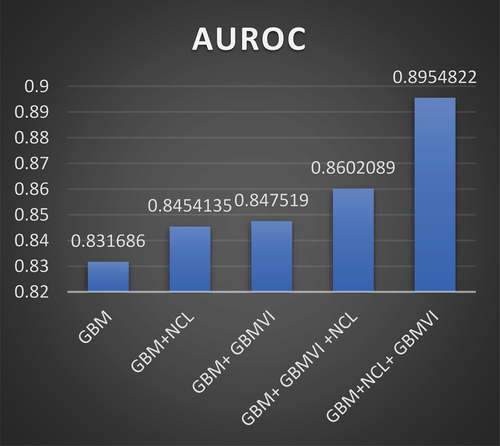
Figure 5. The performance of the GBM model through the five stages based on the AUPRC values.
Sixth Stage: Explainable Artificial Intelligence (XAI) Methods
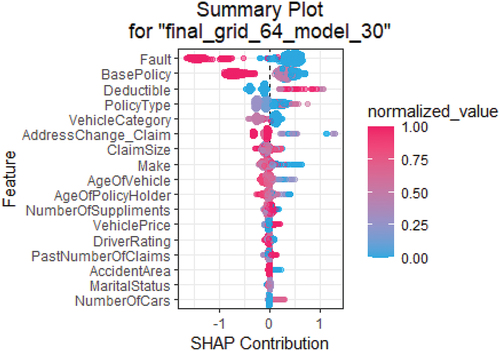
At this step, we used the SHAP values, which increase model transparency, and often give a wider picture of our best model, where the positive and negative relationships between the predictor and the target variables are interpreted from the SHAP value plot.
The information that can be drawn from the above plot is as follows:
In our investigation, the axis’ horizontal location of the points represents the probability of fraud. The more to the right (with positive values), the more likely someone will commit fraud. Moreover, the probability decreases more to the left (negative values).
For example, gives us the following details for the fault variable:
The dots’ color indicates the variable’s numerical value. In the case of the Fault variable, the red color represents the third party, and the blue color represents the policyholder.
The magnitude of contributions or the different variables to predict fraud is represented by the color from high (red) to low (blue).
Correlation: A high level of “fault” (third party) content has a high and negative impact on the fraud rating. The “high” comes from the red color, and the “negative” impact is shown on the X-axis.
From the SHAP summary plot, it can be observed that when fault is assigned to the third party (as indicated by the red dots), the likelihood of fraud tends to be lower than in cases where the policyholder is at fault (as indicated by the blue dots).
The remaining variables can be subjected to the same analysis.
Figure 6. SHAP plot of the GBM+NCR+ GBMVI algorithm.
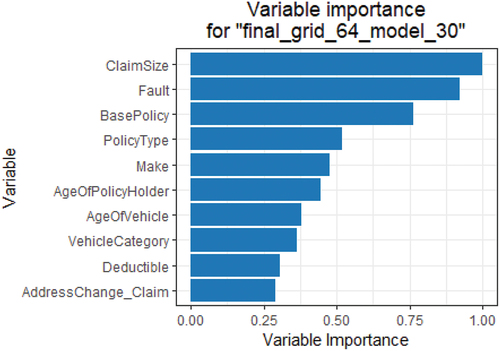
illustrates the significance of the variables by providing a list of the variables ranked. The factors near the top of the plot have a greater impact on the model than those at the bottom.
Figure 7. variable importance for the GBM+NCR+ GBMVI model.
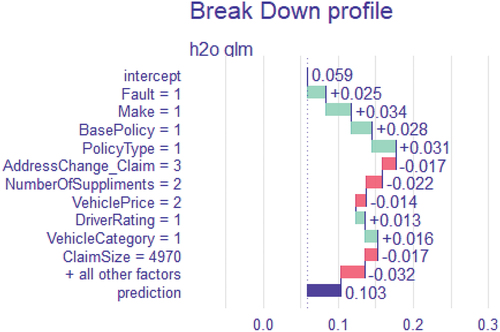
: Break-down plot illustrating how different explanatory variable contributions alter the mean algorithm’s forecast to produce the actual prediction for a specific individual observation (case# 7990 from the testing dataset). The distribution and mean value of the predictions are displayed in the following rows: The prediction for the specific case of interest is displayed in the last row. Positive and negative changes in the mean predictions are shown, respectively, by the green and red bars (contributions attributed to explanatory variables). Red bars represent a negative contribution, whereas green bars represent a positive contribution.
Figure 8. Break-down plot for insured case 7990.
The Seventh Stage: Comparison of Our Findings with Previous Works
After thorough consideration of 40 models, the GBM model combined with NCR as a re-sampling method and with GBMVI as a feature selection method is the best-proposed model. compares the proposed model to earlier publications that used the same dataset and similar techniques.
Table 7. Compare our results to the most recent cutting-edge techniques outlined in the previous studies.
Conclusions and Future Work
This study contributes valuable insights into the optimization of fraud detection methodologies within the insurance sector. Through rigorous comparative analysis, we have demonstrated that not all re-sampling methods universally enhance model performance. However, the strategic application of feature selection methods uniformly improves detection accuracy. The combination of GBM with NCR re-sampling and GBMVI feature selection was identified as the most potent model configuration, offering a robust approach to fraud detection that surpasses existing models.
Key Findings
The differential impact of re-sampling techniques on model performance highlights the importance of tailored data preprocessing strategies.
The universal improvement in performance across all models with the application of feature selection techniques indicates the significance of precise feature curation.
Implications for Practice
Our study equips insurance companies with evidence-based insights for refining their fraud detection systems, presenting the GBM+NCR+GBMVI model as an advanced solution for navigating the complexities of insurance fraud.
Limitations and Future Directions
While promising, our findings are contingent on the specific dataset utilized, pointing to the need for further validation across diverse contexts. Future research avenues include:
Developing multi-objective models that balance accuracy and false negative minimization.
Expanding dataset diversity to ensure the robustness and applicability of our findings.
Quantification of Trust in Predictions: An important direction for future research is the development of methodologies to quantify trust in model predictions.
By further advancing the intersection of machine learning and fraud detection, we can significantly contribute to the resilience and integrity of the insurance sector against fraudulent activities.
Disclosure Statement
No potential conflict of interest was reported by the author(s).
Additional information
Funding
References
- Abakarim, Y., M. Lahby, and A. Attioui. 2023. A bagged ensemble convolutional neural networks approach to recognize insurance claim frauds. Applied System Innovation 6 (1):20. doi:10.3390/asi6010020
- Ang, J. C., A. Mirzal, H. Haron, and H. Nuzly Abdull Hamed. 2016. Supervised, unsupervised, and semi-supervised feature selection: A review on gene selection. IEEE/ACM Transactions on Computational Biology and Bioinformatics 13 (5):971–34. doi:10.1109/TCBB.2015.2478454
- Anurag, M., M. Kaur Saggi, S. Rehman, H. Sajjad, S. Inyurt, A. Singh Bhatia, A. Ahsan Farooque, A. Y. Oudah, and Z. Mundher Yaseen. 2022. Deep learning versus gradient boosting machine for pan evaporation prediction. Engineering Applications of Computational Fluid Mechanics 16 (1):570–87. doi:10.1080/19942060.2022.2027273
- Arai, H., C. Maung, K. Xu, and H. Schweitzer. 2016. Unsupervised feature selection by heuristic search with provable bounds on suboptimality. Proceedings of the AAAI Conference on Artificial Intelligence 30 (1). doi:10.1609/aaai.v30i1.10082
- Aslam, F., A. Imran, Z. Ftiti, W. Louhichi, and T. Shams. 2022. Research in international business and finance insurance fraud detection: evidence from artificial intelligence and machine learning. Research in International Business and Finance 62 (August):101744. doi:10.1016/j.ribaf.2022.101744
- Azzone, M., E. Barucci, G. Giuffra Moncayo, and D. Marazzina. 2022. A machine learning model for lapse prediction in life insurance contracts. Expert Systems with Applications 191 (April 2021):116261. doi:10.1016/j.eswa.2021.116261
- Batista, G. E. A. P. A., R. C. Prati, and M. Carolina Monard. 2004. A study of the behavior of several methods for balancing machine learning training data. ACM SIGKDD Explorations Newsletter 6 (1):20–29. doi:10.1145/1007730.1007735
- Benedek, B., C. Ciumas, and B. Zsolt Nagy. 2022. Automobile insurance fraud detection in the age of big data – A systematic and comprehensive literature review. Journal of Financial Regulation & Compliance 30 (4):503–23. doi:10.1108/JFRC-11-2021-0102
- Boodhun, N., and M. Jayabalan. 2018. Risk prediction in life insurance industry using supervised learning algorithms. Complex & Intelligent Systems 4 (2):145–54. doi:10.1007/s40747-018-0072-1
- Boyd, K., K. H. Eng, and C. D. Page. 2013. Erratum: Area under the Precision-Recall Curve: Point Estimates and Confidence Intervals. In Machine Learning and Knowledge Discovery in Databases. ECML PKDD 2013. Lecture Notes in Computer Science, ed. H. Blockeel, K. Kersting, S. Nijssen, and F. Železný, vol. 8190. Berlin, Heidelberg: Springer. doi:10.1007/978-3-642-40994-3_55
- Bradley, A. P. 1997. The use of the area under the ROC curve in the evaluation of machine learning algorithms. Pattern Recognition 30 (7):1145–59. doi:10.1016/S0031-3203(96)00142-2
- Breiman, L. 1996. Bagging predictors. Machine Learning 24 (2):123–40. doi:10.1007/BF00058655
- Caruana, M. A., and L. Grech. 2021. Automobile insurance fraud detection. Communications in Statistics Case Studies, Data Analysis and Applications 7 (4):520–35. doi:10.1080/23737484.2021.1986169
- Chawla, N. V., K. W. Bowyer, L. O. Hall, and W. P. Kegelmeyer. 2002. SMOTE: Synthetic minority over-sampling technique. Journal of Artificial Intelligence Research 16:321–57. doi:10.1613/jair.953
- Chizi, B., and O. Maimon. 2009. Dimension reduction and feature selection. In Data mining and knowledge discovery handbook, 83–100. Boston, MA: Springer US. doi:10.1007/978-0-387-09823-4_5
- Cinaroglu, S. 2020. Modelling unbalanced catastrophic health expenditure data by using machine-learning methods. Intelligent Systems in Accounting, Finance and Management 27 (4):168–81. doi:10.1002/isaf.1483
- Cutler, A., D. R. Cutler, and R. S. John. 2012. Random forests. In Ensemble machine learning, 157–75. Boston, MA: Springer US. doi:10.1007/978-1-4419-9326-7_5
- Davis, J., and M. Goadrich. 2006. The relationship between precision-recall and ROC curves. In Proceedings of the 23rd international conference on Machine learning - ICML ’06, New York, New York, USA, 233–40. ACM Press.
- Dhieb, N., H. Ghazzai, H. Besbes, and Y. Massoud. 2019. Extreme gradient boosting machine learning algorithm for safe auto insurance operations. In 2019 IEEE International Conference on Vehicular Electronics and Safety, ICVES 2019, 1–5. doi: 10.1109/ICVES.2019.8906396
- Dhieb, N., H. Ghazzai, H. Besbes, and Y. Massoud. 2020. A secure AI-Driven architecture for automated insurance systems: Fraud detection and risk measurement. IEEE Access 8:58546–58. doi:10.1109/ACCESS.2020.2983300
- Farquad, M. A. H., V. Ravi, and S. Bapi Raju. 2012. Analytical CRM in banking and finance using SVM: A modified active learning-based rule extraction approach. International Journal of Electronic Customer Relationship Management 6 (1):48. doi:10.1504/IJECRM.2012.046470
- Friedman, J. H. 2001. Greedy function approximation: A gradient boosting machine. The Annals of Statistics 29 (5):1189–232. doi:10.1214/aos/1013203451
- Gomes, C., Z. Jin, and H. Yang. 2021. Insurance fraud detection with unsupervised deep learning. Journal of Risk and Insurance 88 (3):591–624. doi:10.1111/jori.12359
- Gowda, K., and G. Krishna. 1979. The condensed nearest neighbor rule using the concept of mutual nearest neighborhood (Corresp.). IEEE Transactions on Information Theory 25 (4):488–90. doi:10.1109/TIT.1979.1056066
- Guoming, Z., X. Zhang, M. Bilal, W. Dou, X. Xu, and J. J. P. C. Rodrigues. 2022. Identifying fraud in medical insurance based on blockchain and deep learning. Future Generation Computer Systems 130:140–54. doi:10.1016/j.future.2021.12.006
- Guo, J., and W. Zhu. 2018. Dependence guided unsupervised feature selection. Proceedings of the AAAI Conference on Artificial Intelligence 32 (1). doi:10.1609/aaai.v32i1.11904
- Hanafy, M., and R. Ming. 2021a. Improving imbalanced data classification in auto insurance by the data level approaches. International Journal of Advanced Computer Science and Applications 12 (6):493–99. doi:10.14569/IJACSA.2021.0120656
- Hanafy, M., and R. Ming. 2021b. Machine learning approaches for auto insurance big data. Risks 9 (2):1–23. doi:10.3390/risks9020042
- Hanafy, M., and R. Ming. 2021c. Using machine learning models to compare various resampling methods in predicting insurance fraud. Journal of Theoretical and Applied Information Technology 99 (12):2819–33.
- Hanafy, M., and R. Ming. 2022. Classification of the insureds using integrated machine learning algorithms: a comparative study. Applied Artificial Intelligence 36 (1). doi: 10.1080/08839514.2021.2020489
- Harjai, S., S. Kumar Khatri, and G. Singh. 2019. Detecting fraudulent insurance claims using random forests and synthetic minority oversampling technique. In 2019 4th International Conference on Information Systems and Computer Networks, ISCON 2019, 123–28. doi: 10.1109/ISCON47742.2019.9036162
- Hassan, A. K. I., and A. Abraham. 2016. Modeling insurance fraud detection using imbalanced data classification. Advances in Intelligent Systems & Computing 419:117–27. doi:10.1007/978-3-319-27400-3_11
- He, H., Y. Bai, E. A. Garcia, and S. Li. 2008. ADASYN: Adaptive synthetic sampling approach for imbalanced learning. In 2008 IEEE International Joint Conference on Neural Networks (IEEE World Congress on Computational Intelligence), 1322–28. IEEE. doi:10.1109/IJCNN.2008.4633969
- Henckaerts, R., M. Pier Côté, K. Antonio, and R. Verbelen. 2020. Boosting insights in insurance tariff plans with tree-based machine learning methods. North American Actuarial Journal 25 (2):1–31. doi:10.1080/10920277.2020.1745656
- Hu, C., Z. Quan, and W. Fung Chong. 2022. Imbalanced learning for insurance using modified loss functions in tree-based models. Insurance: Mathematics and Economics 106:13–32. doi:10.1016/j.insmatheco.2022.04.010
- Kate, P., V. Ravi, and A. Gangwar. 2022. FinGAN: Chaotic generative adversarial network for analytical customer relationship management in banking and insurance. Neural Computing and Applications 35 (8):6015–28. doi:10.1007/s00521-022-07968-x
- Kaushik, K., A. Bhardwaj, A. Dhar Dwivedi, and R. Singh. 2022. Machine learning-based regression framework to predict health insurance premiums. International Journal of Environmental Research Public Health 19 (13):7898. doi:10.3390/ijerph19137898
- Kotb, M. H., and R. Ming. 2021. Comparing SMOTE family techniques in predicting insurance premium defaulting using machine learning models. International Journal of Advanced Computer Science and Applications 12 (9):621–29. doi:10.14569/IJACSA.2021.0120970
- Kubat, M., and S. Matwin. 1997. Addressing the curse of imbalanced data sets: one-sided sampling. In Proceedings of the Fourteenth International Conference on Machine Learning, Nashville, TN, USA, July 8–12, 179–86.
- Kumar, S., S. Bhatachharya, R. Pradhan, S. Biswal, S. M. Thampi, and E.-S. M. El-Alfy. 2019. Fuzzy clustering using salp swarm algorithm for automobile insurance fraud detection. Journal of Intelligent & Fuzzy Systems 36 (3):2333–44. doi:10.3233/JIFS-169944
- Laurikkala, J. 2001. Improving Identification of Difficult Small Classes by Balancing Class Distribution. In Artificial Intelligence in Medicine. AIME 2001. Lecture Notes in Computer Science, ed. S. Quaglini, P. Barahona, and S. Andreassen, vol. 2101. Berlin, Heidelberg: Springer. doi:10.1007/3-540-48229-6_9
- Li, Q., H. Chen, H. Huang, X. Zhao, Z. Cai, C. Tong, W. Liu, and X. Tian. 2017. An enhanced grey wolf optimization based machine for medical diagnosis. Computational & Mathematical Methods in Medicine 2017:1–15. doi:10.1155/2017/9512741
- Li, Y., C. Yan, W. Liu, and M. Li. 2018. A principle component analysis-based random forest with the potential nearest neighbor method for automobile insurance fraud identification. Applied Soft Computing Journal 70:1000–09. doi:10.1016/j.asoc.2017.07.027
- Maiano, L., A. Montuschi, M. Caserio, E. Ferri, F. Kieffer, C. Germanò, L. Baiocco, L. R. Celsi, I. Amerini, and A. Anagnostopoulos. 2023. A deep-learning–based antifraud system for car-insurance claims. Expert Systems with Applications 231:120644. doi:10.1016/j.eswa.2023.120644
- Majhi, S. K. 2021. Fuzzy clustering algorithm based on modified whale optimization algorithm for automobile insurance fraud detection. Evolutionary Intelligence 14 (1):35–46. doi:10.1007/s12065-019-00260-3
- Mohamed, H., and M. Omar. 2021. Predict health insurance cost by using machine learning and DNN regression models. International Journal of Innovative Technology and Exploring Engineering 10 (3):137–43. doi:10.35940/ijitee.C8364.0110321
- Nian, K., H. Zhang, A. Tayal, T. Coleman, and Y. Li. 2016. Auto insurance fraud detection using unsupervised spectral ranking for anomaly. The Journal of Finance and Data Science 2 (1):58–75. doi:10.1016/j.jfds.2016.03.001
- Oyedele, A., A. Ajayi, L. O. Oyedele, J. Manuel Davila Delgado, L. Akanbi, O. Akinade, H. Owolabi, and M. Bilal. 2021. Deep learning and boosted trees for injuries prediction in power infrastructure projects. Applied Soft Computing 110:107587. doi:10.1016/j.asoc.2021.107587
- Ozenne, B., F. Subtil, and D. Maucort-Boulch. 2015. The precision–recall curve overcame the optimism of the receiver operating characteristic curve in rare diseases. Journal of Clinical Epidemiology 68 (8):855–59. doi:10.1016/j.jclinepi.2015.02.010
- Pesantez-Narvaez, J., M. Guillen, and M. Alcañiz. 2019. Predicting motor insurance claims using telematics data—XGboost versus logistic regression. Risks 7 (2). doi:10.3390/risks7020070
- Robnik-Sikonja, M., and I. Kononenko. 2008. Explaining classifications for individual instances. IEEE Transactions on Knowledge and Data Engineering 20 (5):589–600. doi:10.1109/TKDE.2007.190734
- Saito, T., R. Marc, and G. Brock. 2015. The precision-recall plot is more informative than the ROC plot when evaluating binary classifiers on imbalanced datasets edited by G. Brock. PLOS ONE 10 (3):e0118432. doi:10.1371/journal.pone.0118432
- Salmi, M. and D. Atif. 2022. Using a Data Mining Approach to Detect Automobile Insurance Fraud. In Proceedings of the 13th International Conference on Soft Computing and Pattern Recognition (SoCPaR 2021). SoCPaR 2021. Lecture Notes in Networks and Systems, ed. A. Abraham, vol. 417. Springer, Cham. doi:10.1007/978-3-030-96302-6_5
- Seema, R., A. Rawat, D. Kumar, and A. Sai Sabitha. 2021. Application of machine learning and data visualization techniques for decision support in the insurance sector. International Journal of Information Management Data Insights 1 (2):100012. doi:10.1016/j.jjimei.2021.100012
- Severino, M. K., and Y. Peng. 2021. Machine learning algorithms for fraud prediction in property insurance: Empirical evidence using real-world microdata. Machine Learning with Applications 5 (June):100074. doi:10.1016/j.mlwa.2021.100074
- Solorio-Fernández, S., J. A. Carrasco-Ochoa, and J. F. Martínez-Trinidad. 2020. A review of unsupervised feature selection methods. Artificial Intelligence Review 53 (2):907–48. doi:10.1007/s10462-019-09682-y
- Sundarkumar, G., V. R. Ganesh, and V. Siddeshwar. 2016. One-class support vector machine based undersampling: application to churn prediction and insurance fraud detection. In 2015 IEEE International Conference on Computational Intelligence and Computing Research, ICCIC 2015 (ii). doi: 10.1109/ICCIC.2015.7435726
- Sundarkumar, G. G., and V. Ravi. 2015. A novel hybrid undersampling method for mining unbalanced datasets in banking and insurance. Engineering Applications of Artificial Intelligence 37:368–77. doi:10.1016/j.engappai.2014.09.019
- Taha, A., B. Cosgrave, and S. McKeever. 2022. Using feature selection with machine learning for generation of insurance insights. Applied Sciences (Switzerland) 12 (6):3209. doi:10.3390/app12063209
- Ul Hassan, C. A., J. Iqbal, S. Hussain, H. AlSalman, M. A. A. Mosleh, S. Sajid Ullah, and E. Rak. 2021. A computational intelligence approach for predicting medical insurance cost. Mathematical Problems in Engineering 2021:1–13. doi:10.1155/2021/1162553
- Uysal, A. K., and S. Gunal. 2012. A novel probabilistic feature selection method for text classification. Knowledge-Based Systems 36:226–35. doi:10.1016/j.knosys.2012.06.005
- Vasu, M., and V. Ravi. 2011. A hybrid under-sampling approach for mining unbalanced datasets: Applications to banking and insurance. International Journal of Data Mining, Modelling and Management 3 (1):75. doi:10.1504/IJDMMM.2011.038812
- Vijaya, J. N. J., and J. Vijaya. 2022. Boost customer churn prediction in the insurance industry using meta heuristic models. International Journal of Information Technology 14 (5):2619–31. doi:10.1007/s41870-022-01017-5
- Vosseler, A. 2022. Unsupervised insurance fraud prediction based on anomaly detector ensembles. Risks 10 (7):132. doi:10.3390/risks10070132
- Wang, S., J. Tang, and H. Liu. 2015. Embedded unsupervised feature selection. Proceedings of the AAAI Conference on Artificial Intelligence 29 (1). doi: 10.1609/aaai.v29i1.9211
- Wilson, D. L. 1972. Asymptotic properties of nearest neighbor rules using edited data. IEEE Transactions on Systems, Man, and Cybernetics SMC 2 (3):408–21. doi:10.1109/TSMC.1972.4309137
- Xu, B., Y. Wang, X. Liao, and K. Wang. 2023. Efficient fraud detection using deep boosting decision trees. Decision Support Systems 175:114037. doi:10.1016/j.dss.2023.114037
- Yankol-Schalck, M. 2022. The value of cross-data set analysis for automobile insurance fraud detection. Research in International Business and Finance 63 (August):101769. doi:10.1016/j.ribaf.2022.101769
- Yan, C., Y. Li, W. Liu, M. Li, J. Chen, and L. Wang. 2020. An artificial bee colony-based kernel ridge regression for automobile insurance fraud identification. Neurocomputing 393:115–25. doi:10.1016/j.neucom.2017.12.072