
 ?Mathematical formulae have been encoded as MathML and are displayed in this HTML version using MathJax in order to improve their display. Uncheck the box to turn MathJax off. This feature requires Javascript. Click on a formula to zoom.
ABSTRACT
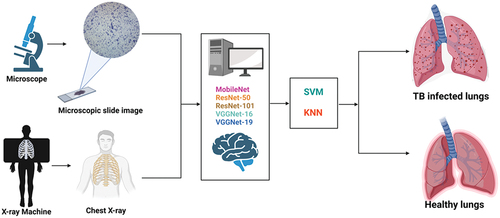
Mycobacterium tuberculosis is a bacterium that causes disease known as Tuberculosis. Tuberculosis is highly contagious and can result in high mortality rate if left untreated. In order to screen individuals suspected of the disease, medical expert relies on several conventional approaches which are hindered by several limitations which include time consuming, high workload, false positive results, etc. This calls for the need to develop smart and automatic approaches that can address these challenges. Majority of existing studies reported the use of 1 or 2 pretrained models and the use of SoftMax as the classifier. Moreover, majority of the studies trained models using a single type of dataset which are mostly curated from public accessible domains. Thus, this study addressed these challenges by: (1) The use of several pretrained models (2) The use of 2 classifiers which include SVM and KNN and (3) Training and validating pretrained models fused with classifiers on microscopic slide and chest X-ray images. The result achieved in this study highlights the prospect of computer-assisted techniques in triaging and screening of TB. The integration of Internet of Everything (IoE) in medical diagnosis has the potential to increase healthcare outcome, boost productivity, and reduce workload.
Introduction
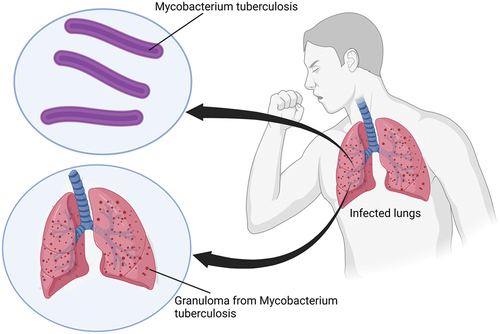
Tuberculosis (TB) is one of the most common contagious diseases that is of global concern worldwide due to its pathogenicity. The disease is categorized as one of the top 10 causes of death globally. According to World Health Organization (WHO) Report (2021), there are over 10 million people suffering from TB and over 1.4 million have been reported deaths as a result of the disease (WHO, 2021). TB is a disease cause by a bacterium known as Mycobacterium tuberculosis. The bacteria are aerobic, slender, small (0.2 millimeter), rod-shaped microbe with a peculiar waxing coating on their cell’s surface. The cell wall of the bacteria is covered by mycolic acid which makes it less susceptible to antibiotics. This attribute makes them “Acid fast” which means they can hold on to dye despite being exposed to alcohol. Moreover, the use of Ziehl-Neelsen (ZN) dye operates based on this attribute which makes the bacilli appear red in color. Mycobacterium tuberculosis mostly affect the lungs but can also spread to other part of the body such as kidneys, spine, brain, lymph nodes, etc. (Yuen et al. Citation2020).
The bacteria can be transmitted through the air as a result of sneezing, coughing or coming in direct contact with an infected person. Healthy individuals can contact the disease as a result of inhaling aerosols which are tiny droplets released in the air by infected individuals. Some of the common symptoms of the disease include persistent cough, fatigue, weight loss, chest pain, weakness, coughing, night sweats, fever, etc. The manifestation of the disease is categorized by healthcare expert as either latent or active. Latent TB is categorized as a form of TB where patients are asymptomatic. This is as a result of the immune system fighting the bacteria, however, people with latent TB are contagious, which means they can transmit the disease to healthy individuals. Consequently, latent TB can progress to become active if care is not taking. Active TB on the other hand occurs as a result of the overpowering of immune system (which leads to the formation of granuloma) by the bacteria (i.e., weakening of the immune system) which result in the display of symptoms as illustrated in (Druszczynska et al. Citation2012).
Figure 1. Mycobacterium tuberculosis (MBTB).
Diagnosis of Tuberculosis
Over the years, scientists have developed several diagnostic approaches for the screening of the bacteria. One of the most common tests is known as the Purified Protein Derivative (PPD) or Tuberculin Skin Test (TST). This testing approach revolves around the injection of small quantity of PPD under the skin of suspected individual. Interpretation of the test is based on the appearance of raised bump at the side of injection between 48–72 hours which indicate the presence of the bacteria. Meanwhile, Interferon-gamma release assays (IGRAs) is another diagnostic approach which revolves around the immune response to Mycobacterium tuberculosis specific antigens. Sputum culturing is regarded as one of the most common diagnostic approaches for the screening of patients suspected of TB. The test revolves around the collection of sputum sample from patients and culturing it on a media. One of the main advantages of this approach is that it can be used to determine drug-resistant types (González-Martín et al. Citation2010; Tsai et al. Citation2013). Another conventional diagnostic approach is Chest X-ray (CXR) imaging.
Challenges and Contributions
Despite the dependence of ZN staining approach and CXR imaging for the detection of TB, these techniques are limited with several drawbacks. Some of the drawbacks of these techniques include low sensitivity especially in early stages, contamination and hazard, the need of experience pathologists and radiologists, the high workload or tediousness in interpreting thousands of images. Diagnosis of TB using microscopy is limited due to the size of the bacilli which is very small, overlapping of the bacilli with each other, the irregular appearance, heterogeneous shape, low background contrast, faint boundaries, etc., which can lead to miss-diagnosis (Ibrahim et al. Citation2021). The efficacy of using of TST and CXR was found to be relatively low especially when compared with molecular or immunological techniques. Moreover, another conventional limitation associated with the diagnosis of TB revolves around the difficulty in detecting multidrug resistance type, Extra-Pulmonary TB (EPTB), the co-infection of Human Immunodeficiency Virus (HIV), and the lack of portable and point-of-care testing. Despite the fact that GeneXpert techniques have transformed the landscape of TB screening due to their innovative sample processing procedure and their ability to detect the bacteria within 2 hours, however, some of the pertinent issues include the high cost of the assay especially in underdeveloped countries as well as false positive result (MacGregor-Fairlie et al. Citation2020; Singh et al. Citation2015).
Accurate diagnosis of TB is crucial for appropriate treatment and preventing the transmission of the bacteria. Even though there are several initiatives proposed by scientists in the last decade such as improving molecular diagnosis through development of highly sensitive testing such as the Polymerase Chain Reaction (PCR) and nucleic acid-based biosensors. For example, deactivated CRISPR/Cas9 based biosensor has been developed for detection of TB, however, it has to pass clinical trials before it is incorporated in healthcare settings (Zhang et al. Citation2017). Another recent technique is the Loop-mediated Isothermal Amplification (LAMP) which employs isothermal amplification procedure and produce result that can be visualized with naked eyes. However, the technique is flawed by the need of expensive reagents and the sensitivity of the procedure is often questionable in detecting TB from smear-negative samples (Toonkomdang et al. Citation2020).
Thus, in order to counter these challenges, scientists employed Deep Learning (DL)-based approach which is a form of Artificial Intelligence (AI) and Machine Learning (ML) paradigm that use algorithms to detect underlying features in medical images. The application of AI-based approaches for the detection of TB from CXR and MSI has evolved from the use of traditional ML techniques such as SVM to more advanced DL-based techniques such as the use of ANN and CNNs (Akbari and Azizi Citation2023). DL-based models leverage the power of deep neural networks designed using different layers in order to extract underlying features from medical images and make accurate classification. DL-based models have the potential to significantly improve the performance of diagnosis of TB which can lead to better treatment (Irkham et al. Citation2022).
DL models have shown excellent results in terms of computer vision such as image recognition and classification. Several studies have been published in the last decade on the use of AI-based models for the development of Computer-aided Detection (CAD) platform for screening TB. Majority of existing studies focused on CXR images acquired from publicly accessible domains. The studies that focus on Microscopic Slide (MS) images are very limited. This can be attributed to lack of sufficient dataset unlike CXR images. CNNs are currently predominant for analyzing and detecting abnormalities from medical images. Training models from scratch require the use of large amount of data. Therefore, pretrained models provide an alternative approach which result in high accuracy. The contribution of this study is tailored toward addressing limitations of existing studies through applied AI by implementing five pretrained models which include ResNet-50, ResNet-101, VGG16, VGG19 and MobileNet. However, instead of using SoftMax classifier, SVM and KNN are implemented due to their high classification capabilities. Moreover, instead of using a single type of dataset like previous studies, the current study utilized two different types of datasets which include MS and Chest X-ray (CXR) images.
The integration of Internet of Everything (IoE) which revolves around network of connection between people, things and data in healthcare system known as Internet of Healthcare (IoHT) or Internet of Medical Things (IoMT) is changing the landscape of medical diagnosis and treatment. IoHT or IoMT revolves around the interconnection between patients, medical devices and internet. Thus, the integration of IoHT and medical diagnosis has led to the development of smart CAD platforms which have shown to improve diagnosis, minimize errors, facilitate real-time detection and enable sharing of medical data between devices, physicians and patients (Irkham et al. Citation2022).
The main research questions in this study are tailored toward exploring the capabilities of SVM and KNN in terms of classification prowess, the use of pretrained models over models developed from scratch and performance evaluation of pretrained architecture using two distinct datasets. Thus, the contributions of this study are outlined below:
Binary classification of MS images using pretrained models.
Binary classification of CXR images using pretrained models.
The application and comparison of performances between SVM and KNN.
Performance comparisons between 5 pretrained models.
Related Work
As a result of vigorous development of computing system, software engineering and growing number of medical images over the past decades, the field of AI has garnered significant interest from researchers all over the world. AI techniques are transforming several fields ranging from transportation, robotics, business, finance and banking, industries, healthcare, etc. The application of AI in healthcare is transforming the field to a better and efficient system. In clinical settings, AI is used along with different types of data such as medical images for the screening of diseases, prediction of prognosis, assessment of severity of disease, repurposing of drugs, generation of new medications, etc. (Irkham et al. Citation2022; Liang et al. Citation2022). AI-based models have been developed for the diagnosis of different types of cancers (e.g., brain, skin, breast, lung, etc.), pneumonia such as bacterial, viral, COVID-19 (Ibrahim et al. Citation2021a; Umar Ibrahim et al. Citation2022a), monkeypox skin lesions (Eliwa et al. Citation2023), Hepatitis C virus (Mamdouh Farghaly, Shams, and Abd El-Hafeez Citation2023; Radwan and Mamdouh Citation2013), cardiovascular diseases such as coronary artery disease (Kaba et al. Citation2023).
The literature is streaming with several researches that applied different types of ML-based models for the detection of TB from different types of datasets. Two of the most common datasets used for CAD of TB include CXR and MS images. Majority of the existing literature applied different types of pretrained models also known as transfer learning models. Unlike models developed from scratch, transfer learning models used already trained models which have been trained and validated using thousands of data. Some of the most common pre-trained models reported in the literature include AlexNet, ResNet (18, 34, 50, 101, 152 etc.), VGGNets (16 and 19), Inception, Xception, DenseNet, MobileNet etc. Other studies also reported the use of hybrid and ensembled models. Meanwhile, majority of existing studies rely on models embedded classifiers (i.e., SoftMax) for binary classification of TB into infected or healthy, positive or negative. By applying several DL-based models equipped with different types of classifiers on MSI and CXR datasets, this study highlights the prospect of computer-assisted techniques in triaging and screening of TB with high performance compared to existing studies.
MS Images
The study conducted by Ibrahim et al. (Citation2021b) proposed the use pretrained model for the binary classification of MS images into infected and non-infected. The study employed pretrained AlexNet to train and test MS images acquired from Near East University hospital which comprises of 530 images. The images selected as training set (i.e., 70%) are augmented via rotation and cropping which yield to 2444 total images (1320 positive and 1144 negative). Training and testing are conducted in three sets of experiments while adjusting the protocol accordingly. Moreover, the study also conducted machine vs human based on ground truth classified by experienced pathologists. Evaluation of the pretrained model based on 10-k fold cross validation resulted in an accuracy, sensitivity and specificity of 98.73%, 98.59% and 98.84% respectively on unseen datasets. The comparison between Pretrained AlexNet and human pathologists has shown that the pretrained model perform better than beginners, certified 1 (less than 10 years of experience) while certified 2 (more than 10 years of experience) achieve better result than pretrained AlexNet in experiment A and B. However, after adjusting some of the inconsistencies, the models achieve optimum performance in experiment C.
The use of MS images for the classification of TB into binary classes (infected and healthy) using pretrained AlexNet fused with SVM and SoftMax is proposed by Umar Ibrahim et al. (Citation2022b). The study employed MS images dataset from Near East University hospital (530 total images) and Kaggle repository which contain 1263 positive images (leading to overall 1893 images in which 1363 are positive and 530 are negative). The fusion of the model and the two classifiers was trained based on 70:30 split where 1325 are used for training and 568 are used for testing. Evaluation of the model performance resulted in an accuracy of 98.14%, sensitivity of 96.89% and specificity of 99.38% using pretrained AlexNet coupled with SoftMax. While the binary classification of MSI using the fusion of pretrained AlexNet and SVM resulted in an accuracy of 98.73%, sensitivity of 99.42% and specificity of 98.03%.
The study conducted by Zurac et al. (Citation2022) on the other hand focused on the classification of TB from ZN stain images using AI-based approach named RegNetX4 architecture. The study utilized 510 ZN stain images in which 110 are positive cases and 400 are negative cases acquired from department of Pathology of Colentina University hospital. The images were annotated and several data augmentation techniques were conducted (random shift, rotation, cropping, brightening, contrasting and saturation) which maximize the number of training set to over 260, 000 positive and 700,000,000 negative patches. In order to test performance of the model, 60 ZN stain slides which comprises of 23 positive and 37 negative cases leading to 286,000 patches are used. The performance of the model showed 0.977 ROC, 98.33% accuracy, 95.65% sensitivity, and 100% specificity.
Gupta et al. (Citation2023) proposed the use of AI-based technique for the screening of TB from ZN MS images. The study acquired 400 clinically suspected cases from three different centers in northern India. Detection of TB from the images were conducted using AI-based microscopy and microscopist. Evaluation of the AI-based microscopy resulted in 89.25% sensitivity, 92.15% specificity, 75.45% PPV, 96.94% NPV and 91.53% accuracy. Meanwhile, the study conducted by Fu et al. (Citation2022) evaluated the performance of AI-based technique (CNN developed by µ-Scan 1.1, Wallen Medica, Kaohsiung, Taiwan) for the automated identification and detection of TB from mycobacteria Acid-Fast Bacilli (AFB) under acid-fast staining. The study utilized 5930 smears which are evaluated according to several stages by varying the number of smears from 120, 200 and after removing disqualifying smears caused by poor staining quality and smear preparation, the performance of the model resulted in 95.2% accuracy, 85.7% sensitivity, and 96.9% specificity. Moreover, the study also compared the use of AI-based technique and manual screen where automated approach recovered 85 positive results which are classified incorrectly using manual screening.
In order to address the gap surrounding the labor-intensive and time-consuming of microscopic examinations of slides at 1000× magnification (Lee and Lee Citation2023), proposed a CAD technique designed to enhance diagnosis of TB. The study implemented 9 DL models which include ResNet50, Inception v3, DenseNet, Xception, Swin Transformer, Vision Transformer, EfficientNet, NASNet and RegNet. In order to train and test the models, 40 slides at 400× magnification (30 for training and 10 for evaluation) which acquired from the National Forensic Service of Korea are used. Patches-based dataset was constructed which led to the creation of 98,034 spots (47,017 positive and 47,017 negative). The evaluation and comparison between the 9 models have shown that NASNet model achieved the highest result with 99.777 ± 0.0231 accuracy, 99.728 ± 0.0356 precision, 99.771 ± 0.0175 recall and 99.749 ± 0.0260 F1 Score per patch and 90% per slide.
Waluyo, Isnanto, and Rochim (Citation2023) proposed an automatic technique for the detection of TB from sputum images. The overall framework is designed according to six stages which include data collection, pre-processing (resizing), color segmentation, augmentation, feature extraction and classification. The study utilized 220 sputum images which were obtained from the Semarang City Health Center. The acquired image dataset is further partitioned into 82% for training (180 images, 115 TB and 65 non-TB) and 18% for testing (40 images, 20 TB and 20 non-TB). The images are trained and tested using (1) CNN (designed with 6 convolutional layer) and (2) CNN fused with KNN. Evaluation and comparison between CNN and CNN-KNN has shown that CNN-KNN achieved the best result with 92.5% accuracy, 93.5% precision, 92.5% recall and 92.5% F1 Score.
CXR Images
In order to improve the speed and efficiency of diagnosis of TB, Akbari and Azizi (Citation2023) developed AI-based technique from scratch which revolves around analysis of digitalized CXR images using CNN. The DL-based CNN model is train and tested using CXR images curated from online repository which contain 700 positive and 3500 negative images. In order to maximize the training sets, several data augmentation techniques were carried out which include scaling, flipping, zooming, rotation etc. leading to 6155 total images (i.e., 1630 additional negative images and 324 additional positive images). The performance evaluation of the CNN model resulted in 97% accuracy, 98% precision, 83% recall and 90% F-1 score.
The study conducted by Xiong et al. (Citation2018) evaluated the efficacy of AI-assisted approach for the detection of TB from CXR images. The study adopted a pretrained CNN named TB-AI. The dataset used in this study is collected from Peking University hospital which comprises 246 cases. Unlike other studies that use large amount of dataset as training set, in this study, 45 images are used for training (30 positive and 15 negative cases), while the developed model is tested using 201 images which include (108 positive and 93 negative cases). Moreover, the study also compares the efficacy of TB-AI with human pathologist (ground truth). The performance evaluation of the model resulted in 97.94% sensitivity and 83.65% specificity. The comparison between TB-AI and human pathologists indicated that humans performed better in the first run, while in the second run the model performed accurately after undergoing modifications.
Umar Ibrahim et al. (Citation2022b) proposed the use of pretrained AlexNet for the automated classification of CXR images into TB and healthy cases. The dataset used in the study is acquired from public accessible domain known as Kaggle repository which contains 7000 images (3500 positive and 3500 negative). The model is trained using two classifiers, SVM and SoftMax based on 70:30 data split (i.e., 4900 for training and 2100 for testing). The result of the model performance shows that AlexNet+SoftMax achieved 98.19% accuracy, 99.62% sensitivity and 96.76% specificity on unseen dataset, while AlexNet+SVM achieved 98.38% accuracy, 98.71% sensitivity and 98.04% specificity on unseen dataset.
The study conducted by Nafisah and Muhammad (Citation2022) proposed the application of segmentation networks in order to extract region of interest from CXR images and the subsequent classification of segmented images using DL models. The study acquired three separate datasets made available to the public which include Belarus (304), Montgomery (138) and Shenzhen (662) which resulted in 1098 total images (692 positives and 406 negatives). The acquired images labeled as training set are augmented via rotation at 9 different angles. The grayscale images are trained using several CNN models which include EfficientNetB3, Xception, Inception-ResNet-V2, ResNeXt-50 and MobileNet. Evaluation and comparison of CNNs revealed that EfficientNetB3 achieved the best result with an average accuracy of 98,78%, testing accuracy of 99.1%, ROC of 99.9%, 98.3% recall, 98.3% precision, 98.3% F1-score, 99.0% specificity and 97.2% kappa for combined dataset with segmentation and augmentation.
The use of segmentation and classification of Pulmonary TB (PTB) and Extra Pulmonary TB (EPTB) from CXR images is proposed by Sharma et al. (Citation2021). The study is designed based on two stages. Stage 1 revolves around the collection of CXR images (include 1000 images collected from TB Specialists of Jalandhar region, Punjab, India), image pre-processing (through enhancement and restoration), segmentation and feature extraction. The second stage revolves around the use of three AI-based techniques for the classification of CXR images into binary classes (TB and non-TB). As part of the image processing step, “Histogram Filter” and “Median Filter” are applied with the CLAHE technique to salvage the segmented image. The segmented images are subsequently trained (80%) and tested (20) using SVM, Decision Tree and Naïve Bayes classifiers. Evaluation of AI-based classifiers has shown that Decision Tree achieved the best result for the classification of CXR images into TB and non-TB with 98% accuracy, 99% AUC, 97.9 F1 score, 98% Precision and 98% recall.
Lakhani and Sundaram (Citation2017) proposed the use of Deep CNNs for the binary classification of TB and healthy cases using CXR images. The study employed both pretrained (GoogleNet and AlexNet), untrained models (AlexNet and GoogleNet) and ensemble models to discriminate between TB and non-TB from four different datasets containing 1007 posterior CXR images. The datasets are acquired from two domains; two public accessible domains which include Maryland and Shenzhen and Montgomery county, while the other two are acquired from Belarus TB portal and Thomas Jefferson University hospital. In order to optimize the training set, data augmentation was conducted via cropping and rotation at different angles. The acquired images were split into three partitions; training which account for 68%, validation which account for 17.1% and testing which account for 14.9%. The comparison performances between pretrained models and ensemble models has shown that ensembled AlexNet and GoogleNet achieved the best result with an AUC value of 0.99, sensitivity of 97.3% and specificity of 94.7%.
Devasia et al. (Citation2023) proposed the use of AI-based models for the detection of lung zone wise and image manifestation of active PTB. In order to discriminate between CXR images of TB and non-TB, the study employed EfficientNetB4 model. The model is trained using 1312 CXR images acquired from the National TB Elimination Programme and tested using Health Insurance Portability and Accountability dataset which consist of 94 CXR images (58 TB and 36 non-TB). Testing of the model resulted in an AUC score ranging between 0.95–1.00 for pleural effusion, calcification, cavity, and consolidation.
Limitations of Existing Approaches and Contributions
The literature is streaming with researches on the application of DL architectures for the detection of TB. Despite the handful number of these researches, most of the existing studies utilized one or two DL architectures using SoftMax as the classifier. Another limitation of the existing studies is that majority trained models by using a single type of dataset which are mostly curated from public accessible domains. However, this study differs with existing studies due to the following. (1) The implementation of several pretrained models which include MobileNet, ResNet (50 and 101), VGGNets (16 and 19) (2) The use of two classifiers which include SVM and KNN and (3) Training and validating pretrained models fused with classifiers on two different datasets (MSI and CXR images).
Materials and Methods
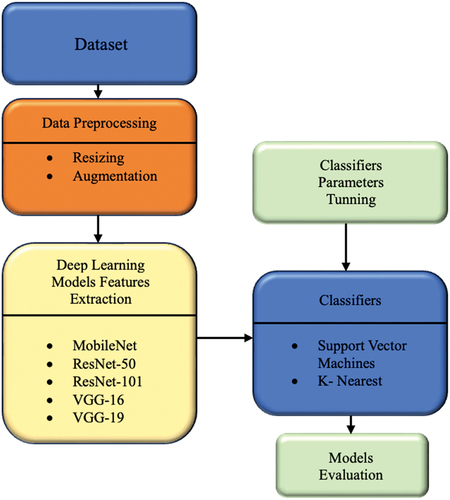
In order to achieve the study’s main objectives, several pretrained models include MobileNet, ResNet-50, ResNet-101, VGG16, VGG19, features were extracted from the last pooling layer of the models, then passed to 2 distinct classifiers SVM and KNN for the binary classification of (1) MS images and (2) CXR images. Prior to training and validation, datasets were curated from online repositories. The acquired datasets are augmented by applying random rotation, random scaling, flipping along x and y axis, and random zoom in order to increase the number of training set. Also, the images were resized to 224 by 224 to fit the input layer of the models. Other techniques covered in this methodology include cross-validation and performance evaluation based on accuracy, sensitivity, specificity, etc. The overall summary of the methodology is presented in .
Figure 2. Flowchart.
Datasets
The study employed two types of datasets which include MS images and CXR.
MS Images
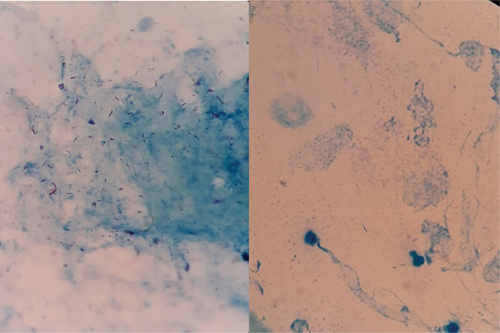
MS images are curated from publicly accessible platform known as Kaggle with 1893 images. The dataset can be accessed through this link (https://www.kaggle.com/saife245/tuberculosis-image-datasets). The dataset is composed of two main folders, positive (1363) and negative (530) as shown in .
Figure 3. Microscopic slide image. Left: Positive. Right: Negative tuberculosis.
CXR Images
7000 CXR images are acquired are acquired from publicly accessible domain known as Kaggle which is available at this website (https://www.kaggle.com/tawsifurrahman/tuberculosis-tb-chest-xray-dataset). The datasets consist of two folders, positive and negative with each consisting of 3500 images as shown in .
Figure 4. Left: Tuberculosis. Right: Healthy/Normal.
Pretrained Models
ResNets
Residual Neural Networks known as ResNet is a popular DL neural network design with hundred layers, along with various extensions, ResNets are considered as one of the best performing neural network for image classification. The network is developed by scientists working at the Microsoft company and it achieved top-5 error rate of 5% in the ILSVRC competition. The CNN is designed to scale up number of layers and prevent vanishing gradient and overfitting, which has been issue with previous CNN models. The innovative solution employed by ResNet to bypass the issue of vanishing gradient is known as “skip connections.” The model is designed with convolutional layers that are skip (i.e., multiple identify mappings) and reuses the activation of previous layers. This skipping technique helps reduce the network complexity by compressing the network into fewer number of layers and simultaneously speeding up training time. Majority of ResNet architectures skip between 2–3 layers at specific time (Shin et al. Citation2016; Targ Almeida, Lyman Citation2016).
For example, ResNet-18 is designed to have 18 layers in which 17 are convolutional layers and 1 fully connected layer, while ResNet-50 comprises of 50 layers in which 48 are convolutional layers, 1 average pooling layer and 1 max pooling layer. ResNet-101 on the other hand is made of 101 layers, where convolutional layers are arranged in 33 blocks as well as 1 average pooling layer and 1 max pooling layer (this shows that, despite the depth of the networks, they only have 2 pooling layers). The network use 1 × 1 convolution as bottleneck which main function is to reduce the number of parameters. Like AlexNet and VGGNets, ResNet used SoftMax and can classify up to 1000 categories. In terms of input size, the network accepts an image with pixel size of 224 × 224 × 3 (Shin et al. Citation2016; Targ Almeida, Lyman Citation2016).
VGGNets
VGGNets are CNN models developed by Andrew Zisserman and Karen Simonyan. The network is designed using several layers but the most common ones are VGGNet-16 and VGGNet-19. In 2014, the network achieved top-5 error rate of 7.3% in the ILSVRC competition. In terms of layers, VGG-16 is made of 16 layers in which 13 are convolutional layers and three fully connected layers while VGG-19 is made of 19 layers in which 16 are convolutional layers and three fully connected layers. VGG-16 is designed to have pooling layer after the first 2 convolutional layers, fourth convolutional layer and after every three convolutional layers onward (7th, 10th and 13th) followed by three fully connected layers (dense layers). In terms of input, VGGNets accepts image with an input size of 224 × 224 × 3 (Jaderberg et al. Citation2015; Simonyan and Zisserman Citation2014).
MobileNet
In order to develop lightweight CNN architecture that can be used for mobile applications Howard et al. (Citation2017) developed MobileNet. The network is designed according to the streamline architecture which employs depthwise separable convolution to develop lightweight deep CNN with low latency for embedded and mobile devices. The network is devised based on two different types of convolution known as pointwise and depthwise. The key function of the depthwise separable convolution is to reduce complexity and model size (Howard et al. Citation2017). The network comprises of 28 layers where all layers apply several operations which include convolution, batch normalization and ReLu except for the last layer which is a fully connected layer and the use of SoftMax as network classifier.
Classifiers
Support Vector Machine (SVM)
SVM is a ML algorithm that can be apply to classify both linear and non-linear data. SVM applies kernel trick to map input data into higher dimensional feature space for non-linear classifications. Homogeneous, non-homogenous, Gaussian and Linear are some of the kernel functions use in SVM. However, Gaussian kernel is the most common kernel function used for prediction. The main objective of SVM is to establish the best hyperplane that separate different data points (i.e., 2 for binary classes). SVM maximized the distance or margin between data points where the closest data points are regarded as support vectors (Chen, Lin, and Schölkopf Citation2005; Noble Citation2006).
SVM as a classifier offer several advantages which include its ability to handle large number of features and are highly efficient in high dimensional spaces. Moreover, SVM is versatile (as a result of choice of different kernels which can handle complex data distributions) and robust against overfitting. Another distinct feature of SVM is it is memory-efficient, which means it only employ subset of support vectors (i.e., training data) for appropriate decision-making. Despite its effectiveness in both classification and regression task, SVM has other drawbacks such as an issue regarding interpretability, it can be computationally expensive especially when classifying large amount of data. Another challenge includes the difficulty of establishing the appropriate kernel and tuning parameters (Bhavsar and Ganatra Citation2012; Mammone, Turchi, and Cristianini Citation2009).
K-Nearest Neighbour (KNN)
Similar to SVM, KNN is an ML algorithm that is used for solving problems regarding classification and regression tasks. KNN relies solely on the local data points to make predictions or classification instead of making assumptions about the underlaying data distribution. The application of KNN classifier revolves around several stages which include training where the algorithms memorizes the entire supervised or label datasets, followed by prediction stage where the algorithms searches for the K-nearest neighbors by using a value of K as user-defined parameters. The algorithms estimate the probability of the test data belonging to the classes of “K” in training and then the selection is carried out based on the class that hold the highest probability (Zhang Citation2016).
KNN is a highly efficient classifier due to its simplicity and easy to implement. The algorithm can be used for classifying small amount of data. Another distinct feature of KNN is that it memorizes the data during training stage. However, some of the drawbacks of using KNN revolve around its sensitivity to the selection of value of K, it is computationally expensive when using large number of datasets especially during the prediction or classification stage. Moreover, the issue of dimensionality can hinder the classifier’s performance which makes it less appropriate for high dimensional data (Samet Citation2008; Bhatia Citation2010).
Image Partitioning
AI-based models are trained using large number of datasets and tested using reserve (i.e., small number of datasets). Several studies suggested the use of 70:30, 75:25 and 80:20 partitioning. Thus, in this study we opted for 80:20 to allow the models perform very well on both training and testing set as shown in .
Table 1. Data split.
Model Training
The models are trained and tested using Dell inspiron15 8gb RAM, core i7, graphical Processing unit (GPU) NVidia 1060ti. The images are trained using 80% and 20% of the dataset is reserved as testing set and also used to evaluate the model performance. Minibatch optimization is a gradient descent that is used to optimize the model. The training is carried out using 20 epochs with 0.0001 as learning rate. The models were tuned using the parameters presented in .
Table 2. Classifiers parameters.
Performance Metrics
Evaluating the performance of ML models is essential step for understanding the robustness and efficiency of the model and whether the model is reliable for screening of medical cases. Several performance metrics are used to evaluate ML models, some of these metrics include accuracy, sensitivity, specificity, F1-score, AUC, confusion matrix, etc.
Where; TPs are True positives,
FPs are False positives,
FNs are False negatives
TNs are True negatives
Confusion Matrix
In ML, confusion matrix is use to evaluate the performance of models in terms of classifications and predictions. The matrix compares the true or actual cases with the ones predicted by the model. Confusion matrix works better for models with binary classification. The matrix consists of true positive, false positive, false negative and true negative.
Results and Discussion
The concept of digital imaging integrated with computer-assisted or computer-aided techniques are changing the landscape of medical diagnosis into a more reliable, robust, accurate, fast and affordable method. The use of medical imaging techniques such as CT scans, X-rays, mammograms, MRIs as well as nuclear imaging techniques continue to play significant role in helping healthcare experts in conducting precise diagnosis and appropriate decision making. The integration of AI-based models has shown to aid medical expert in terms of classifying diseases, processing images and interpretation of different diagnosis. In line with this prospect, this study aims to apply different pretrained CNN models fused with 2 distinct classifiers for the accurate classification of MS images and CXR images into positive (TB) and negative (healthy) cases as shown in .
Figure 5. Experimental set up.
Performance Evaluation of Models Using Microscopic Slide (MS) Images
The binary classification of MS images into TB and non-TB resulted in 97.5% accuracy, 97.33% sensitivity, 97.69% specificity, 97.33% F1-Score, 97.33% precision, 95.02% Yonden Index and 97.51% AUC score using MobileNet-SVM, while MobileNet-KNN resulted in 92.9% accuracy, 88.07% sensitivity, 97.15% specificity, 92.05% F1-Score, 96.40% precision, 85.22% Yonden Index and 92.61% AUC score.
Testing and evaluation of ResNet50-SVM resulted in 99.4% accuracy, 99.5% sensitivity, 99.2% specificity, 99.34% F1-Score, 99.18% precision, 98.7% Yonden Index and 99.35% AUC, while ResNet50-KNN achieved 100% accuracy, 100% sensitivity, 100% specificity, 100% F1-Score, 100% precision, 100% Yonden Index and 100% AUC.
Comparing the performance of ResNet-101 fused with SVM and KNN resulted in 99.6% accuracy, 99.5% sensitivity, 99.6% specificity, 99.54% F1-Score, 99.59% precision, 99.1% Yonden Index and 99.55% AUC score using ResNet101-SVM while the performance of ResNet101-KNN resulted in 99.8% accuracy, 100% sensitivity, 99.6% specificity, 99.79% F1-Score, 99.59% precision, 99.6% Yonden Index and 99.8% AUC score.
Training and testing of VGG16-SVM resulted 95.0% accuracy, 93.4% sensitivity,96.4% specificity, 94.58% F1-Score, 95.78% precision, 89.8% Yonden Index and 94.9% AUC while VGG16-KNN achieved 79.6% accuracy, 60.9% sensitivity, 95.7% specificity, 73.45% F1-Score, 92.50% precision, 56.6% Yonden Index and 78.3% AUC.
The comparison between VGG-19 fused with two different classifiers resulted in 94.8% accuracy, 94.6% sensitivity, 94.0% specificity, 94.43% F1-Score, 94.26% precision, 88.6% Yonden Index and 94.3% AUC score using VGG19-SVM while VGG19-KNN achieved 80.9% accuracy, 62.15% sensitivity, 97.15% specificity, 75.13% F1-Score, 94.97% precision 59.3% Yonden Index and 79.65% AUC as presented in and .
Figure 6. Performance Evaluation of pretrained models using MS images.
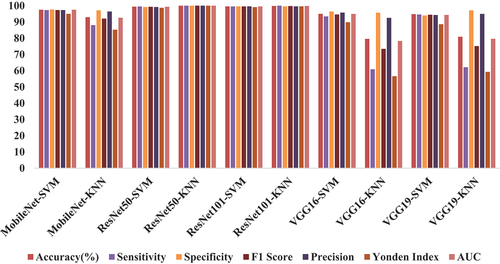
Table 3. Performance Evaluation of pretrained models using MS images.
Performance Evaluation of Models Using Chest X-Ray (CXR) Images
The binary classification of X-ray images has resulted in 99.6% accuracy, 99.0% sensitivity, 99.5% specificity, 99.36% F1-Score, 99.71% precision, 98.5% Yonden Index and 92.25% AUC score using MobileNet fused with SVM. However, evaluation of MobileNet fused with KNN has resulted in 96.4% accuracy, 94.6% sensitivity, 98.0% specificity, 96.24% F1-score, 97.94% precision, 92.6% Yonden Index and 96.3% AUC score.
Meanwhile, comparison between ResNet50 fused with SVM and KNN resulted in 99.4% accuracy, 99.43% sensitivity, 99.2% specificity, 99.36% F1-Score, 99.29% precision, 98.63% Yonden Index and 99.315% AUC score using ResNet101–SVM while the performance of Res-Net101-KNN resulted in 98.5% accuracy, 98.4% sensitivity, 98.5% specificity, 98.48% F1-Score, 98.57% precision, 96.9% Yonden Index and 98.45% AUC score.
The binary classification of CXR images using ResNet101-SVM resulted in 99.7% accuracy, 99.7% sensitivity, 99.7% specificity, 99.71% F1-Score, 99.71% precision, 99.4% Yonden Index and 99.7% AUC score while the performance of ResNet101-KNN resulted in 98.1% accuracy, 98% sensitivity, 98.1% specificity, 98.07% F1-Score, 98.14% precision, 96.1% Yonden Index and 98.05% AUC score.
The performance evaluation of VGG16 fused with SVM resulted in 99.6% accuracy, 99.4% sensitivity, 99.7% specificity, 99.56% F1-Score, 99.71% precision, 99.1% Yonden Index and 99.55% AUC score while VGG16-KNN resulted in 93.1% accuracy, 87.4% sensitivity, 98.7% specificity, 92.64% F1-Score, 98.55% precision, 86.1% Yonden Index and 93.05% AUC score. Training and testing using VGG19-SVM resulted in 99.6% accuracy, 99.5% sensitivity, 99.7% specificity, 99.61% F1-Score, 99.71% precision, 99.2% Yonden Index and 99.6% AUC score while VGG19-KNN resulted in 93.9% accuracy, 88.7% sensitivity, 99.0% specificity, 93.52% F1-Score, 98.89% precision, 87.7% Yonden Index and 93.85% AUC score as presented in and .
Figure 7. Performance Evaluation of pretrained models using CXR images.
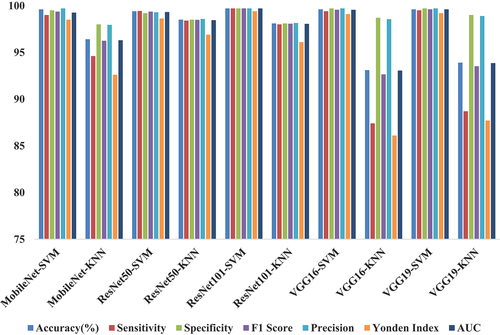
Table 4. Performance Evaluation of pretrained models using CXR images.
Confusion Matrix
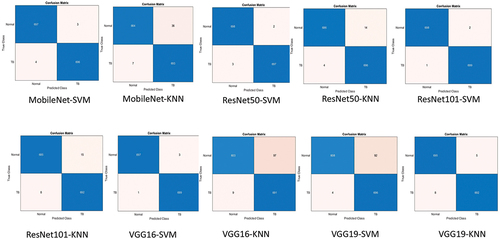
Confusion matrix for the classification of MS images is presented in . It can be seen that ResNet101-KNN achieved the best result by classifying 523 out of 524 images correctly and only miss-classifying 1 image (1 positive) leading to 99.80% accuracy.
Figure 8. Confusion matrix for the classification of MS images using Pretrained Models.
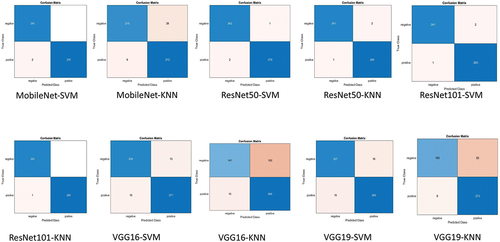
Confusion matrix for the classification of CXR images is presented in . It can be seen that ResNet101-SVM achieved the best result by classifying 1397 out of 1400 images correctly and only miss-classifying three images (2 positive and 1 negative) leading to 99.78% accuracy.
Figure 9. Confusion matrix for the classification of CXR images using Pretrained Models.
Discussion
The last decade has witnessed the growing deployment of several DL for the screening and automatic classification of TB from medical images. Some of these approaches revolve around the use of newly constructed models (i.e., models developed from scratch), the use of ensemble and pretrained models. Deploying models from scratch required large amount of data, computational power and memory in order to attain high performance. Moreover, developing models from scratch requires resources and is time consuming, in order to address this issue, scientists adopt the use of TL based on pretrained networks which relies on knowledge learnt from previous training on large dataset in order to solve new task with small amount of data (Ibrahim et al. Citation2021b). As shown in , the use of ResNet-101 (SVM and KNN) achieved the best result in terms of binary classification of TB in both MS and CXR images respectively. This can be attributed to the capabilities of ResNet in terms of learning underlying features and the use of SVM and KNN in classifying image dataset.
Comparison Between Models and State of the Art
MS Images
The study conducted by Ibrahim et al. (Citation2021b) and Umar Ibrahim et al. (Citation2022b) both applied pre-trained AlexNet for the classification of MS images into TB and normal cases. Compared to ResNet101-SVM, Pretrained AlexNet achieved result slightly below the best performing model despite employing lesser number of images. Consequently, the study conducted by Zurac et al. (Citation2022) using RegNetX4 only outperformed ResNet101-SVM in terms of specificity (100%) while performed lower than ResNet101-SVM in terms of accuracy and sensitivity.
Both of the study conducted by Gupta et al. (Citation2023) and Fu et al. (Citation2022) achieved lower performance compared with ResNet101-SVM which is trained and tested using 1893 images. Meanwhile, the study proposed by (Lee and Lee Citation2023) achieved 99.777% accuracy, 99.728% precision, 99.771% recall and 99.749% F1 Score per patch and 90% per slide using NASNet. The result achieved by the study is almost similar with the result achieved by ResNet101-SVM (i.e., 99.7% accuracy and 99.71% F1-Score). Notwithstanding, the study proposed by (Waluyo, Isnanto, and Rochim Citation2023) achieved lower result in terms of 92.5% accuracy and 92.5% F1 Score using CNN-KNN trained and tested with 220 images compared with ResNet101-SVM which is trained and tested using 1893 images. The summary of the Comparison between models trained and tested using MS images and state of the art are presented in .
Table 5. Comparison between ResNet101-KNN and state of the art Models trained using MS images.
CXR Images
The study conducted by Akbari and Azizi (Citation2023) trained and tested CNN using 6155 images which resulted in 97% accuracy, 98% precision, 83% recall and 90% F-1 score which perform lower than ResNet101-KNN Which is trained using slightly higher number of images. Similarly, the study conducted by (Xiong et al. Citation2018) achieved lower performance compare with ResNet101-KNN. However, the study trained and tested TB-AI with less images compare with the current study. Meanwhile, the study conducted by (Umar Ibrahim et al. Citation2022b) trained and tested AlexNet using same the same type and number of data and achieved result slightly lower than ResNet101-KNN.
The study conducted by Nafisah and Muhammad (Citation2022) on the other hand achieved high performance almost similar to ResNet101-KNN despite training and testing using small amount of data. Moreover, both the study conducted by Sharma et al. (Citation2021) and Lakhani and Sundaram (Citation2017) achieved lower performance while using thousand images. The summary of the Comparison between models trained and tested using CXR images and state of the art is presented in .
Table 6. Comparison between ResNet101-KNN and state of the art Models trained using CXR image.
Industrial Significance of the Proposed Approach
In line with the application of cutting-edge technology as part of industry 4.0 which include AI, IoT, high-speed 5 G network, cloud computing and big data analytics, this study through the deployment of pretrained model in clinical setting is designed to enhanced patient care and healthcare outcome through minimizing miss-diagnosis. Considering the fact that ResNet101 achieved state-of-the-art result in classifying MSI and CXR images, this model can be integrated with IoE framework to enable online or real-time detection of TB. Thus, the deployment of this model in clinical settings can help relieve the tedious workload of pathologists and radiologists, thereby boosting productivity.
Limitation
Despite the fact that the models are trained and tested with moderate number of images relatively more than majority of the existing studies, acquiring more amount of dataset can lead to increase in performance. Thus, future study will attempt to curate dataset from different publicly accessible domains. Moreover, conducting data augmentation through rotation (at different angles), cropping, zooming, color shifting, etc., can increase the number of datasets for training split and thus can lead to increase in performance. Moreover, scientists employ different approaches of pre-processing techniques in order to remove noise, down sample images, remove artificats, etc. Thus, future studies will consider image filtering and enhancement as pre-processing techniques.
Another approach that can improve performance is the use of ensembled models instead of selecting the best performing models. Ensemble methods offer several advantages over single models such as better performance for complex and noisy images, reducing the risk of overfitting and underfitting by balancing the trade-off between bias and variance. Consequently, the use of cross validation is another approach that can be explore in the future. Cross validation provides a more accurate and reliable estimate of the model’s performance considering the fact that it uses all folds for both training and testing.
The application of Industry 5.0 in healthcare (i.e., Healthcare 5.0) offers several potentials such as telemedicine, remote care, preventive care, personalized medicine and automation of tedious task (Gomathi, Mishra, and Tyagi Citation2023). As a result of the growing need of remote testing, confirmation and validation, scientists are developing CAD-IoHT framework in order to enable remote testing through uploading of medical images in a website designed as an expert system for screening TB. Considering the fact that this work is limited to training and testing models using PC and thus subsequent testing can only be conducted on-site. Thus, future work will consider developing AI-IoHT powered platform that can enable online and real-time detection of TB by users from different regions.
Conclusions
With the increasing number of cases of PTB as well as mortality rate coupled with expensive and controversial disease management, inadequate resource, time wasting, reappearance of drug resistant strains are some of the burdens limiting the diagnosis and treatment of TB especially in underdeveloped countries and remote areas. Current conventional approaches such as TST or PPD, acid-fast staining, bacterial culture and X-ray imaging are still hindered by several challenges such as high cost, low sensitivity, time consuming, the need of experience medical experts, high workload etc. which must be addressed in order to achieve optimum accuracy. The field of AI which is revolutionizing many sectors including healthcare has now provide researchers with opportunities to develop automated, precise, novel, rapid diagnostic approach. Thus, this study leverages the prowess of DL models (based on pretrained models which include MobileNet, ResNet-50, ResNet-101, VGG16, VGG19) fused with 2 classifiers (SVM and KNN) for the binary classification of MS images and CXR images.
In terms of classification of MS images, ResNet101-KNN achieved the best result with 99.8% accuracy, 100% sensitivity, 99.6% specificity, 99.79% F1-Score, 99.59% precision, 99.6% Yonden Index and 99.8% AUC score, while in terms of CXR images, ResNet101-SVM achieved the best result with 99.7% accuracy, 99.7% sensitivity, 99.7% specificity, 99.71% F1-Score, 99.71% precision, 99.4% Yonden Index and 99.7% AUC score. The result obtained from this study showcase the strength of using machine learning classifiers instead of using conventional SoftMax. Despite outperforming state of the art models, the study can be improved by using large amount of data through curation of new dataset or the use of different data augmentation to generate more images. In addition, future studies will consider image filtering and enhancement as pre-processing techniques. Consequently, future studies will focus on combining both segmentation and classification using UNet and ResUNet. Moreover, the use of ensembled and hybrid models is another approach that can be explore by future work. The rise of IoT/AI-based flatform is transforming CAD for real-time diagnosis. Thus, future studies will focus on developing IoE/AI-based system that enable on-spot classification.
Author Contributions
curation, image pre-processing, training and testing of the pretrained models is conducted by I.O. Writing the study’s literature review is conducted by S.A.; Documentation of introduction and proofreading the entire work I conducted by A.U.I.
Disclosure Statement
No potential conflict of interest was reported by the author(s).
Data Availability Statement
The data that support the findings of this study are available in [Kaggle] at https://www.kaggle.com/saife245/tuberculosis-image-datasets and https://www.kaggle.com/tawsifurrahman/tuberculosis-tb-chest-xray-dataset
Correction Statement
This article has been republished with minor changes. These changes do not impact the academic content of the article.
Additional information
Funding
References
- Akbari, M. N., and A. Azizi. 2023. Building a convolutional neural network model for tuberculosis detection using chest x-ray images. Ghalib Quarterly Journal 1 (1):21–28. doi:10.58342/ajid/ghalibuni.v.1.i.1.5.
- Bhatia, N. 2010. Survey of nearest neighbor techniques. arXiv Preprint. https://arxiv.org/pdf/1007.0085.
- Bhavsar, H., and A. Ganatra. 2012. A comparative study of training algorithms for supervised machine learning. International Journal of Soft Computing 2 (4):2231–307.
- Chen, P. H., C. J. Lin, and B. Schölkopf. 2005. A tutorial on ν‐support vector machines. Applied Stochastic Models in Business and Industry 21 (2):111–36. doi:10.1002/asmb.537.
- Devasia, J., H. Goswami, S. Lakshminarayanan, M. Rajaram, and S. Adithan. 2023. Deep learning classification of active tuberculosis lung zones wise manifestations using chest X-rays: A multi label approach. Scientific Reports 13 (1):887. doi:10.1038/s41598-023-28079-0.
- Druszczynska, M., M. Kowalewicz-Kulbat, M. Fol, M. Wlodarczyk, and W. L. M. RuDnICKA. 2012. Latent mycobacterium tuberculosis infection – pathogenesis, diagnosis, treatment and prevention strategies. Polish Journal of Microbiology 61 (1):3–10. doi:10.33073/pjm-2012-001.
- Eliwa, E. H. I., A. M. El Koshiry, T. Abd El-Hafeez, and H. M. Farghaly. 2023. Utilizing convolutional neural networks to classify monkeypox skin lesions. Scientific Reports 13 (1):14495. doi:10.1038/s41598-023-41545-z.
- Fu, H. T., H. Z. Tu, H. S. Lee, Y. E. Lin, and C. W. Lin. 2022. Evaluation of an AI-Based TB AFB smear screening system for laboratory diagnosis on routine practice. Sens 22 (21):8497. doi:10.3390/s22218497.
- Gomathi, L., A. K. Mishra, and A. K. Tyagi, 2023, April. Industry 5.0 for healthcare 5.0: opportunities, challenges and future research possibilities. In 2023 7th International Conference on Trends in Electronics and Informatics (ICOEI) (pp. 204–13). IEEE. 10.1109/ICOEI56765.2023.10125660.
- González-Martín, J., J. M. García-García, L. Anibarro, R. Vidal, J. Esteban, R. Blanquer, J. Ruiz-Manzano, and J. Ruiz-Manzano. 2010. Consensus document on the diagnosis, treatment and prevention of tuberculosis. Archivos de Bronconeumología (English Edition) 46 (5):255–74. doi:10.1016/S1579-2129(10)70061-6.
- Gupta, P., V. Khare, A. Srivastava, J. Agarwal, V. Mittal, V. Sonkar, S. Saxena, A. Agarwal, and A. Jain. 2023. A prospective observational multicentric clinical trial to evaluate microscopic examination of acid-fast bacilli in sputum by artificial in-telligence-based microscopy system. Journal of Investigative Medicine 10815589231171402 (7):716–21. doi:10.1177/10815589231171402.
- Howard, A. G., M. Zhu, B. Chen, D. Kalenichenko, W. Wang, T. Weyand, and H. M. Adam. 2017. Efficient convolutional neural networks for mobile vision applications. arXiv preprint. https://arxiv.org/pdf/1704.04861.
- Ibrahim, A. U., E. Guler, M. Guvenir, K. Suer, S. Serte, and M. Ozsoz. May 31, 2021b. Automated detection of mycobacterium tuberculosis using transfer learning. Journal of Infection in Developing Countries 15 (5):678–86. doi:10.3855/jidc.13532.
- Ibrahim, A. U., M. Ozsoz, S. Serte, F. Al-Turjman, and P. S. Yakoi. 2021a. Pneumonia classification using deep learning from chest X-ray images during COVID-19. Cognitive Computation 1–13. doi:10.1007/s12559-020-09787-5.
- Irkham, I., A. U. Ibrahim, C. W. Nwekwo, F. Al-Turjman, and Y. W. Hartati. 2022. Current Technologies for Detection of COVID-19: Biosensors. Artif Intell and Internet of Med Things (IoMT) Sensors 23 (1):426. doi:10.3390/s23010426.
- Irkham, I., A. U. Ibrahim, C. W. Nwekwo, F. Al-Turjman, and Y. W. Hartati. 2022. Current technologies for detection of COVID-19: Biosensors, artificial intelligence and internet of medical things (IOMT). Sensors 23 (1):426 doi:10.3390/s23010426.
- Jaderberg, M., K. Simonyan, A. Vedaldi, and A. Zisserman. 2015. Reading text in the wild with convolutional neural networks. International Journal of Computer Vision 116 (1):1–20. doi:10.1007/s11263-015-0823-z.
- Kaba, Ş., H. Haci, A. Isin, A. Ilhan, and C. Conkbayir. 2023. The application of deep learning for the segmentation and classifi-cation of coronary arteries. Diagn 13 (13):2274. doi:10.3390/diagnostics13132274.
- Lakhani, P., and B. Sundaram. 2017. Deep learning at chest radiography: Automated classification of pulmonary tuberculosis by using convolutional neural networks. Rad 284 (2):574–82. doi:10.1148/radiol.2017162326.
- Lee, J., and J. Lee. 2023. A Study of mycobacterium tuberculosis detection using different neural networks in autopsy specimens. Diagnostics 13 (13):2230. doi:10.3390/diagnostics13132230.
- Liang, S., J. Ma, G. Wang, J. Shao, J. Li, H. Deng, C. Wang, and W. Li. 2022. The application of artificial intelligence in the diagnosis and drug resistance prediction of pulmonary tuberculosis. Frontiers in Medicine 9:935080. doi:10.3389/fmed.2022.935080.
- MacGregor-Fairlie, M., S. Wilkinson, G. S. Besra, P. Goldberg Oppenheimer, and J. Low. 2020. Tuberculosis diagnostics: Overcoming ancient challenges with modern solutions. Emerging Topics in Life Sciences 4 (4):435–48. doi:10.1042/ETLS20200335.
- Mamdouh Farghaly, H., M. Y. Shams, and T. Abd El-Hafeez. 2023. Hepatitis C virus prediction based on machine learning framework: A real-world case study in Egypt. Knowledge and Information Systems 65 (6):2595–617. doi:10.1007/s10115-023-01851-4.
- Mammone, A., M. Turchi, and N. Cristianini. 2009. Support vector machines. Wiley Interdisciplinary Reviews: Comput Stat 1 (3):283–89. doi:10.1002/wics.49.
- Nafisah, S. I., and G. Muhammad. 2022. Tuberculosis detection in chest radiograph using convolutional neural network architecture and explainable artificial intelligence. Neural Computing & Applications 36 (1):1–21. doi:10.1007/s00521-022-07258-6.
- Noble, W. S. 2006. What is a support vector machine? Nature Biotechnology 24 (12):1565–67. doi:10.1038/nbt1206-1565.
- Radwan, A. A., and H. Mamdouh. 2013. An analysis of hepatitis C virus prediction using different data mining techniques. International Journal of Computer Science Engineering and Information Technology Research (IJCSEITR) 3 (4):209–20.
- Samet, H. 2008. K-Nearest neighbor finding using MaxNearestDist. IEEE Transactions on Pattern Analysis & Machine Intelligence 30 (2):243–52. doi:10.1109/tpami.2007.1182.
- Sharma, A., A. Sharma, R. Malhotra, P. Singh, R. K. Chakrabortty, S. Mahajan, and A. K. Pandit. 2021. An accurate artificial intelligence system for the detection of pulmonary and extra pulmonary Tuberculosis. Tuberculosis 131:102143. doi:10.1016/j.tube.2021.102143.
- Shin, H. C., H. R. Roth, M. Gao, L. Lu, Z. Xu, I. Nogues, J. Yao, D. J. Mollura, and D. Zhang. 2016. Deep convolutional neural networks for computer-aided detection: CNN architectures, dataset characteristics and Transfer Learning. IEEE Transactions on Medical Imaging 35 (5):1285–98. doi:10.1109/tmi.2016.2528162.
- Simonyan, K., and A. Zisserman. 2014. Very deep convolutional networks for large-scale image recognition, computer vision and pattern recognition. arXiv preprint 2014.https://arxiv.org/pdf/1409.1556
- Singh, S., B. Dey, K. S. Sachdeva, S. K. Kabra, K. K. Chopra, V. K. Chaudhary, P. Sharma, and V. M. Katoch. 2015. Challenges in tuberculosis diagnosis and management: Recommendations of the expert panel. Journal of Laboratory Physicians 7 (1):001–003. doi:10.4103/0974-2727.154778.
- Targ, S., D. Almeida, K. Lyman, S. Targ, J. T. Jacobsen, Y. M. Mano, C. S. Chen, J.-C. Weill, C.-A. Reynaud, E. P. Browne, et al. 2016. Visualizing antibody affinity maturation in germinal centers. Science (New York, NY) 351 (6277):1048–54. arXiv preprint, arXiv:1603.08029. doi:10.1126/science.aad3439.
- Toonkomdang, S., P. Phinyo, B. Phetsuksiri, J. Patumanond, J. Rudeeaneksin, W. Klayut, and B. Lin. 2020. Pragmatic accuracy of an in-house loop-mediated isothermal amplification (LAMP) for diagnosis of pulmonary tuberculosis in a Thai community hospital. Public Library of Science ONE 15 (7):e0236496. doi:10.1371/journal.pone.0236496.
- Tsai, K. S., H. L. Chang, S. T. Chien, K. L. Chen, K. H. Chen, M. H. Mai, and K. T. Chen. 2013. Childhood tuberculosis: Epidemiology, diagnosis, treatment, and vaccination. Pediatr Neonatology 54 (5):295–302. doi:10.1016/j.pedneo.2013.01.019.
- Umar Ibrahim, A., F. Al-Turjman, M. Ozsoz, and S. Serte. 2022b. Computer aided detection of tuberculosis using two classifiers. Biomedical Engineering / Biomedizinische Technik 67 (6):513–24. doi:10.1515/bmt-2021-0310.
- Umar Ibrahim, A., M. Ozsoz, S. Serte, F. Al‐Turjman, and S. Habeeb Kolapo. 2022a. Convolutional neural network for diagnosis of viral pneumonia and COVID‐19 alike diseases. Expert Systems 39 (10):e12705. doi:10.1111/exsy.12705.
- Waluyo, W. N., R. R. Isnanto, and A. F. Rochim. 2023. Comparison of mycobacterium tuberculosis image detection accuracy using CNN and combination CNN-KNN. Jurnal RESTI (Rekayasa Sistem dan Teknologi Informasi) 7 (1):80–87. doi:10.29207/resti.v7i1.4626.
- World Health, O. Global Tuberculosis Report 2021. Geneva: World Health Organization. Available at https://www.who.int/publications/i/item/9789240037021. Accessed on 10 March, 2023.
- Xiong, Y., X. Ba, A. Hou, K. Zhang, L. Chen, and T. Li. 2018. Automatic detection of mycobacterium tuberculosis using artificial intelligence. Journal of Thoracic Disease 10 (3):1936. doi:10.21037/jtd.2018.01.91.
- Yuen, C. M., J. M. Seddon, S. Keshavjee, and P. J. Dodd. 2020. Risk-benefit analysis of tuberculosis infection testing for household contact management in high-burden countries: A mathematical modelling study. The Lancet Global Health 5 (8):e672–80. doi:10.1016/s2214-109x(20)30075-9.
- Zhang, Z. 2016. Introduction to machine learning: K-nearest neighbors. Annals of Translational Medicine 4 (11):218–218. doi:10.21037/atm.2016.03.37.
- Zhang, Y., L. Qian, W. Wei, Y. Wang, B. Wang, P. Lin, W. Liu, L. Xu, X. Li, D. Liu, et al. 2017. Paired design of dCas9 as a systematic platform for the detection of featured nucleic acid sequences in pathogenic strains. ACS Synthetic Biology 6 (2):211–16. doi:10.1021/acssynbio.6b00215.
- Zurac, S., C. Mogodici, T. Poncu, M. Trăscău, C. Popp, L. Nichita, M. Cioplea, B. Ceachi, L. Sticlaru, A. Cioroianu, et al. 2022. A new artificial intelligence-based method for identifying mycobacterium tuberculosis in Ziehl–Neelsen stain on tissue. Diagn 12 (6):1484. doi:10.3390/diagnostics12061484.