
 ?Mathematical formulae have been encoded as MathML and are displayed in this HTML version using MathJax in order to improve their display. Uncheck the box to turn MathJax off. This feature requires Javascript. Click on a formula to zoom.
ABSTRACT
Peer-to-Peer systems are still in the early stages of development when it comes to the processing of credit and the appraisal of the risk associated with it. In this study, we used a hybrid convolutional neural network with logistic regression, a gradient-boosting decision tree, and a k-nearest neighbor to predict the credit risk in a P2P lending club. The lending clubs publicly available P2P loan data was used to train the model. In order to address the issue of data imbalance within the dataset, specifically between the non-defaulter and defaulter classes, the synthetic minority oversampling technique sampling approach is utilized. We developed the architecture of our hybrid model by removing the fully connected layer with the soft-max, which is the final layer of the fully connected CNN model and replaced by LR, GBDT, and k-NN algorithms. The experimental results show that the hybrid CNN-kNN model outperforms the CNN-GBDT and CNN-LR models based on the performance metrics accuracy, recall, F1-score, and area under the curve for both all input and important features. This shows that hybrid machine learning models effectively identify and categorize credit risk in peer-to-peer lending clubs, hence assisting in financial loss prevention.
Introduction
Peer-to-peer (P2P) lending was developed in 2005 and rapidly gained popularity across the globe as a result of the rapid development of financial technologies. It revolutionized lending by allowing direct funds transfer to individuals or businesses, bypassing the need for traditional financial institutions as intermediaries (Ko et al. Citation2022; Ren Citation2021). This innovative lending model primarily relies on internet matching services to connect lenders with potential borrowers (Lyócsa et al. Citation2022; Serrano-Cinca and Gutiérrez-Nieto Citation2016). Borrowers are required to submit personal data to the P2P lending platform to apply for loans. In contrast, the lenders select which loans to invest in after carefully evaluating the data provided on the P2P lending platform. P2P lending is a viable alternative for small businesses and some individuals with no credit history. Due to the absence of operating expenses associated with a physical location, peer-to-peer lending can provide borrowers with lower interest rates than banks. In 2018, Lending Club handled more than a million loan applications totaling the US $ 20 billion (Sharma, Li, and Ahmad Citation2021).
There are several well-known peer-to-peer lending sites offering different types of loans. Loop specializes in small business financing, Prosper focuses on personal loans, LendingClub provides personal and business loans, Upstart offers personal loans with innovative credit assessments, StreetShares tailors loans for small companies, and SoFi provides personal and student debt refinancing. These platforms connect borrowers with lenders, offering competitive rates and flexible terms to meet various financial needs.
However, the fundamental problem with P2P lending is information asymmetry because lenders only consider the data provided by borrowers when making loan choices (Chen et al. Citation2021). Moreover, peer-to-peer lending involves several risks, such as operational risks, legal risks, liquidity risks, and default risks (Ko et al. Citation2022). There are many risks associated with the lending system, but credit risk is the primary one. The platform suffers a financial loss because it is difficult to retrieve other assets from customers who have fallen behind on payments since many loans have no collateral.
Peer-to-peer lending entails the risk of borrowers defaulting on their loans or failing to fulfill their agreed-upon interest and principal payments. In the event of a borrower’s default, a P2P platform can assist lenders in recovering their funds and potentially pursue legal action against the defaulter. However, the platform’s capabilities are limited to these measures. There is no assurance that the borrowed funds will be fully repaid. Therefore, it is crucial to employ suitable methods to accurately predict borrower repayment in P2P lending, aiming to reduce the financial losses incurred by the lender.
CNN, a well-known and valuable image classification technique, has not been extensively explored for general data mining tasks (Kim and Cho Citation2019). In the present study, we propose a hybrid machine-learning approach to predict repayment in the context of peer-to-peer lending. Our proposed hybrid machine learning techniques incorporate convolutional neural networks combined with logistic regression (LR), gradient-boosting decision trees (GBDT), and k-nearest neighbor (kNN).
To separate the lending transaction data from multiple borrower characteristics, the convolutional layer is employed, while the pooling layers reduce the dimensionality of the feature maps. Consequently, the pooling layer serves the dual purpose of minimizing the number of parameters to be determined from the lending data and reducing the computational load within the network. The resulting feature maps, obtained through successive application of convolution and pooling layers on the lending data, are then flattened into a one-dimensional array and utilized as inputs for the logistic regression, gradient-boosting decision tree, and k-nearest neighbor algorithms.
The following sections of this paper are organized as follows. In section 2, the results of relevant studies using machine learning and deep learning algorithms for financial sector risk prediction are reviewed. Section 3 presents the preprocessing of the lending data and provides a detailed discussion of the methods employed, such as convolutional neural networks, logistic regression, gradient-boosting decision tress, k-nearest neighbors, and hybrid CNN-LR/GBDT/kNN. Section 4 discusses more on the experimental results and comparison of LR, GBDT, and kNN algorithms that are hybrid with CNN. The conclusion is reached in section 5.
Related Works
More intensive study has been attempted in the literature, despite the fact that recognizing and classifying peer-to-peer lending clubs should have a considerable economic advantage. A number of previous studies are compiled in this section.
In order to reduce the risk of default for peer-to-peer companies and encourage the healthy and sustainable development of the P2P industry (Gao and Balyan Citation2022), uses a model based on the LightGBM (Light Gradient Boosting Machine) algorithm to analyze a large number of sample data from Renrendai, which is a representative platform of the P2P industry. In order to provide the best default risk detection model, they investigate the integration of linear blending with the core LightGBM model. Their findings demonstrate that the LightGBM algorithm model has the best prediction performance in terms of several performance assessment indicators, with a prediction accuracy rate on the test set of 80.25%, accurately identifying more than 80% of users. The linear blending method and the integration of LightGBM produce results with precision values of 91.36%, recall values of 75.90%, and accuracy values of 84.36%. In comparison to conventional machine learning models like logistic regression and support vector machines, the established LightGBM algorithm can effectively identify the default of the loan business on the P2P platform. The LightGBM method can accurately asses a huge number of multi-dimensional data samples to determine a user’s default risk on P2P networks.
P2P lending systems are not yet strictly regulated by pertinent laws, nevertheless, their rate of development has considerably outpaced that of laws. P2P lending activities are nevertheless vulnerable to dangers as a result. In order to reduce the risks of default and asymmetric information on P2P lending platforms (Ko et al. Citation2022), suggests prediction models. In particular, they created complex processes to per-process massive amounts of data retrieved from Lending. A total of five AI models- decision tree, random forest, LightGBMM, artificial neural networks, and convolutional neural network, as well as three statistical models- logistic regression, Bayesian classifier, and linear discriminant analysis- were then utilized to analyze the data. Based on the state of their loans, lending club customers were grouped logically. To evaluate the models, they employed the AUC-ROC curve, the Kolmogorov-Smirnov chart, the student’s t-test, the confusion matrix series of metrics, and other metrics. Empirical testing reveals that LightGBM perfroms the best and is 2.91% more accurate than the other models, raising lending club’s revenue by nearly $ 24 million.
Credit risk evaluation is crucial for helping financial institutions define their banking policies and business plans. The emergence of social lending platforms over the past ten years has upended established credit risk evaluation systems. Without the assistance of financial institutions, lenders and borrowers can simply communicate with one another using these platforms. They specifically assist borrowers with the investment phase, allowing lenders of any number and size to participate. Yet, the inadequate experience of the lenders and the lack of knowledge about the credit history of the borrower might increase risks in social lending platforms, necessitating an accurate credit risk rating. Due to the fact that the credit risk assessment problem in financial operations is frequently characterized as a binary problem based on debt repayment, suitable machine learning algorithms can be used to overcome these issues (Moscato, Picariello, and Sperl Citation2021). suggest conducting a comparison analysis of some of the most well-liked credit risk assessment techniques in order to ascertain if a loan would be repaid in a P2P platform. A number of classifiers that are among the most popular in the study and are based on diverse sampling strategies are employed to address the issue of class imbalance. An actual data set comprising 877,956 samples was gathered from the social lending sector for experimental research. They come to the conclusion that their results are the most accurate in predicting the P2P credit risk.
To overcome the limitations of the peer-to-peer credit scoring model and more accurately assess credit risk (Turiel and Aste Citation2020), proposes applying logistic regression and support vector machine algorithms, along with linear and nonlinear deep neural networks (DNN), to lending data in order to replicate lender acceptance of loans and forecast the likelihood of default of issued loans. A suggested two-phase model forecasts loan rejection in the first phase and default risk for loans that are granted in the second. With a test set recall macro score of 77:4%, LR was determined to be the top performer for the initial phase. Only the second phase saw the application of DNNs, which showed the highest results with a test set recall score of 72% for defaults. This demonstrates how artificial intelligence can improve credit risk models already in use, cutting the default risk of loans granted by as much as 70%. The models were also used to analyze loans obtained just for small firms. When trained on the entire dataset, the model’s initial stage performs noticeably better. Instead, when trained on the small business subgroup, the second phase performs noticeably better. This raises the possibility of a mismatch between the screening methods used for these loans and the default prediction methods that should be applied.
(Bussmann et al. Citation2021) presents an agnostic, post-processing methodology aimed at enhancing interpretability of sophisticated machine learning models in credit risk management. The study includes a comparison between XGBoost and logistic regression models using ROC curves, with XGBoost demonstrating superior predictive accuracy. Variable importance is interpreted through the utilization of Shapley values and a Minimal Spanning Tree (MST), revealing clusters of defaulted companies and proximity to high-risk areas. Personalized explanations identify crucial variables for default and non-default cases, aligning with previous analyses. The research distinguishes between local and global explanations, wherein the latter highlights the top ten significant variables, such as leverage, EBITDA, and trade receivables. Overall, their findings underscore the benefits of explainable models in providing personalized explanations and identifying key variables for credit risk prediction. Their proposed methodology holds potential for assisting policymakers and regulators in comprehending the determinants of financial risks and forecasting default probabilities.
Peer-to-peer lending is a sort of financial innovation that provides businesses and individuals with loans directly. With the peer-to-peer lending system, there is a chance that the loan would be repaid late, costing the organization money. There have been numerous studies done to lower the risk of default by creating a classification model of default prediction that aims to improve accuracy. Yet, data asymmetry and underperforming categorization algorithms are the main issues with prediction (Muslim et al. Citation2023). aims to improve the accuracy of the default risk prediction by balancing the data and applying both the stacking model ensemble and the meta-learner. A new method of stacking ensemble learning that combines the XGBoost meta-learner algorithm with the kNN, support vector machine (SVM), and RF base-learner algorithms. Two datasets, the lending club loan data analysis dataset, and the online P2P lending dataset, were used to test the model. According to the evaluation findings, LGBFS-Stacking-XGBoost is the ideal model for both datasets. The accuracy was 99.98% for the online P2P lending dataset and 91.43% for the lending club loan data analysis dataset. Their findings show that the LGBFS-Stacjubg-XGBoost strategy can improve the prediction models precision.
Building the credit-scoring model for P2P loans required the use of a number of machine learning and artificial neural network (ANN) techniques, such as logistic regression, a support vector machine, a decision tree, a random forest, XGBoost, LightGBM, and 2-layer neural networks (Chang et al. Citation2022). Using feature engineering approaches, they obtain and sanitize Lending Club’s open P2P loan data. To find the most suited credit-scoring model in terms of training time and test performance, their study investigates various hyperparameter values for each technique using a grid search and cross-validation. They pre-trained all the data and obtained the feature importance using an XGBoost approach in order to uncover relevant default factors. The 16 features that were chosen may have economic ramifications for studies on P2P loan default prediction. Additionally, the empirical finding demonstrates that approaches for gradient-boosting decision trees, such as XGBoost and LightGBM, outperform methods for ANN and LR, which are frequently used for conventional credit scoring. The most effective strategy outperformed the others was XGBoost.
The existing studies focus primarily on the prediction performance of individual machine learning algorithms and their comparison to traditional credit scoring models. However, it is important to note that machine learning algorithms alone may not possess the inherent capability to effectively extract significant information from P2P lending data. The gap highlights the need for exploring hybrid machine learning algorithms that combine the strengths of different techniques. In this study, we proposed a hybrid machine learning algorithms such as CNN-LR, CNN-GBDT, and CNN/Knn for credit risk prediction in P2P lending club.
In our proposed approach, we employ convolutional neural networks as feature extractors to capture important information from P2P lending data. The input data is processed and converted into a one-dimensional array through the flattening layer. Subsequently, we remove the final fully connected layer as well as the soft-max layer. To perform prediction, we stack logistic regression, gradient boosting decision tree, and k-nearest neighbor algorithms after the flattening layer in the model architecture. Addressing this gap can contribute to a more comprehensive understanding of credit risk in P2P lending platforms and facilitate the development of more accurate and interpretable credit risk assessment models.
Methodology
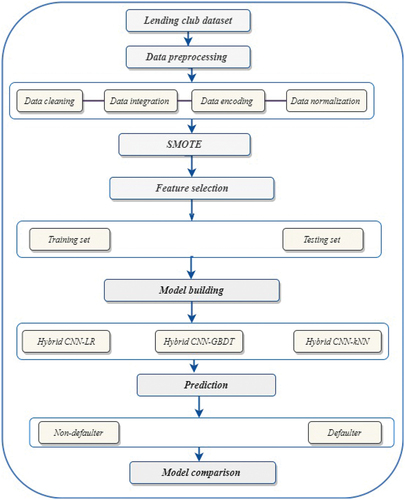
The primary goal of this study, as shown in , is to predict defaulting borrowers on the P2P network. This will be accomplished using hybrid machine learning algorithms.
Figure 1. Workflow of our (Ileberi, Sun, and Wang Citation2022).
Data Preprocessing
The data for this study was obtained from the lending club’s accessible P2P loan data. This dataset contains all of the information obtained by the lending club platform. The identity of the borrower, the purpose of the loan, the borrower’s loan history, loan status, annual income, interest rate, and other factors are the main characteristics.
Non-defaulter and defaulter are the two categories of the target variable loan status. A total of 188,846 loans were made, of which 151,871 were non-defaulters and 36,975 were defaulters.
Data from P2P lending clubs are primarily made up of less defaulter customers than non-defaulters. Logistic regression, gradient boosting decision trees, and K-nearest neighbor can all experience problems when learning from a very imbalanced training set, just like the majority of machine learning methods. The bulk of the samples for data that are imbalanced belong to the dominant group. To minimize the total prediction error rate and improve the model’s accuracy, the target variable must be balanced first.
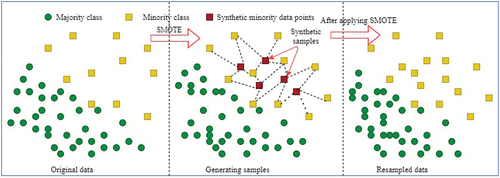
Re-sampling is the process of frequently obtaining samples from the training dataset. These samples are then used to train a certain model in order to gather additional data regarding the fitted model. The targets are to enhance accuracy, identify inconsistency, and obtain more information about a sample. The Synthetic Minority Oversampling Technique, oversampling the minority (defaulter), and under-sampling the majority (non-defaulter) class are the most prevalent re-sampling techniques. In this study, the synthetic minority oversampling technique is utilized as a preprocessor to address the issue of an imbalanced dataset.
SMOTE, as shown in , generates synthetic data using a k-nearest neighbor technique. Prior to determining the data’s k-nearest neighbors, it first randomly selects data from the minority class (Elreedy and Atiya Citation2019). Random data would be mixed to produce synthetic data when the k-nearest neighbor is chosen.
Figure 2. SMOTE: With current instances as a starting point, SMOTE creates new minority instances synthetically. For each class label and its neighbors, the algorithm selects a sample of the feature space. Then, new instances are created by fusing the characteristics of the target cases with those of their neighbors. As a result, the new examples are not identical to the existing minority cases. After incorporating the entire dataset, SMOTE enhances the proportion of merely the minority instances.
Logistic Regression
Logistic regression is a well-known, widely used, and frequently successful supervised machine learning technique (Caie, Dimitriou, and Arandjelovic′ Citation2021). Logistic regression is a variant of linear regression that can handle binary outcomes or binary classifications (Giudici Citation2018; Kurt, Ture, and Kurum Citation2008). It links a number of various independent variables. Logistic regression models are used to estimate the likelihood of an occurrence, such as whether or not a peer-to-peer lending club customer would repay the loan. The output of the logistic regression model is a probability that ranges from 0 to 1 (Theerthagiri et al. Citation2020), which shows whether a specific instance belongs to a particular class or not (Chen Citation2011). By analyzing borrower-specific variables, a logistic regression model calculates the probability of default, providing an estimate of the probability that a borrower will fail to meet their obligations (Giudici, Hadji-Misheva, and Spelta Citation2020).
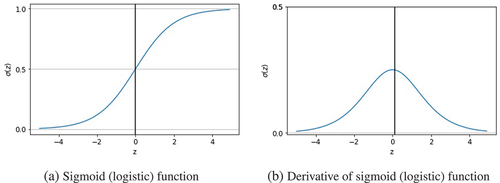
The sigmoid function is used to translate the input data into a probability. The total of the weighted input values is transformed into values between 0 and 1 by the sigmoid function, as shown in , often known as the logistic function. The following equations illustrate the hypothesis as the sigmoid function (Chen et al. Citation2022):
Figure 3. Sigmoid (logistic) function and its derivative (Zhang et al. Citation2020).
where represents the weighted sum of input values.
The value of in sigmoid function can be written as the following:
where denotes the training data.
The output of the sigmoid function can be defined as
The performance of the model is summed up by the cost function. To put it another way, we evaluate the accuracy of the model’s predictions by looking at the cost function. The logistic regression’s parameters are learned using maximum likelihood estimation (Bussmann et al. Citation2021). The logistic regression’s cost function is provided by:
where denotes the training data,
denotes the class or label of the training data, which is either defaulter or non-defaulter customers, and
denotes the output of the sigmoid function previously illustrated.
In binary classification, the cost function can be expressed as follows to determine if a consumer of a peer-to-peer lending club will default or not:
Gradient descent is an iterative optimization method for finding the minimum of a differentiable function. Gradient descent aims to find the optimal weights that minimize the loss function of the model by adjusting the value of our weights so that it continuously converges to a minimal point.
In this method, we may discover the best option while minimizing the cost relative to the model parameters:
Assume that there are features and parameters in the
vector. The cost function can be minimized by using the gradient descent approach for each parameter,
.
where is the learning rate.
The derivative of the cost function is given by
Placing Equationequation (8)(8)
(8) in Equationequation (7)
(7)
(7) , we get
Gradient-Boosted Decision Trees
Gradient-boosted decision trees are a machine-learning method for improving a model’s prediction power over subsequent learning phases. In order to reduce the loss function, each iteration of the decision tree entails changing the values of the coefficients, weights, or biases assigned to each of the input variables being used to predict the target value. Gradient refers to the little adjustments made at each stage of the process while boosting is a method for accelerating the increase in prediction accuracy to an appropriate optimal level.
Gradient boosting decision trees, is an ensemble model that consists of decision trees trained in a sequential manner (Friedman Citation2001). During each iteration, GBDT learns by fitting the negative gradients, which are also referred to as residual errors, to train the decision trees (Ke et al. Citation2017).
Gradient-boosted decision trees are a popular technique to address prediction challenges in both the classification and regression areas (Wang et al. Citation2018). The method enhances learning by streamlining the goal and lowering the number of iterations required to arrive at an appropriately optimal solution.
Gradient boosting decision tree is one type of iterative decision tree technique (Li et al. Citation2022; Xuan et al. Citation2019). The predictions of various trees are combined by GBDT, which uses decision trees as its base learner (Zhang and Jung Citation2020). A new decision tree is trained at each stage to fit the residual between the current prediction and the observed data. Multiple decision trees make up the algorithm, and the outputs of all the trees are combined to produce the final outcome (Bentéjac, Csörgö, and Martnez-Muñoz Citation2021). The number of trees and the number of proportionally-sized leaves per tree are the two hyper-parameters that most strongly influence the structure of a GBDT (Zhang et al. Citation2019).
Consider a P2P lending club training data , with
and their target variables
with
, where 1 is a customer whose credit status is a non-defaulter and 0 is a defaulter customer. Each decision tree
is customized as follows to maximize its performance (Si et al. Citation2017):
where is the decision tree function,
is the weight of the
decision tree function
.
The goal is to choose a classification function to minimize the aggregation of some specified function
si2017gradient:
The function estimation F is taken into account by gradient boosting in an additive form:
where is the number of iterations.
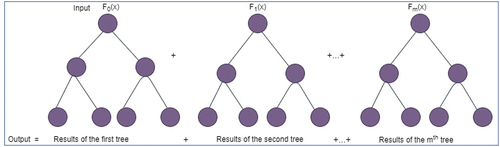
In , the operational principles of GBDT are depicted. Gradient boosting decision trees merge a number of weak learners into a single dominant learner. In this case, single decision trees are poor learners. Each tree works to reduce the error of the one before it since they are all connected in a sequence. The model is strengthened such that each new learner fits into the residuals of the previous stage by modifying the weak learners. The final model produces a potent learner by fusing the results from each phase. A loss function is utilized to find the residuals.
Figure 4. Gradient boosting decision tree structure (Deng et al. Citation2021).
K-Nearest Neighbors
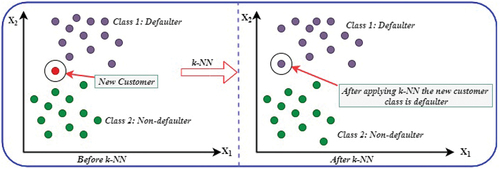
The k-nearest neighbors (k-NN) method is a straightforward technique that may be applied to numerous practical issues in a variety of fields, including banking, healthcare, recommendation systems, and much more. It is a well-known non-parametric machine learning classification algorithm (Moosavian et al. Citation2013; Zhang et al. Citation2022). k-NN assigns the class label based on the majority of the k-nearest patterns in the data space (Kataria and Singh Citation2013; Kramer Citation2013).
There are just two options given to the user: (1) the distance metric, and (2) the k-neighbors to be used (Neath and Johnson Citation2010). The number of neighbors is often determined through cross-validation or by assessing the effectiveness of the classifier on a second, test data set (Neath and Johnson Citation2010).
The k-NN algorithm has the following steps (Taunk et al. Citation2019; Taunk et al; Zhang et al. Citation2022).
Step 1: Consider a lending club training dataset be a set of n-labeled samples.
Step 2: Let be the new instance, we need to be classified.
Choose the k-value for the neighbors.
Find the Euclidean distance between the k closest neighbors.
The k-nearest neighbors should be identified using the estimated Euclidean distance.
A class with the most nearby neighbors should be assigned.
illustrates the working strategies of the k-nearest neighbor algorithm. In the context of the P2P lending club dataset, which consists of labeled instances as either non-defaulter or defaulter, k-NN operates by calculating the distances between the new customer and each of the existing customers. The k customers closest to the new customer are then selected based on these distances. Subsequently, the label with the highest frequency among the selected k customers is chosen as the prediction for the new customer in the case of classification.
Figure 5. working strategies of the k-nearest neighbor algorithm.
Convolutional Neural Network
The components of 1D-CNN are 1-dimensional convolution layers, pooling layers, dropout layers, and activation functions for processing the 1-dimensional data (Qazi, Almorjan, and Zia Citation2022), as shown in . The central component of a CNN is the convolutional layer, which is also where the majority of computation takes place. It needs input data, a filter, and a feature map, among other things. The convolution layer applies the filter to the input. The specific properties associated with the data points are displayed on the feature map that is produced as a result of performing the filtering procedure frequently. In the linear process known as convolution, a set of weights are utilized to control the input multiplication. The inputs are multiplied by the weights, also known as kernels, of the one-dimensional array, as shown in . This procedure generates several values, each with a distinct value for each pass, and results in a feature map.
Figure 6. Convolution layer operation (1D) (Kuo and Huang Citation2018).
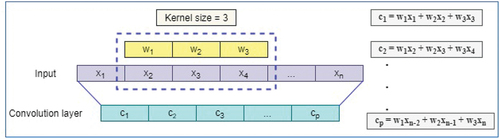
Figure 7. Pooling layer (1D) (Aurangzeb et al. Citation2021).
Each value is then sent to the Rectified Linear Unit activation function following the computation of the feature map.
The ReLU activation function can be mathematically defined as:
where represents the input to the function. If the input is greater than zero, the function returns the input value itself
. However, if the input is less than or equal to zero, the function outputs zero
.
A pooling layer follows every convolution layer. More precisely, following the application of a ReLU to the feature maps produced by a convolutional layer. Each feature map is individually processed by the pooling layer, which creates a new set of the same number of pooled feature maps.
Pooling is used to apply a pooling process, which is similar to a filter, to feature maps. The filtering or pooling operation’s size is smaller than the feature map’s. Due to this, its primary purpose is to gradually lower the dimensionality or representation of the network in order to reduce the number of parameters and computations in the network and the feature map’s vector size is down-sampled without losing any information (Ragab, Abdulkadir, and Aziz Citation2020).
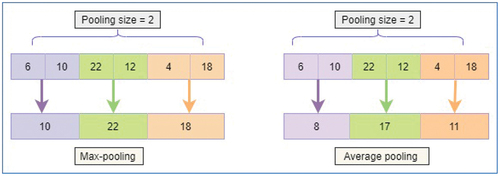
In the pooling operation, there are two often utilized functions (as shown in ): Average pooling is used to determine the average of the elements in the feature map area that the filter is covering. In contrast, max-pooling creates the most prominent feature in a specific area of the feature map.
Figure 8. Pooling layer (1D) (Aurangzeb et al. Citation2021).
Convolutional neural networks and the LR/GBDT/k-NN algorithm are used in this technique to create a credit risk prediction model for per-to-peer lending. The first phase involves employing the remarkable feature extraction capabilities of the convolutional neural network to extract features from the original lending club data and produce a new feature matrix (Berhane et al. Citation2023; Melese et al. Citation2023). Second, using the updated feature matrix as input data, LR/GBDT/kNN algorithms are used to construct the prediction model.
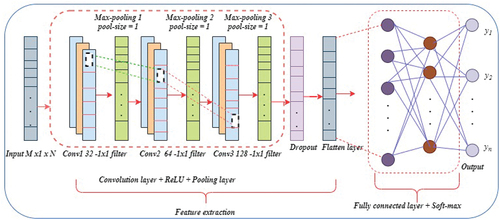
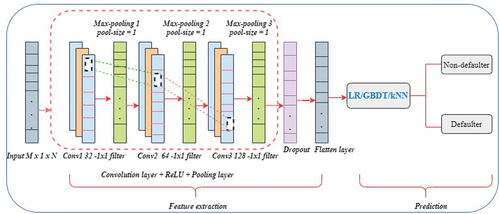
The lending transaction data is separated from the multiple borrower characteristics by the convolutional layer, and the pooling layers reduce the size of the feature maps. As a result, the pooling layer minimizes both the number of parameters that must be determined from the lending data and the amount of computation performed within the network. The feature maps obtained by repeatedly using numerous of convolution and pooling layers on the lending data are flattened into an one-dimensional array and utilized as inputs for the logistic regression, gradient boosting decision tree, and k-nearest neighbor algorithms (Berhane et al. Citation2023; Melese et al. Citation2023). So, the fully connected and soft-max layer of the convolutional neural network is eliminated and replaced by LR/GBDT/kNN in the architecture of our proposed models (as shown in ).
Figure 9. The architecture of our proposed model (Melese et al. Citation2023): Three classifiers—logistic regression, gradient boosting decision tree, and k-nearest neighbor—are layered after the flattened layer by removing the final fully connected and soft-max layer. The input features extracted by the CNN is feed into the logistic regression, gradient boosting decision tree, and k-nearest neighbor algorithms. k-nearest neighbor, decision trees with gradient boosting, and logistic regression have all been used for classification.
Results and Discussion
P2P systems are still in the early stages of development when it comes to the processing of credit and the appraisal of the risk associated with it. Several P2P systems lack accurate credit repayment prediction, which might be used to avoid financial loss. So, it is critical to predicting the credit default rate in P2P lending. In this study, a hybrid machine learning prediction approach for default on P2P credit is developed.
The P2P lending club dataset, which includes 18 input features and one target variable, was used to validate this study. Due to numerous missing values and outliers in the data, the dataset must undergo a data processing phase. The median and mode values are used to fill in missing values in the data. A row that has more than 30% of its values missing is removed.
An imbalanced dataset refers to a situation where the distribution of classification classes within the dataset is not equitable. In the case of P2P lending clubs, the data exhibits an imbalance, with fewer instances of defaulters compared to non-defaulters. To enhance the overall predictive performance and accuracy of the model, it is imperative to address this class imbalance issue.
To tackle the problem of an imbalanced dataset, the synthetic minority oversampling technique is employed as a preprocessor. SMOTE is a method that generates synthetic data to balance the distribution of the minority class. It utilizes the concept of k-nearest neighbors to create synthetic instances. Initially, random samples from the minority class are selected, and then the k-nearest neighbors of these samples are computed. The synthetic data points are subsequently generated by interpolating and mixing the features of the randomly selected samples with those of their k-nearest neighbors.
By using the k-nearest neighbor approach, SMOTE effectively augments the minority class, thereby mitigating the class imbalance. The synthetic data produced through this process assists in providing more representative training examples for the minority class, improving the model’s ability to learn and make accurate predictions.
In our model, the CNN architecture comprises multiple layers, including convolutional, dropout, pooling, and dense layers. The first convolutional layer utilizes 32 filters with a kernel size of 3, activated by the rectified linear unit (ReLU) function. This layer convolves over the input data, generating feature maps. A subsequent convolutional layer follows with 64 filters of size 3, extracting higher-level features. Further refining and extracting complex features, a third convolutional layer with 128 filters is employed. To address overfitting, the model uses dropout regularization and max-pooling. A dropout layer with a 0.5 rate randomly deactivates 50% of neurons during training, promoting generalized learning. Max-pooling reduces spatial dimensions while retaining crucial information by selecting the maximum value within each pooling window, enhancing network efficiency and translation invariance.
To achieve the desired outcomes, the CNN undergoes 35 training iterations using the Adam optimizer, ReLU activation function, max-pooling, padding set to “same,” and a dropout rate of 0.5. In our experiments, the CNN served as a feature extractor. After the features have been extracted and flattened into a one-dimensional array, the logistic regression, gradient boosting decision tree, and k-nearest neighbors classifiers are sequentially applied for prediction. In this process, the fully connected layer, along with the subsequent soft-max layer typically used in the fully connected CNN architectures, is removed. Instead, the flattened layer directly serves as the input for logistic regression, gradient-boosting decision trees, and K-nearest neighbors classifiers.
When training the GBDT model, we took into consideration the learning rate and the n-estimator parameters, which determine the number of decision trees and tree depth. The model’s predictive performance is enhanced through multiple learning iterations. The n-estimator indicates the number of trees utilized by the model, while the learning rate determines the speed at which the model incorporates new data. To minimize the loss function, the decision tree iteratively adjusts the coefficients, weights, or biases assigned to each lending data input variable used for predicting the target value, distinguishing between defaulters and non-defaulters.
In order to assess the performance of the models, it is necessary to employ suitable evaluation metrics. Basic metrics such as accuracy, precision, recall, F1-score, and AUC are commonly utilized to measure the effectiveness of hybrid machine learning algorithm models. These metrics provide valuable insights into the performance and predictive capabilities of the models.
Accuracy alone is inadequate for evaluating the performance of the model due to the imbalanced nature of the datasets from the peer-to-peer lending club. Thus, we employ a different evaluation metric, called the confusion matrix, to assess the effectiveness of the hybrid machine-learning algorithms. The confusion matrix provides a summary of the classifier’s classification performance with respect to the given test data (Ting, Vijayakumar, and Schaal Citation2010). It facilitates the visualization of the outputs of a classification task by arranging the various prediction outcomes and findings in a tabular format. When evaluating the performance of the default prediction model for lending club customers, four distinct results are available.
True Positives (TP) – There are situations where a prediction made by the model comes true, such as when a customer experiences non-default and the prediction made by the model also occurs.
True Negatives (TN) – instances where the model claims that nothing has happened and nothing has actually happened, i.e., where the customer has not defaulted and the model has not predicted defaulting customers.
False Positives (FP) – A customer doesn’t have non-default, but the model forecasts default in cases when the algorithm states something has happened when it hasn’t. Type I errors are the ones that fall under this category.
False Negatives (FN) – There are circumstances where the model offers no promises, such as when something has already occurred, such as when a customer goes into default but the model didn’t predict default. This defect, known as a Type II error, is extremely dangerous.
Precision is a measure of the proportion of positive class predictions that actually belong to the positive class. The ratio of true positives (TP) to the sum of true and false positives (TP + FP) is one way to describe it.
Table 1. Performance of hybrid CNN-LR/GBDT/k-NN (%): using all input features(18).
According to the findings presented in , our hybrid models, namely CNN-kNN, CNN-LR, and CNN-GBDT, demonstrated enhanced accuracy when important features were selected. Specifically, the CNN-kNN model achieved the highest prediction performance with an accuracy of 97.60%. Following closely behind, the CNN-GBDT model achieved an accuracy of 91.60%, while the CNN-LR model exhibited an accuracy of 90.40%. These results highlight the effectiveness of our hybrid models in accurately predicting outcomes once essential features have been identified.
Table 2. Performance of Hybrid CNN-LR/GBDT/k-NN (%): using important input features(10).
Furthermore, also showcases that when important input features were utilized, the hybrid CNN-GBDT model exhibited the highest precision, achieving an impressive precision value of 97.23%. On the other hand, the hybrid CNN-LR model achieved a precision of 96.58% when important input features were employed. These results signify that the CNN-kNN, CNN-GBDT, and CNN-LR algorithms provide effective means for predicting credit risk in platforms used by investors and lending companies.
The Receiver Operating Characteristic (ROC) curve provides valuable insights into the trade-off between sensitivity (the ability of the classifier to correctly identify positive instances) and specificity (the ability of the classifier to correctly identify negative instances). It illustrates the performance of a binary classification model across various classification thresholds. By adjusting the classification threshold, the balance between these two measures can be altered.
shows the ROC curve of our proposed models, which provides a comprehensive evaluation of the classification model’s performance across all classification thresholds. displays the ROC curve of the hybrid models incorporating 10 crucial input features, while displays the ROC curve of the hybrid models incorporating all input features (18).
Figure 10. ROC curve of hybrid CNN-LR/GBDT/k-NN.
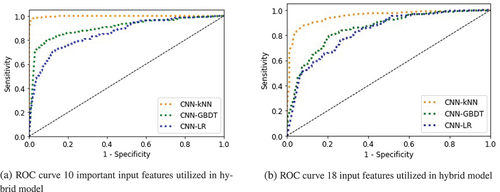
In conclusion, our evaluation of the model performance using two distinct datasets has demonstrated that the inclusion of important features significantly enhances accuracy, yielding a superior rate of 97.60%. Therefore, we confidently assert that hybrid machine learning algorithms are the most effective means for predicting default customers.
presents the performance evaluation of logistic regression, gradient boosting decision tree, and k-nearest neighbors algorithms independently, without hybridization with convolutional neural networks. In light of the findings, it is evident that the performance of logistic regression, gradient boosting decision Tree, and k-nearest neighbors does not surpass that of our proposed methodologies (hybrid CNN with LR, GBDT, or k-NN).
Table 3. Performance of LR/GBDT/k-NN (%): using important input features(10).
The model’s error rate is correlated with the value of k in the k-NN method, making it challenging to determine the ideal k value for achieving the highest accuracy. displays the error rate of the hybrid CNN-kNN model, revealing that the error rate increases as k increases.
Figure 11. Error rate of k-NN & feature importance.
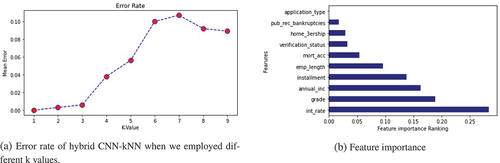
The term “feature importance” describes methods that evaluate input features based on their effectiveness in predicting a specific target variable. According to , the key input features for determining credit risk in peer-to-peer lending are interest rate, grade, annual income, payment, and length of employment.
Finally, we made a comparison between our findings and the most recent findings. When compared to the state-of-the-art as shown below in , our suggested method outperforms in all metrics for identifying credit risk in P2P lending clubs.
Table 4. Performance of earlier, related work.
Conclusion
An essential factor that must be taken into account is the credit risk prediction for P2P lending. P2P lending organizations and other financial businesses would benefit from having a reliable method of predicting credit risk. Thus, having such a prediction would assist both the financial sector and society in preventing numerous economic crises. The absence of regulation and a reliable method to assess the degree of credit risk played a part in this horrible condition. As a result of such thought, society is pushing for some sort of prediction model to address the issue.
Machine learning and deep learning techniques are currently receiving significant attention, particularly for loan evaluation and credit risk prediction in financial institutions. Existing studies have primarily focused on the prediction performance of individual machine learning algorithms and their comparison to traditional credit scoring models. However, it is important to note that relying solely on machine learning algorithms may not effectively extract important information from P2P lending data. This highlights the need for exploring hybrid machine learning algorithms that combine the strengths of different techniques.
In this study, we developed hybrid machine learning algorithms, such as CNN-LR, CNN-GBDT, and CNN-kNN, for credit risk prediction in P2P lending clubs. To conduct this research, we utilize publicly available P2P loan data from the lending club, which provides comprehensive information obtained from their platform.
The target variable in our dataset is the loan status, which can be classified into two classes: non-defaulters and defaulters. However, it is important to note that the dataset exhibits class imbalance, meaning that the distribution of the classification classes is not uniform.
To address the issue of data imbalance between non-defaulters and defaulters, we employ the SMOTE sampling approach. This technique helps mitigate the imbalance and ensures a more robust analysis of the dataset.
In our proposed approach, we utilize convolutional neural network as feature extractors to capture important information from P2P lending data. The input data is processed and converted into a one-dimensional array through the flattening layer. Subsequently, we remove the final fully connected layer as well as the softmax layer. To perform prediction, we stack logistic regression, gradient boosting decision tree, and k-nearest neighbor algorithms after the flattening layer in the model architecture.
The experimental results show that the hybrid CNN-kNN model outperforms the CNN-GBDT and CNN-LR models based on the performance metrics accuracy, recall, F1-score, and area under the curve (AUC) for both all input and important features. The accuracy of the hybrid machine-learning model increased as we used important input features. This shows that hybrid machine learning models effectively identify and categorize credit risk in peer-to-peer lending clubs, hence assisting in financial loss prevention.
Based on the findings, it is advised that stakeholders and policymakers integrate hybrid machine learning models, such as the CNN-kNN model, into credit risk assessment processes in peer-to-peer lending. These models have proven superior in identifying and categorizing credit risk. Prioritizing the use of important input features is crucial to enhance prediction accuracy and strengthen risk assessment frameworks. Insights from the hybrid models also call for the reinforcement of risk management strategies to mitigate potential financial losses. Additionally, stakeholders and policymakers should regularly monitor and adapt their approaches to ensure optimal credit risk prediction and prevention of financial crises. These recommendations aim to guide stakeholders in leveraging the advantages of hybrid machine learning models and enhancing credit risk management practices in peer-to-peer lending.
Considering the method of comparing models in terms of interpretability using Shapley or Shapley-Lorenz values Giudici and Raffinetti (Citation2021), is an excellent addition to our future work. By incorporating these measures, we can assess the importance of individual predictors in each model and compare their contributions. This will provide valuable insights into the interpretability and understanding of the models’ decision-making processes. Using Shapley values or Shapley-Lorenz values will enable you to quantify the relative importance of each predictor, highlighting the variables that have the most significant impact on the predicted outcomes. This approach will enhance the transparency and explain-ability of our models, allowing for a more comprehensive analysis and interpretation of the credit risk assessment. By considering this method, we can provide a more holistic evaluation of the models, considering both their predictive performance and their interpretability. This will contribute to a better understanding of the factors driving the credit risk assessment and facilitate more informed decision-making in the P2P.
Disclosure Statement
No potential conflict of interest was reported by the author(s).
Supplemental material
Supplemental data for this article can be accessed online at https://doi.org/10.1080/08839514.2024.2358661
References
- Aurangzeb, K., M. Alhussein, K. Javaid, and S. I. Haider. 2021. A pyramid-cnn based deep learning model for power load forecasting of similar-profile energy customers based on clustering. IEEE Access 9:14992–26. doi:10.1109/ACCESS.2021.3053069.
- Bentéjac, C., A. Csörgö, and G. Martnez-Muñoz. 2021. A comparative analysis of gradient boosting algorithms. Artificial Intelligence Review 54 (3):1937–67. doi:10.1007/s10462-020-09896-5.
- Berhane, T., T. Melese, A. Walelign, A. Mohammed, and R. Zdunek. 2023. A hybrid convolutional neural network and support vector machine-based credit card fraud detection model. Mathematical Problems in Engineering 2023:1–10. doi:10.1155/2023/8134627.
- Bussmann, N., P. Giudici, D. Marinelli, and J. Papenbrock. 2021. Explainable machine learning in credit risk management. Computational Economics 57 (1):203–16. doi:10.1007/s10614-020-10042-0.
- Caie, P. D., N. Dimitriou, and O. Arandjelovic′. 2021. Precision medicine in digital pathology via image analysis and machine learning. In Artificial intelligence and deep learning in pathology, by S. Cohen, 149–73. Elsevier. doi:10.1016/B978-0-323-67538-3.00008-7.
- Chang, A.-H., L.-K. Yang, R.-H. Tsaih, and S.-K. Lin. 2022. Machine learning and artificial neural networks to construct p2p lending credit-scoring model: A case using lending club data. Quantitative Finance and Economics 6 (2):303–25. doi:10.3934/QFE.2022013.
- Chen, M.-Y. 2011. Predicting corporate financial distress based on integration of decision tree classification and logistic regression. Expert Systems with Applications 38 (9):11261–11272. doi:10.1016/j.eswa.2011.02.173.
- Chen, J., H. Huang, A. G. Cohn, D. Zhang, and M. Zhou. 2022. Machine learning-based classification of rock discontinuity trace: Smote oversampling integrated with gbt ensemble learning. International Journal of Mining Science and Technology 32 (2):309–22. doi:10.1016/j.ijmst.2021.08.004.
- Chen, Y.-R., J.-S. Leu, S.-A. Huang, J.-T. Wang, and J.-I. Takada. 2021. Predicting default risk on peer-to-peer lending imbalanced datasets. IEEE Access 9:73103–09. doi:10.1109/ACCESS.2021.3079701.
- Deng, H., Y. Zhou, L. Wang, and C. Zhang. 2021. Ensemble learning for the early prediction of neonatal jaundice with genetic features. BMC Medical Informatics and Decision Making 21 (1):1–11. doi:10.1186/s12911-021-01701-9.
- Elreedy, D., and A. F. Atiya. 2019. A comprehensive analysis of synthetic minority oversampling technique (smote) for handling class imbalance. Information Sciences 505:32–64. doi:10.1016/j.ins.2019.07.070.
- Friedman, J. H. 2001. Greedy function approximation: A gradient boosting machine. The Annals of Statistics 29 (5):1189–232. doi:10.1214/aos/1013203451.
- Gao, B., and V. Balyan. 2022. Construction of a financial default risk prediction model based on the lightgbm algorithm. Journal of Intelligent Systems 31 (1):767–79. doi:10.1515/jisys-2022-0036.
- Giudici, P. 2018. Financial data science. Statistics & Probability Letters 136:160–64. doi:10.1016/j.spl.2018.02.024.
- Giudici, P., B. Hadji-Misheva, and A. Spelta. 2020. Network based credit risk models. Quality Engineering 32 (2):199–211. doi:10.1080/08982112.2019.1655159.
- Giudici, P., and E. Raffinetti. 2021. Shapley-lorenz explainable artificial intelligence. Expert Systems with Applications 167:114104. doi:10.1016/j.eswa.2020.114104.
- Ileberi, E., Y. Sun, and Z. Wang. 2022. A machine learning based credit card fraud detection using the ga algorithm for feature selection. Journal of Big Data 9 (1):1–17. doi:10.1186/s40537-022-00573-8.
- Kataria, A., and M. Singh. 2013. A review of data classification using k-nearest neighbour algorithm. International Journal of Emerging Technology & Advanced Engineering 3 (6):354–60.
- Ke, G., Q. Meng, T. Finley, T. Wang, W. Chen, W. Ma, Q. Ye, and T.-Y. Liu. 2017. Lightgbm: A highly efficient gradient boosting decision tree. Neural Information Processing Systems. https://api.semanticscholar.org/CorpusID:3815895.
- Kim, J.-Y., and S.-B. Cho. 2019. Towards repayment prediction in peer-to-peer social lending using deep learning. Mathematics 7 (11):1041. doi:10.3390/math7111041.
- Ko, P.-C., P.-C. Lin, H.-T. Do, and Y.-F. Huang. 2022. P2p lending default prediction based on ai and statistical models. Entropy 24 (6):801. doi:10.3390/e24060801.
- Kramer, O. 2013. Dimensionality reduction with unsupervised nearest neighbors. vol. 51. Berlin: Springer.
- Kuo, P.-H., and C.-J. Huang. 2018. A green energy application in energy management systems by an artificial intelligence-based solar radiation forecasting model. Energies 11 (4):819. doi:10.3390/en11040819.
- Kurt, I., M. Ture, and A. T. Kurum. 2008. Comparing performances of logistic regression, classification and regression tree, and neural networks for predicting coronary artery disease. Expert Systems with Applications 34 (1):366–74. doi:10.1016/j.eswa.2006.09.004.
- Li, X., T. Wang, J. Li, Y. Tian, and J. Tian. 2022. Energy consumption estimation for electric buses based on a physical and data-driven fusion model. Energies 15 (11):4160. doi:10.3390/en15114160.
- Lyócsa, Š., P. Vašaničová, B. Hadji Misheva, and M. D. Vateha. 2022. Default or profit scoring credit systems? Evidence from european and us peer-to-peer lending markets. Financial Innovation 8 (1):1–21. doi:10.1186/s40854-022-00338-5.
- Melese, T., T. Berhane, A. Mohammed, A. Walelgn, and S. Hussain. 2023. Credit-risk prediction model using hybrid deep—machine-learning based algorithms. Scientific Programming 2023:1–13. doi:10.1155/2023/6675425.
- Moosavian, A., H. Ahmadi, A. Tabatabaeefar, and M. Khazaee. 2013. Comparison of two classifiers; k-nearest neighbor and artificial neural network, for fault diagnosis on a main engine journal-bearing. Shock and Vibration 20 (2):263–72. doi:10.1155/2013/360236.
- Moscato, V., A. Picariello, and G. Sperl. 2021. A benchmark of machine learning approaches for credit score prediction. Expert Systems with Applications 165:113986. doi:10.1016/j.eswa.2020.113986.
- Muslim, M. A., T. L. Nikmah, D. A. A. Pertiwi, and Y. Dasril. 2023. New model combination meta-learner to improve accuracy prediction p2p lending with stacking ensemble learning. Intelligent Systems with Applications 18:200204. doi:10.1016/j.iswa.2023.200204.
- Neath, R. C., and M. S. Johnson. 2010. Discrimination and classification.
- Qazi, E. U. H., A. Almorjan, and T. Zia. 2022. A one-dimensional convolutional neural network (1d-cnn) based deep learning system for network intrusion detection. Applied Sciences 12 (16):7986. doi:10.3390/app12167986.
- Ragab, M. G., S. J. Abdulkadir, and N. Aziz. 2020. Random search one dimensional cnn for human activity recognition. In 2020 International Conference on Computational Intelligence (ICCI), pp. 86–91. https://api.semanticscholar.org/CorpusID:226848987.
- Ren, K. 2021. Recommendation systems for peer to peer lending system. Ph.D., Dissertation, ResearchSpace@ Auckland.
- Serrano-Cinca, C., and B. Gutiérrez-Nieto. 2016. The use of profit scoring as an alternative to credit scoring systems in peer-to-peer (p2p) lending. Decision Support Systems 89:113–22. doi:10.1016/j.dss.2016.06.014.
- Sharma, A. K., L.-H. Li, and R. Ahmad. 2021. Identifying and predicting default borrowers in p2p lending platform: A machine learning approach. In 2021 IEEE International Conference on Social Sciences and Intelligent Management (SSIM), pp. 1–5. IEEE.
- Si, S., H. Zhang, S. S. Keerthi, D. Mahajan, I. S. Dhillon, and C.-J. Hsieh. 2017. Gradient boosted decision trees for high dimensional sparse output. In International Conference on Machine Learning, https://api.semanticscholar.org/CorpusID:10483721.
- Taunk, K., S. De, S. Verma, and A. Swetapadma. 2019. A brief review of nearest neighbor algorithm for learning and classification. In 2019 International Conference on Intelligent Computing and Control Systems (ICCS), pp. 1255–60. https://api.semanticscholar.org/CorpusID:215815242.
- Theerthagiri, P., I. J. Jacob, A. U. Ruby, and Y. Vamsidhar. 2020. Prediction of COVID-19 possibilities using knn classification algorithm.
- Ting, J.-A., S. Vijayakumar, and S. Schaal. 2010. Encyclopedia of machine learning. In Encyclopedia of machine learning, ed. C. Sammut and GI. Webb, 613–24. Boston: MA Publisher Springer US.
- Turiel, J., and T. Aste. 2020. Peer-to-peer loan acceptance and default prediction with artificial intelligence. Royal Society Open Science 7 (6):191649. doi:10.1098/rsos.191649.
- Wang, J., P. Li, R. Ran, Y. Che, and Y. Zhou. 2018. A short-term photovoltaic power prediction model based on the gradient boost decision tree. Applied Sciences 8 (5):689. doi:10.3390/app8050689.
- Xuan, P., C. Sun, T. Zhang, Y. Ye, T. Shen, and Y. Dong. 2019. Gradient boosting decision tree-based method for predicting interactions between target genes and drugs. Frontiers in Genetics 10:459. doi:10.3389/fgene.2019.00459.
- Zhang, Z., and C. Jung. 2020. Gbdt-mo: Gradient-boosted decision trees for multiple outputs. IEEE Transactions on Neural Networks and Learning Systems 32 (7):3156–67. doi:10.1109/TNNLS.2020.3009776.
- Zhang, B., J. Ren, Y. Cheng, B. Wang, and Z. Wei. 2019. Health data driven on continuous blood pressure prediction based on gradient boosting decision tree algorithm. IEEE Access 7:32423–32433. doi:10.1109/ACCESS.2019.2902217.
- Zhang, Y., F. Xiao, F. Qian, and X. Li. 2020. Vgm-rnn: Hrrp sequence extrapolation and recognition based on a novel optimized rnn. Institute of Electrical and Electronics Engineers Access 8:70071–70081. doi:10.1109/ACCESS.2020.2986027.
- Zhang, C., P. Zhong, M. Liu, Q. Song, Z. Liang, X. Wang, and L. Payá. 2022. Hybrid metric k-nearest neighbor algorithm and applications. Mathematical Problems in Engineering 2022:1–15. doi:10.1155/2022/8212546.