
 ?Mathematical formulae have been encoded as MathML and are displayed in this HTML version using MathJax in order to improve their display. Uncheck the box to turn MathJax off. This feature requires Javascript. Click on a formula to zoom.
ABSTRACT
Food safety emerges as a locus of heightened concern across societal strata. The establishment of a robust bulwark, embodied in an adept food detection mechanism and prescient early warning system, assumes paramount importance in safeguarding the populace. As artificial intelligence strides forward in the realm of food safety, this investigation endeavors to address the challenge of prognosticating the compliance rate of food safety through a unified RL-ALSTM (Reinforcement learning-attention-long-short term memory) framework, amalgamating reinforcement learning, attention mechanism, and Long Short-Term Memory (LSTM). Anchored by historical correlation data and food-specific attributes, the framework initiates its journey by deploying a dual-layer LSTM network to extract salient features. Subsequently, the model undergoes feature augmentation via attention mechanism and reinforcement learning methodologies, culminating in the realization of highly precise food safety predictions. Examination of experimental outcomes, leveraging both public and internally curated datasets, attests that the performance of the RL-ALSTM approach, as gauged by Root Mean Square Error (RMSE) and Mean Absolute Error (MAE), surpasses that of the disparate LSTM and traditional machine learning methods by lower than 0.001 in the safety ratio. This contribution furnishes a theoretical and methodological foundation for prospective advancements in the realm of food safety prediction.
Introduction
The realm of food quality and safety encompasses the holistic evaluation of all inherent components, necessitating scrutiny from both intrinsic and extrinsic perspectives. As the tapestry of life attains rapid refinement, the populace transcends mere sustenance concerns to embrace a fervent aspiration for elevated food quality. Contemporary governance evinces heightened vigilance toward food quality and safety; however, despite earnest efforts, incidents of compromised quality persist across disparate temporal and geographical landscapes, yielding deleterious consequences. In severe instances, these incidents precipitate significant casualties and injuries, not only entailing economic losses but also instigating societal disquiet (Jin et al. Citation2020). In the contemporary landscape, the agricultural product market manifests increasing diversification, dynamism, and complexity, thereby imposing exacting demands on the monitoring acumen vis-à-vis product quality. The erstwhile conventional quality prediction methodologies, characterized by singularity and simplicity, exhibited diminished predictive accuracy, precluding comprehensive prognostication of the agricultural product quality qualification rate within the prevailing milieu. Henceforth, an imperious imperative emerges to consummate the monitoring and forecasting of the food safety quotient through the auspices of extensive big data analysis and artificial intelligence (Gizaw Citation2019).
The crux of forecasting the passing rate of food safety quality resides in a regression paradigm predicated upon the amalgamation of diverse data sources. The present predictive endeavor entails synthesizing manifold information from manufacturers in conjunction, with historical passing rate data. Consequently, the intelligent prognostication of food safety, coupled with historical data analysis, unfolds through the prism of various artificial intelligence methodologies (Cui et al. Citation2023). Notably, technologies encompassing deep learning, machine learning, and natural language processing emerge as pivotal actors in this narrative. Deep learning models, typified by Convolutional Neural Networks (CNN), and Recurrent Neural Networks (RNN) prove instrumental in processing multimodal data, spanning images and text, thereby affording a more nuanced comprehension of food quality and safety. Concurrently, machine learning algorithms adeptly discern latent patterns and regularities within historical data, facilitating the anticipation of future food safety outcomes. In parallel, the deployment of natural language processing techniques assumes significance, facilitating the analysis of textual information pertinent to food, encompassing user feedback and news reports, thus enriching the informational tapestry (Ganjewar et al. Citation2020).
In the wake of the relentless evolution of neural network methodologies, their heightened efficacy in navigating nonlinear data has garnered intensified scrutiny in such problem domains. The distinctive prowess of neural network methods resides in their robust learning capability and adaptability. Deep neural networks, in particular, exhibit an innate capacity to autonomously assimilate features and distill valuable insights from voluminous and intricate datasets (Kumar et al. Citation2021). Capitalizing on the nonlinear fitting prowess inherent to neural networks, these models adeptly navigate intricate relationships within food data, thereby amplifying the expressive potency of predictive models. Initiating this foray into neural network methodologies, the Multilayer Perceptron (MLP) emerges as a straightforward yet efficacious model for handling structured data, proficiently capturing non-linear correlations between features and demonstrating adeptness in modeling numerical features (Lian et al. Citation2021). The Convolutional Neural Network (CNN) excels in processing image data germane to food, proficiently extracting spatially localized features through convolution and pooling operations. Furthermore, the Recurrent Neural Networks (RNN) and LSTM exhibit notable prowess in processing temporal data, discerning protracted dependencies within sequences (Shi et al. Citation2022). In the continuum of advancement, the Attention Mechanism and Transformer model augments the network’s capacity to process sequential data, dynamically honing in on salient segments of the input sequence and ameliorating prediction performance.
Meanwhile, the application of reinforcement learning in food safety has also garnered significant attention. Reinforcement learning, by interacting with the environment to learn optimal strategies, can make effective decisions in dynamic and complex food safety scenarios. For instance, reinforcement learning can be used to optimize parameters in the food production process to minimize the risk of food spoilage. Additionally, it can be integrated with neural networks to simulate various storage conditions and transportation routes, finding the best solutions to extend the shelf life and safety of food. By combining reinforcement learning with deep neural networks, we can not only enhance the predictive capabilities of models but also achieve more intelligent and automated food safety management. Through the integration of neural networks and reinforcement learning, we can further elevate the performance and adaptability of food safety prediction models. Leveraging the strategy optimization abilities of reinforcement learning alongside the feature extraction capabilities of neural networks, we can develop advanced food safety monitoring systems capable of effectively addressing real-world challenges.
Consequently, this paper undertakes the challenge of forecasting pass rates in the surveillance of food safety, contributing to the field with the ensuing advancements:
For the predicament concerning the qualification rate in food safety and quality testing, a model is devised predicated upon the product batch number and inherent characteristics. This model incorporates refined input design strategies to augment data performance.
The RL-ALSTM framework, predicated upon LSTM, is instantiated, effecting an elevation of the conventional model through the incorporation of the attention mechanism and reinforcement learning DQN network. This augmentation transpires through the LSTM layer, thereby enhancing the predictive prowess of the model.
Rigorous model testing is undertaken utilizing publicly available historical datasets. The prediction of the pass rate in food safety testing, coupled with the fitting of historical data, is executed on this foundation of real data. Results underscore the commendable performance of the RL-ALSTM method.
The rest of the paper is arranged as follows: related works for time-series analysis and application of the reinforcement learning are presented in Section 2. Section 3 established the RL-ALSTM model. Experiment results and related analysis are detailed described in Section 4 and Section 5 is the Discussion. The conclusion is drawn at last.
Related works
Time series analysis studies
In the investigation of the video security detection pass rate quandary, the crux lies in temporal sequence analysis predicated upon historical and diverse data fusion techniques. Temporal prediction methods encompass statistical approaches and machine learning paradigms. Statistical methods, tailored for smooth or periodic data series, find prominence in univariate time-series forecasting. Examples include the Autoregressive Integrated Moving Average (ARIMA) (Ho and Xie Citation1998) and its variants, as well as the Prophet (Taylor and Letham Citation2018) model introduced by Facebook, Inc. Sasan et al. devised a hybrid ARIMA-ANFIS algorithm, incorporating three distinct models to prognosticate future power losses in Iran (Barak and Sadegh Citation2016). Mazumdar and Kumar (Citation2016) augmented the ARIMA variant model with Kalman filtering and wavelet decomposition to enhance prediction, exemplified in forecasting data center stability. Ritika Singh et al., dissatisfied with existing Artificial Neural Network (ANN) methods, introduced deep learning for stock prediction, evaluating its efficacy based on multimedia data (charts) of Google stock prices from NASDAQ (Ritika and Shashi Citation2017). Extending the purview of time-series analysis, applications span diverse sectors such as sales and the food industry. Karthika et al. delved into short-term meteorological forecasting in semi-arid regions of India, employing the ARTMA forecasting methodology, with validation attesting to the model’s viability and high prediction accuracy (Karthika and Krishnaveni Citation2017). L.B. Lokoang et al. optimized the existing sequential logistic regression prediction model in the realm of food security, presenting an enhanced prediction model as a benchmark for adjudicating food quality and safety (Lokosang, Ramroop, and Hendriks Citation2011). Njubi, Wakhungu, and Badamana (Citation2011) scrutinized dairy quality and safety, employing both multiple linear regression and neural network models for experimental validation. Comparative analysis favored the artificial neural network warning model for its enhanced accuracy, offering assurance for the quality and safety detection of dairy products (Njubi, Wakhungu, and Badamana Citation2011). Chen and Ou (Citation2009), considering sales data from the target shop, neighboring shops, and weather data, explored the prediction of perishable food products. This endeavor aimed to ensure food safety and safeguard individual interests through the analysis of food decay.
Time-series analysis has important significance and many benefits in the field of food safety. Firstly, it can effectively process and analyze a large amount of historical data, identify patterns of food safety and quality changes, help predict food decay time, and evaluate food safety. By integrating multimodal data, including temperature, humidity, lighting, and other information, time-series analysis can provide more accurate and comprehensive food safety predictions, meeting the needs of different scenarios. Secondly, time-series analysis methods, such as statistical regression models and neural network models can adapt to prediction tasks of different complexity levels. In the field of food safety, these models can be used to monitor and predict the entire process of food production and consumption, ensuring the safety of food throughout the entire supply chain. In addition, these methods can also detect and warn potential safety hazards in a timely manner, effectively reducing the occurrence of food safety incidents. Through time-series analysis, food preservation and logistic management can also be optimized. Understanding the decay patterns of food under different conditions can guide enterprises to take appropriate storage and transportation measures, extend the shelf life of food, reduce waste, and improve economic benefits. Meanwhile, time-series analysis can also provide a scientific basis for food safety supervision, support policy formulation and implementation, and ensure public health.
Current status of research on enhanced learning
Reinforcement learning, one of the triumvirate-learning paradigms in machine learning alongside supervised and unsupervised learning, delves into how intelligences glean insights from interactions with their environment. In the supervised learning domain, the learner acquires inference or generalization skills from a labeled dataset provided by a supervisor. Unsupervised learning, in contrast, involves the learner discerning patterns or intrinsic structures within an unlabeled dataset. Reinforcement learning, akin to human and animal learning, centers around the acquisition of knowledge through dynamic interactions with the environment. The value function-based approach, synonymous with tabular solving, converges the policy to the optimal by updating the value function. Sutton (Citation1988) introduced Temporal Difference (TD) learning, demonstrating its convergence under the condition of an absolutely decreasing learning rate for systems with Markovianity. Building upon TD learning, Watkins and Dayan (Citation1992) proposed Q-learning, iteratively updating the state-action value function and providing a proof of convergence. Q-learning, also known as offline TD learning, represents a highly effective model-independent reinforcement learning algorithm, ensuring convergence under specific conditions with a greedy strategy to update the value function. Tesauro (Citation1991) innovatively employed the TD(λ) algorithm and neural networks to develop TD-Gammon, the pioneering AI backgammon program. The strategy gradient-based approach, exemplified by the REINFORCE algorithm proposed by Williams (Citation1992) employs stochastic gradient descent to enhance strategy performance progressively. Sutton et al. (Citation1999) further refined this strategy gradient algorithm by substituting the cumulative reward with the Q-value of the action, reducing the variance in gradient estimation.
Konda and Tsitsiklis (Citation1999) introduced the Actor-Critic algorithm, amalgamating strategy gradient and value function, thereby combining the advantages of rapid optimal action selection and single-step update. Mnih et al. (Citation2013) advanced the field with deep Q-learning, integrating convolutional neural networks to fit the value function and introducing an experience replay mechanism for improved data efficiency. Double DQN, proposed by Van Hasselt, Guez, and Silver (Citation2016), utilizes two Q networks with different parameters to estimate Q-values and select actions, mitigating the noise correlation between the processes. Wang et al. (Citation2016) contributed Dueling DQN, a novel network structure that disentangles Q-values into state values independent of actions and state values dependent on actions. This decoupling of state value and Q-value enhances accuracy and robustness in estimating the value function, yielding more resilient learning outcomes.
The aforementioned research underscores that investigations into food safety necessitate a comprehensive approach beyond the final product stage. Monitoring the entire industrial chain becomes imperative, with the analysis of pertinent historical data serving as a means to comprehend the prevailing food safety landscape. The present landscape of food safety research reveals a predilection for time-series analysis rooted in multivariate regression. Leveraging deep learning networks, coupled with the advancements offered by reinforcement learning technology, fortifies the informational underpinning within the food safety industry. This augmentation facilitates the accomplishment of food safety risk prediction, thereby ensuring the safety of consumables in the video security domain.
Methodology
The long-short term memory network
RNN belongs to a category of neural networks designed for the processing of sequential data. Diverging from conventional feed-forward neural networks, RNNs exhibit a recurrent architecture that facilitates the transmission of information through the network, enabling the incorporation of dependencies within sequences. This characteristic empowers RNNs to excel in tasks demanding an understanding of contextual relationships, such as language processing, time-series analysis, and other applications reliant on sequential dependencies. In a rudimentary RNN, the hidden state of the network undergoes updates based on the current input and the hidden state from the preceding time step, as illustrated in EquationEquation (1)(1)
(1) :
where is the hidden state of the current time step and
is the input of the current time step, and
and
are the weight matrices, and
is the bias vector, and
is the activation function. While Recurrent Neural Networks (RNNs) offer notable advantages in handling sequential data, a significant challenge arises in their limited capacity to capture long-term dependencies. This limitation stems from the propensity for gradients to rapidly diminish or escalate during backpropagation, leading to either a vanishing gradient or a gradient explosion, particularly on lengthy sequences. To address this issue, LSTM architecture was introduced. LSTM incorporates memory cells and a gate mechanism, enabling the network to selectively retain or discard input information (Staudemeyer and Morris Citation2019). The structural configuration of LSTM is depicted in :
Figure 1. The LSTM cell.
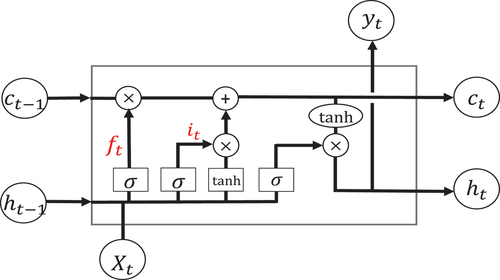
LSTM incorporates three pivotal gating controls: the Input Gate, Forget Gate, and Output Gate. These gates empower the network to make decisions at each time step regarding the entry of information into the memory cell, the information to be forgotten, and the manner in which the contents of the memory cell are to be output. The update processes of the input gate and forget gate, denoted prominently in , are elucidated in EquationEquations (2)(2)
(2) and (Equation3
(3)
(3) ):
After completing the control of input and forgetting, the updating of the memory unit is carried out, and the specific updating process is shown in EquationEquations (4)(4)
(4) –(Equation5
(5)
(5) ):
After completing the gate control and cell update, we performed the output gate and cell output, the results of which are shown in EquationEquations (6)(6)
(6) and (Equation7
(7)
(7) ):
where is the sigmoid function, and
denotes element-by-element multiplication, and
and
are the weight matrix and bias vector. The LSTM part of the data updating process can be well completed by the above formulae.
The reinforcement learning
Reinforcement Learning (RL) embodies a machine learning paradigm where an intelligent agent learns to maximize cumulative reward signals by interacting with its environment. Deep Q Network (DQN), an algorithm within reinforcement learning, is designed to acquire optimal strategies for actions in different states (Li, Ni, and Dressler Citation2021). The salient steps in its core process are outlined as follows: (1) State representation; defining the state space in the problem, i.e., the different environmental states that the intelligence may be in. (2) Action space: defining the set of actions that can be taken by the intelligent body. q-value function: (3) Introducing a Q-value/action-value function, which represents the expected value of the long-term cumulative reward for taking a certain action in a given state; (4) Estimation of the Q-value function using a deep neural network. (5) Experience playback randomly draws a small batch of experience samples from the buffer and uses them to update the weights of the neural network. (6) Introducing a target Q network for stable training. (7) Temporal Difference (TD) error is used to update the Q-values. Finally, its exploration and exploitation is completed, and the overall process is shown in :
Figure 2. The DQN and training process.
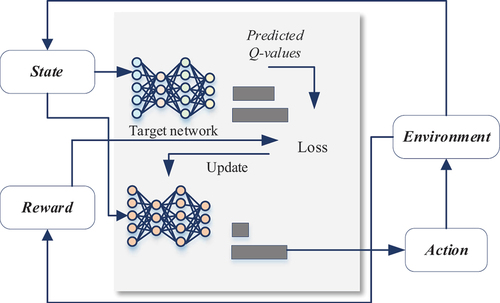
During training, achieving a balance between exploration and exploitation is crucial. The commonly employed ε-greedy strategy selects a random action with probability ε and the currently estimated optimal action with probability 1-ε. The foundational formulation of DQN involves using the Temporal Difference (TD) error introduced in step (7) to update the Q-value. The Q updates can be expressed through the following equation:
Where is in the state
Taking action
The estimate of the
value
is the immediate reward that the intelligence receives after performing the action
immediate reward it receives after performing the action
is the value of the next state the intelligence enters after performing the action
the next state entered after performing the action
is the discount factor, which indicates the importance of future rewards
is the learning rate, which indicates the step size of the update. The training of reinforcement learning can make the original network more capable of solving problems in complex environments and situations with incomplete information.
The RL-ALSTM for the food safety prediction
After completing the introduction of reinforcement learning and LSTM, we built the RL-ALSTM model whose overall structure is shown in :
Figure 3. The RL-ALSTM framework for the food safety ratio prediction.
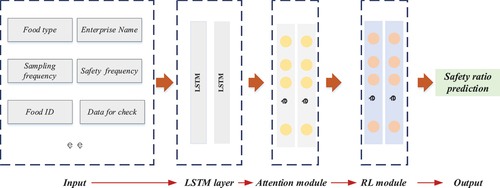
The framework comprises five key components. Initially, it begins with the digitization of relevant indicators based on the collected dataset and data characteristics. The primary indicators include food type, enterprise, and six additional factors. Concurrently, historical data is incorporated to achieve a multidimensional input framework. Once data confirmation in the input layer is completed, the framework proceeds with feature extraction and preliminary classification through the LSTM layer. To enhance the model’s capacity to capture key information more effectively, an attention mechanism is introduced between the reinforcement learning and LSTM layers. The attention mechanism dynamically directs the network to focus on or disregard different segments of the sequence during input sequence processing. This adaptability allows the neural network to flexibly adjust its focus of attention at each time step or location, enhancing the model’s robustness and adaptability to diverse input contexts. Subsequently, the extracted features are fed into the reinforcement learning module for the reinforcement of attentional features. Finally, the model produces its output, culminating in the prediction of the percentage of safety passes in the food sampling process. This prediction is achieved through the incorporation of multimodal and data fusion features, providing a comprehensive approach to food safety assessment. The algorithm process of this framework is shown in Algorithm 1:
Experiment result and analysis
Experiment setup
For food safety assessment, the predominant approach involves monitoring-related products through food sampling and testing. However, conducting large-scale data testing can be challenging. Hence, this paper opts for predictive analysis based on existing food data. Specifically, the food safety sampling inspection dataset is selected for model testing. This extensive dataset encompasses over 500,000 records of food-level sampling information, organized by year. The predictive analysis in this paper focuses on the sequence of each year.
Given the abundance of data features, the feature extraction process involves utilizing six types of statistical features, as depicted in . These selected statistical features contribute to the comprehensive analysis of the dataset and facilitate the predictive modeling of food safety outcomes.
Table 1. Features used for the food safety prediction.
We selected the data with more comprehensive feature dimensions from each data for model training and related prediction, and the number of valid data entries collected from each dataset was about 2,000, on the basis of which we completed the training of the model you. At the same time, we chose the RMSE and MAE indicators as the evaluation table of the final price prediction, which is calculated as shown in equations (9) and (10):
where n is the sample size, yi is the actual value, and is the corresponding predicted value. RMSE is the square root of the root mean square error, which is used to measure the overall error between the predicted and actual values. RMSE emphasizes the importance of larger errors by squaring the error, while MAE directly takes the absolute value of the error, which puts more emphasis on the overall accuracy of the model.
Experiment result and analysis
Following the construction of the model and the validation of the data, a comparative test was undertaken, evaluating the prediction performance of different methods, including reinforcement learning, attention mechanism, and LSTM, on this dataset. The evaluation specifically focused on the last 5 years of data for model prediction. The data values from the last 15 months were selected as the prediction index. During the testing phase, the learning step size and output step size were set to 15. The results of the comparison test are illustrated in .
Figure 4. The prediction result for the recent 15 months.
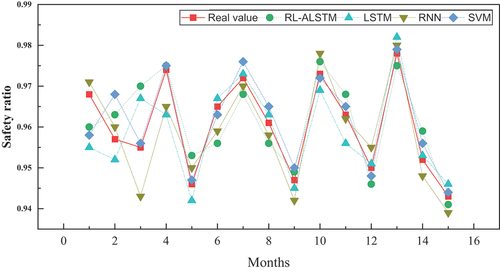
In the comparative analysis, we selected the basic LSTM method and the RNN method. Additionally, we included the SVM method, known for its robust application in machine learning, for a more comprehensive comparison. As depicted in , it is evident that each method aligns well with the anticipated trend in the security detection ratio.
To provide a more thorough evaluation of the models, we calculated the RMSE and MAE indicators. The results are illustrated in , offering a quantitative assessment of the predictive accuracy of each method.
Figure 5. The RMSE and MAE for the comparison.
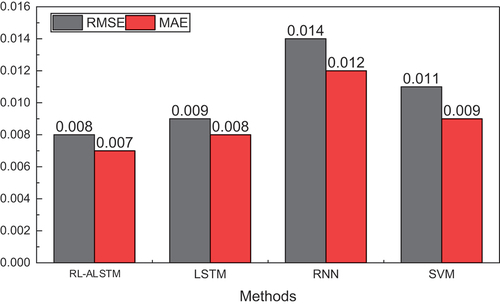
As illustrated in , the RL-ALSTM method proposed in this paper exhibits lower RMSE and MAE compared to the comparison methods. Notably, when the attention and RL modules are not utilized, the RMSE of the standalone LSTM is higher at 0.009 and 0.008, in contrast to the framework proposed in this paper, which yields lower values at 0.008 and 0.007, respectively. These improvements are particularly significant given the nature of the safety percentage data, which is expressed in the form of a percentage.
Following the completion of the 15-month prediction, a 10-month fitting test was conducted by setting the output. To validate the fitting effect of the model, a random selection of 10 months was chosen for the fitting test, including the proportion of food safety analysis when the data were missing. The fitting results for these 10 months are displayed in .
Figure 6. The prediction result for the middle 10 months.
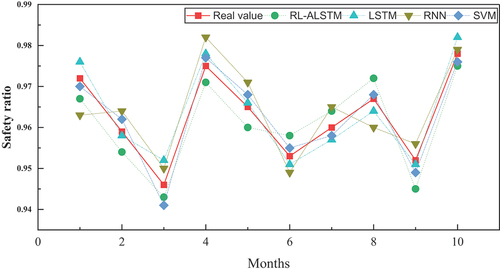
In , the trends of the actual data and the prediction results for each method closely resemble those in , indicating that these methods effectively capture and fit the trend of the real data. To provide a more comprehensive evaluation of model performance, relevant metrics were calculated. The results of these metrics are depicted in .
Figure 7. The RMSE and MAE for the comparison in the data fitting for 10 months.

In , it is evident that the proposed method in this paper yields more effective fitting results over the course of 10 months. The overall RMSE and MAE for this method are 0.003 and 0.002, respectively, which are markedly lower than those of the standalone LSTM method at 0.006. This outcome signifies that the proposed method exhibits superior applicability, particularly in scenarios involving the prediction of a small amount of data following a large dataset.
The practical test for the proposed model on the local datasets
After conducting data testing on the public dataset, we proceeded to test our own dataset by analyzing the data from the agricultural product quality and safety traceability and the provincial agricultural product quality and safety rapid testing system in Fujian region. The data were normalized, and the input and output settings mirrored the construction of the framework depicted in . The prediction focused on the safety ratio of the last 15 sampling results. The outcomes of this prediction are illustrated in .
Figure 8. The prediction result for the recent 15 samples.
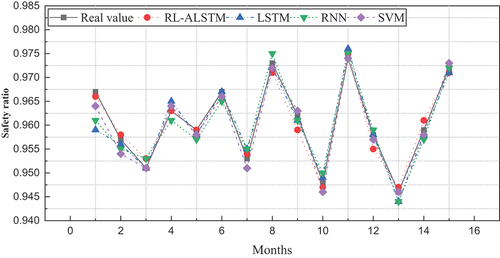
reveals that, given the limited amount of data in practical application, the disparity between the prediction results of different methods remains small. However, distinct curves represented by individual colors in this paper demonstrate that the curves produced by the RL-ALSTM method are closer to the actual curves. Building on this observation, we conducted comparisons of the RMSE and MAE. The results of these comparisons are presented in .
Figure 9. The RMSE and MAE for the comparison recent in 15 samples.
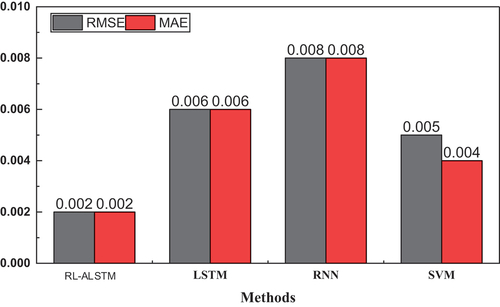
In , the small amount of data contributes to small estimation errors for each model. The RMSE and MAE values for the RL-ALSTM method proposed in this paper are both 0.002, indicating lower values compared to the LSTM and RNN methods. This substantiates that the incorporation of the attentional mechanism and the reinforcement learning method enhances the prediction performance of the model.
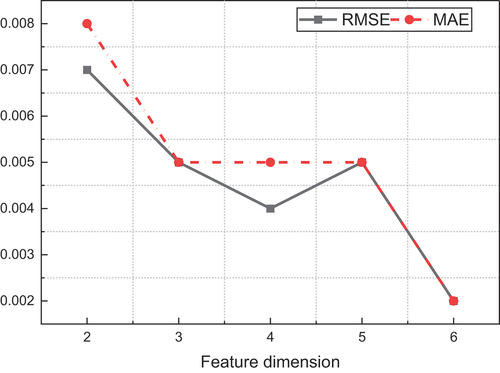
To conduct a comprehensive analysis of the model performance, we evaluated the model under varying dimensional features and calculated the corresponding RMSE and MAE. The results are depicted in . The findings from indicate that the model’s performance improves with the increase in feature dimensions. This observation suggests that, for this prediction problem, expanding the data volume continuously enhances the model’s performance, with the MAE index exhibiting the most significant improvement – from the initial 0.008 to 0.002.
Figure 10. The feature fusion effect on the RL-ALSTM concerning RMSE and MAE.
Discussion
In this study, we approach the prediction problem of food safety by developing an intelligent qualification rate prediction model. Leveraging historical data on food safety qualification rates and intrinsic characteristics of food products as inputs, we conducted fitting experiments under the conditions of available historical data. The results demonstrate that the proposed RL-ALSTM method, based on reinforcement learning and the attention mechanism, exhibits clear advantages compared to the single LSTM method. The combined model effectively captures temporal information and long-term dependencies in food safety prediction through LSTM. The introduction of the attention mechanism enhances the focus on critical time steps, addressing information imbalance in long sequences. Reinforcement learning enables adaptive adjustment of the model’s strategy based on environmental feedback, improving adaptability to changing food safety situations. The integration of these methods emphasizes sequence modeling, information selection, and strategy optimization, achieving end-to-end learning and enhancing the accuracy and robustness of food safety prediction.
By leveraging extensive detection data from diverse categories of food in the market, we can predict short-term pass rates of food quality. This approach allows us to effectively grasp the trends in food quality compliance over a short period, thereby aiding in the stable operation of the food market and fostering industry development. Establishing a food quality safety prediction system based on these predictive models helps government agencies manage and monitor the entire food production process. The integration of quality safety risk warnings into this system offers critical support to local detection departments, providing a solid foundation for quality assessments and judgments. This has significant implications for the safety management of the food market, ultimately enhancing consumer confidence in the entire agricultural product sector. By employing historical quality safety data, along with features such as batch numbers, manufacturers, and types, we can achieve intelligent regulation of the food market. This enables the timely detection and prediction of potential quality safety issues, thereby reducing health risks associated with food safety problems and protecting consumer rights. Ultimately, this approach promotes the healthy development of the food industry, ensuring a safer, more reliable consumption market for agricultural products.
Conclusion
In this paper, we propose an RL-ALSTM model for predicting food safety inspection pass rates, incorporating reinforcement learning (DQN) and an attention mechanism. This model aims to provide technical support for intelligent food safety and health monitoring. The framework begins by extracting features from multidimensional data, including historical food safety test pass rates and related intrinsic batch numbers and brand categories, through LSTM. These features are then enhanced with adaptive weights by introducing the attention mechanism and reinforcement learning, ultimately achieving high-precision predictions.
The test results on the public dataset demonstrate the superior performance of the RL-ALSTM method compared to the single LSTM method and traditional SVM machine learning method under both RMSE and MAE metrics. Additionally, results from the self-constructed dataset reveal improved performance in both prediction and historical data fitting, with RMSE and MAE metrics below 0.002 in the fitting task involving nearly 15 samples, attaining high accuracy in safety compliance prediction. These findings underscore the utility of the proposed framework for food safety prediction, offering valuable technical support for the industry’s future development.
In future research endeavors, our primary objective will be to significantly enhance the generalization performance of the current model. This enhancement will enable the model to be more robust and adaptable across a diverse range of food types and scenarios, ensuring its effectiveness in varied and complex environments. By expanding the model’s capabilities, we can address a broader spectrum of food safety challenges. Additionally, a key focus will be on the meticulous normalization and systematic organization of data. Establishing a standardized paradigm for data collection and utilization is crucial for consistent and reliable food safety monitoring. This includes developing comprehensive guidelines for data acquisition, ensuring data quality and integrity, and implementing uniform procedures for data preprocessing and analysis. Furthermore, collaboration with industry stakeholders and regulatory bodies will facilitate the sharing of best practices and the continuous improvement of the model based on real-world feedback. Ultimately, our goal is to establish a robust framework that advances the scientific understanding of food safety and provides practical solutions for intelligent monitoring, ensuring the health and safety of consumers and promoting sustainable practices within the food industry.
Acknowledgements
The authors would like to thank the anonymous reviewers who have provided valuable comments on this article.
Disclosure Statement
No potential conflict of interest was reported by the author(s).
Data Availability Statement
The dataset employed in this investigation is made readily available and accessible to interested parties.
Additional information
Funding
References
- Barak, S., and S. S. Sadegh. 2016. Forecasting energy consumption using ensemble ARIMA–ANFIS hybrid algorithm. International Journal of Electrical Power & Energy Systems 82:92–19. doi:10.1016/j.ijepes.2016.03.012.
- Chen, F. L., and T. Y. Ou. 2009. Gray relation analysis and multilayer functional link network sales forecasting model for perishable food in convenience store. Expert Systems with Applications: An International Journal 36 (3):7054–63. doi:10.1016/j.eswa.2008.08.034.
- Cui, F., S. Zheng, D. Wang, X. Tan, Q. Li, J. Li, and T. Li. 2023. Recent advances in shelf life prediction models for monitoring food quality. Comprehensive Reviews in Food Science and Food Safety 22 (2):1257–84. doi:10.1111/1541-4337.13110.
- Ganjewar, P. D., S. Barani, S. J. Wagh, and S. Sonavane. 2020. Food monitoring using adaptive naïve Bayes prediction in IoT[C]. Intelligent Systems Design and Applications: 18th International Conference on Intelligent Systems Design and Applications (ISDA 2018), 424–34, Vellore, India: Springer International Publishing, December 6-8.
- Gizaw, Z. 2019. Public health risks related to food safety issues in the food market: A systematic literature review. Environmental Health and Preventive Medicine 24 (1):1–21. doi:10.1186/s12199-019-0825-5.
- Ho, S. L., and M. Xie. 1998. The use of ARIMA models for reliability forecasting and analysis. Computers & Industrial Engineering 35 (1–2):213–16. doi:10.1016/S0360-8352(98)00066-7.
- Jin, C., Y. Bouzembrak, J. Zhou, Q. Liang, L. M. van den Bulk, A. Gavai, N. Liu, L. J. van den Heuvel, W. Hoenderdaal, and H. J. P. Marvin. 2020. Big data in food safety-A review. Current Opinion in Food Science 36:24–32. doi:10.1016/j.cofs.2020.11.006.
- Karthika, M., and V. Krishnaveni. 2017. Thirunavukkarasu.Forecasting of meteorological drought using ARIMA model. Indian Journal of Agricultural Research 51 (2):103–11. doi:10.18805/ijare.v0iOF.7631.
- Konda, V., and J. Tsitsiklis. 1999. Actor-critic algorithms. Advances in Neural Information Processing Systems 12:12.
- Kumar, I., J. Rawat, N. Mohd, S. Husain, and R. Khan. 2021. Opportunities of artificial intelligence and machine learning in the food industry. Journal of Food Quality 2021:1–10. doi:10.1155/2021/4535567.
- Li, K., W. Ni, and F. Dressler. 2021. LSTM-characterized deep reinforcement learning for continuous flight control and resource allocation in UAV-assisted sensor network. IEEE Internet of Things Journal 9 (6):4179–89. doi:10.1109/JIOT.2021.3102831.
- Lian, D., Z. Yu, X. Sun, and S. Gao. 2021. As-mlp: An axial shifted mlp architecture for vision. arXiv preprint arXiv:2107.08391.
- Lokosang, L. B., S. Ramroop, and S. L. Hendriks. 2011. Establishing a robust technique for monitoring and early warning of food insecurity in post-conflict South Sudan using ordinal logistic regression. Agricultural Economics Research, Policy and Practice in Southern Africa 50 (4):101–30. doi:10.1080/03031853.2011.617902.
- Mazumdar, S., and A. S. Kumar. 2016. Forecasting data center resource usage: An experimental comparison with time-series methods. International Conference on Soft Computing and Pattern Recognition, 151–65, Cham: Springer.
- Mnih, V., K. Kavukcuoglu, D. Susskind, A. Graves, L. Abtonoglou, D. Wierstra, and M. Riedmiller. 2013. Modeling natural images using gated MRFs. IEEE Transactions on Pattern Analysis & Machine Intelligence 35 (9):2206–22. doi:10.1109/TPAMI.2013.29.
- Njubi, D. M., J. W. Wakhungu, and M. S. Badamana. 2011. Prediction of second parity milk yield of kenyanb holstein-friesian dairy cows on first parity information using neural network system and multiple linear regression methods. Livestock Research for Rural Development 23 (3):6.
- Ritika, S., and S. Shashi. 2017. Stock prediction using deep learning. Multimedia Tools & Applications 76 (18):18569–84. doi:10.1007/s11042-016-4159-7.
- Shi, X., Z. Wang, H. Zhao, S. Qiu, R. Liu, F. Lin, and K. Tang. 2022. Threshold-free phase segmentation and zero velocity detection for gait analysis using foot-mounted inertial sensors. IEEE Transactions on Human-Machine Systems 53 (1):176–86. doi:10.1109/THMS.2022.3228515.
- Staudemeyer, R. C., and E. R. Morris. 2019. The down syndrome-associated protein, regulator of calcineurin-1, is altered in Alzheimer’s disease and dementia with Lewy Bodies. arXiv preprint arXiv:1909.09586.Journal of Alzheimer’s Disease and Parkinsonism 9 (2). doi:10.4172/2161-0460.1000462.
- Sutton, R. S. 1988. Learning to predict by the methods of temporal differences. Machine Learning 3 (1):9–44. doi:10.1007/BF00115009.
- Sutton, R. S., D. Mcallester, S. Singh, and Y. Mansour. 1999. Policy gradient methods for reinforcement learning with function approximation. Advances in Neural Information Processing Systems 12:12.
- Taylor, S. J., and B. Letham. 2018. Forecasting at scale. American Statistician 72 (1):37–45. doi:10.1080/00031305.2017.1380080.
- Tesauro, G. 1991. Practical issues in temporal difference learning. Advances in Neural Information Processing Systems 4:4.
- Van Hasselt, H., A. Guez, and D. Silver. 2016. Deep reinforcement learning with double q-learning. Proceedings of the AAAI conference on artificial intelligence 30(1).
- Wang, Z., T. Schaul, M. Hessel, H. Hessel, M. Lanctot, and N. Freitad. 2016. Dueling network architectures for deep reinforcement learning. Proceedings of the International conference on machine learning, PMLR 48:1995–2003.
- Watkins, C. J., and P. Dayan. 1992. Q-learning. Machine Learning 8 (3):279–92. doi:10.1007/BF00992698.
- Williams, R. J. 1992. Simple statistical gradient-following algorithms for connectionist reinforcement learning. Machine Learning 8 (3):229–56. doi:10.1007/BF00992696.