
 ?Mathematical formulae have been encoded as MathML and are displayed in this HTML version using MathJax in order to improve their display. Uncheck the box to turn MathJax off. This feature requires Javascript. Click on a formula to zoom.
ABSTRACT
Consumer trust is a crucial issue in social commerce, i.e. how to help consumers find trustworthy products. However, the current evaluation system in the market has significant shortcomings. This can be improved by trust and reputation modeling, but the existing models have flaws. This paper proposes an adaptive distributed trust model. The main features of its algorithm include (1) When calculating product trustworthiness, evaluations from consumers themselves, social networks, and e-commerce platforms are integrated, and the importance of these three sources of trust can change adaptively as consumers learn. (2) When selecting product providers and advisers, the Softmax algorithm is used to deal with the “exploration or exploitation” dilemma in reinforcement learning. (3) Consider the emotional attachment between consumers and advisers. (4) Design a blacklist mechanism to determine alternative product providers. The main contribution of this study lies in this model. Comparison with existing typical models shows that in various market scenarios, or when different market features change, this model can provide consumers with higher utility. This is because it better fits the characteristics of social commerce and has stronger adaptability. The results of this paper can not only provide a foundational model for related research but also can be used to develop a novel distributed product evaluation system for social commerce.
Introduction
Social commerce is e-commerce arising from or influenced by social networks (Yadav et al. Citation2013). It primarily takes two forms: first, integrating social elements into e-commerce platforms, such as Taobao and Amazon; second, incorporating e-commerce elements into social media platforms, such as TikTok and Facebook. Social commerce plays a key role in the transformation of the digital economy (García et al. Citation2019), and it is set to sweep the world. According to Accenture (Citation2022) research, global social commerce sales have reached $492 billion by 2021, and are growing rapidly, and are expected to reach $1.2 billion by 2025.
However, the social commerce market has numerous competing products with different utility (this utility refers to the overall performance of the product across various dimensions, e.g. quality, price, logistics, services, etc.), and consumers are subjective and have different preferences for products, moreover there are market changes and information asymmetries. All of these make it difficult for consumers to accurately identify the utility of products. Therefore, there is a need for trust and reputation mechanism to help consumers better predict the product trustworthiness, thus improving their satisfaction. The current social commerce platform adopts a centralized evaluation system, allowing consumers to leave evaluations on products for others to reference. However, there are significant problems in these evaluation systems, i.e., sellers manipulate evaluations to deceive buyers. Driven by profit, dishonest sellers may collude with evaluators in making fake evaluations to promote or demote products (Ji et al. Citation2020). There are even professional fake evaluation makers who complete the evaluation tasks assigned by sellers, seriously affecting the fame of the platform (Li et al. Citation2021). According to Statista (Citation2020) survey of Amazon buyers in the United States, as of February 2020, only 13.6% fully trust Amazon’s evaluations, 55.6% somewhat trust, 24.6% only trust from verified buyers, and 6.2% do not trust at all. Fakespot (Citation2021) research shows that about 40% of Amazon’s evaluations are unreliable in 2020. Even if the evaluation is real, consumers’ subjectivity means that a product suitable for others may not be suitable for them. Furthermore, although many platforms have policies to allow consumers to return and exchange products if dissatisfied (Al-Adwan and Yaseen Citation2023), there are still many products that cannot apply to such policies. Even when applicable, returns and exchanges will bring consumers non-negligible costs, such as money, time, and mood.
The current unreliability of product evaluation systems greatly restricts the better development of the social commerce market. To address this issue, better trust and reputation models can be employed to design new evaluation systems. These models require evaluation and selection mechanisms, enabling consumers to assess products more accurately and make more appropriate choices. However, many existing models not only have flaws in algorithms but also are not well suited to the characteristics of social commerce. Therefore, this paper creates a new adaptive distributed model for the social commerce market. Compared to existing research, the main contributions are as follows: (1) Enhancing adviser evaluation algorithms and considering the emotional attachment between consumers and advisers, thereby improving the reliability of trusted information from social networks, better dealing with the prevalence of fake evaluations in markets. (2) Designing a consumer learning mechanism that dynamically adjusts the importance of different sources of trust, thus better adapting to market changes. (3) Introducing a blacklist mechanism for more effectively selecting suitable product providers. (4) When selecting advisers and providers, employing the Softmax algorithm based on the Boltzmann distribution to address the “exploration or exploitation” dilemma in reinforcement learning, optimizing the selection process. Experimental results demonstrate that based on this model, consumers can effectively evaluate the trustworthiness of products, make more informed selection, obtain higher utility, thereby promoting repeat purchase intentions, and driving the development of the social commerce market.
The remainder of the paper is organized as follows. Section 2 reviews related research. Section 3 establishes a trust model and analyzes its structure and main algorithms. Section 4 develops a testbed using agent-based modeling and conducts simulations, and the effectiveness of the model is validated compared with other typical models. Section 5 explains the theoretical and practical implications; Finally, section 6 concludes.
Related Work
According to different research objectives, some scholars refer to trust model as reputation model or trust and reputation model. Trust reflects an individual’s estimation of something or someone. Reputation emphasizes others’ general evaluation of something or someone. Trust depends on reputation, reputation stems from trust. These two are closely related. As this paper focuses on studying the trust-building mechanism for the consumer to facilitate the acquisition of more trustworthy products, the proposed model is called a trust model, i.e. a computational model for product trustworthiness evaluation and selection. This section reviews the typical trust and reputation models over the years and analyzes their prominent characteristics and shortcomings.
Similar to the evaluation system commonly used in current e-commerce platforms, Sporas is a centralized reputation model (Zacharia and Maes Citation2000), which aggregates each buyer’s evaluation of the seller to obtain the final evaluation. The algorithm is more reasonable than previous models, such as considering the impact of time, where more recent evaluations hold higher weights. However, Sporas only keeps the most recent rating of each evaluator, so it is susceptible to rating fluctuations. Furthermore, when the buyer exhibits subjectivity, intentionally defames, or colludes with the seller, it becomes challenging to ensure the accuracy of evaluation. To enhance the reliability of such models, some scholars introduce encrypted certificates of trust, and consider not only time but also the reliability of the evaluator as weights (Botelho et al. Citation2009). But there are still shortcomings: first, the reliability of the evaluators depends on others’ ratings, and a centralized mechanism is also used, so there is a risk of evaluation manipulation similar to the above; second, it assumes that encryption technology prevents sellers from tampering with evaluations, but sellers can still distort evaluations in other ways, such as bribing buyers for positive ratings.
Given the significant problems of centralized models, many researchers put forward distributed models. Yu and Singh (Citation2002, Citation2003a, Citation2003b) design a distributed trust and reputation model based on social networks. Through the referral system, if agent a (evaluator) needs to evaluate the trustworthiness of agent b, it can consult its neighbor c within the social network, if c has experience about b (i.e. c is the witness), it will provide its evaluation of b; if no experience, c will introduce its neighbor d to a, and a can consult d. This is repeated; ultimately, all evaluations gathered are integrated to form the final evaluation of b. However, this model does not combine the evaluator’s own evaluation and witness evaluations and only considers witness evaluations when the evaluator lacks own evaluation (Sabater and Sierra Citation2005). Moreover, it assumes that dishonest witnesses deceive everyone without considering the deception probability, which is inconsistent with the reality of social commerce.
To comprehensively evaluate the trustworthiness of providers from multiple aspects, Sabater and Sierra (Citation2002) created the classic trust and reputation model ReGreT, including the following: (1) direct trust is based on the evaluation obtained by direct interaction between the consumer and the provider; (2) witness reputation is based on the evaluation of the provider from other consumers in social networks; (3) neighborhood reputation is depended on the neighbors of the provider and their relations with it; (4) system reputation is a default reputation value based on the role played by the provider. However, this model does not handle the problem of deception (Ramchurn, Huynh, and Jennings Citation2004). It also does not elaborate on how to construct the social network. Furthermore, the algorithm of direct trust has errors (Huynh, Jennings, and Shadbolt Citation2006). Many parameter selection methods have not been determined, so they cannot really be used in e-commerce (Gan et al. Citation2011).
Another representative distributed trust and reputation model is FIRE. It covers four sources for providing trust-related information: the consumer’s direct experiences in interaction with the provider (interaction trust), the witness evaluations from other consumers that interacted with the provider (witness reputation), role-based rules (role-based trust), and third-party references offered by the provider (certified reputation). Rating calculations for each trust source consider weights such as time and witness credibility. The reliability of the rating is also taken into account. The trust values from the four sources are combined into an overall value, which represents the trustworthiness of the provider (Huynh, Jennings, and Shadbolt Citation2005, Citation2006). FIRE can adapt to the dynamic environment to some extent, but it still has limitations: (1) The selection of witnesses relies solely on their distance from the provider. (2) It is a general model that, if applied to a specific domain, the accuracy of the witness credibility calculation needs improvement, such as considering the relationship between consumers and witnesses. (3) The witness credibility algorithm has flaws: first, it discards consumers’ past evaluations and only compares their current evaluations with those of witnesses, which makes it susceptible to market fluctuations; secondly, it does not adequately consider the impact of consumer subjectivity. (4) Dishonest witnesses deceive all consumers. (5) Consumers select alternative providers based only on distance, which prevents the removal of already identified inferior providers. (6) Providers rank the consumer evaluations, keeping only some higher-ranked ones and discarding the rest. This deviates from the reality of most e-commerce situations and can greatly affect the model performance when there are many fake evaluations.
It is generally believed that among multiple trust sources, evaluations based on buyers’ personal experiences are more reliable. Therefore, Zhang and Cohen (Citation2008) propose a personalized trust model (PTM) to evaluate the trustworthiness of sellers and advisers from both private and public dimensions. However, its disadvantages are as follows: (1) When calculating the public reputation of advisers, determining the accuracy of an adviser evaluation is based on whether it aligns with the majority of evaluations. However, this may not be true, especially in environments with many fake evaluations. (2) When calculating the private reputation of advisers, the adviser and the buyer need to have purchase experiences from the same seller, but does not indicate how to deal with it if there is no such situation. (3) Only 0 or 1 is used to represent the evaluation value, which is not accurate enough. Xu et al. (Citation2017) improve this and propose a trust model based on multi-attribute evaluation, but other limitations of PTM still exist.
Shehada et al. (Citation2018) point out limitations in existing trust and reputation models based on multiple trust sources, namely the weights of each source are fixed. Therefore, an adaptive model is given to evaluate the trustworthiness of providers from both direct and indirect trust. However, the model operates based on special assumptions, such as: (1) The evaluator has at least two transaction experiences with each provider; (2) To calculate the overall evaluation, there must be honest witnesses. Additionally, malicious witnesses deceive all evaluators indiscriminately, which does not align with reality. Furthermore, evaluators can only consult their neighbors for obtaining witness evaluations, unlike FIRE, which allows consulting neighbors of neighbors, thus limiting the acquisition of witness evaluation information.
Some scholars attempt to construct trust models using different methods, such as Bayesian probability theory (Hosseinnezhad, Azgomi, and Dishabi Citation2024; Hui et al. Citation2023), but this type of trust model has one prominent limitation, i.e., many real evaluations are a must; otherwise, the accuracy of trust evaluation is low (Liu Citation2020). There are studies building the trust model based on stereotypes (Liu, Datta, and Rzadca Citation2013). To solve the problem of lack of stereotype information, Taylor et al. (Citation2017) propose a method to obtain stereotypes from witnesses. To improve the stereotype learning approach, Fang, Zhang, and Sensoy (Citation2018, Citation2020) introduce a fuzzy semantic framework and adopt few-shot learning method. However, this method is not suitable for market circumstances with numerous changes or malicious behaviors. Wu et al. (Citation2021) use a fuzzy Petri net to build a trust evaluation model for web users, but the weights of different trust sources were fixed, making it unable to adapt to changing environments. Wang, Tian, and Wu (Citation2021) conduct trust modeling based on the probabilistic linguistic term set and the MULTIMOORA method but do not provide a good method to handle the situation where there are many fake evaluations. Wang et al. (Citation2022) construct a trust estimation model based on the Dempster-Shafer evidence theory. However, their assumption that agents hold the same attitude toward all other agents, such as honest agents acting honestly toward all agents, does not align with reality.
There are some studies that propose trust models for specific application domains, such as group decision-making (You, Hou, and Chiclana Citation2024), ad hoc networks (Zhou, Zhang, and Meng Citation2022), Internet of Things (Chen et al. Citation2021), cloud services (Mujawar and Bhajantri Citation2022), virtual learning communities (Chamba-Eras, Arruarte, and Elorriaga Citation2023), etc. However, they are difficult to directly apply to social commerce. Wu, Liu, and Qin (Citation2019) design an interval type-2 fuzzy trust evaluation model for social commerce. However, the purpose of this model is only to help inexperienced consumers find suitable advisers, and there is no evaluation and selection method for product providers, and the reliability of trust propagation can be greatly affected by malicious evaluations. By exploiting the effects of the transaction attributes and social relationships, Gong et al. (Citation2020) build a trust model to assess the trustworthiness of providers in social commerce. However, the weight of the trust source in this model is also fixed, making it difficult to adapt to changing environments. More importantly, the model is essentially centralized, and there are challenges of manipulation behaviors similar to centralized models. Some scholars have studied factors that can influence consumer trust in the social commerce market. Although they have not provided a computable comprehensive trust model, these factors can also be referenced in this study, such as ratings, interpersonal recommendations, and social presence (Leong et al. Citation2020; Sharma, Menard, and Mutchler Citation2019; Zhao et al. Citation2023).
In summary, while these existing models have their own characteristics and show some advantages in certain situations, they still have different shortcomings, particularly not well adapted to the realities of the social commerce market. Therefore, this paper is oriented toward social commerce and proposes an adaptive distributed trust model that aligns more with its characteristics, aiming to enhance consumers’ capability to evaluate and select product providers. Thus, the research hypothesis is that, compared to existing typical models, this model can provide greater utility to consumers in the social commerce market.
Social Commerce Trust Model
Structure
The social commerce consumer trust model, referred to as the CAST model (Complex Adaptive Social commerce Trust model, namely a trust model for social commerce that can adapt to complex environments). It can be viewed as a system whose structure consists of elements and their relationships with each other.
System elements comprise consumers, providers, advisers, and judgers, as shown in . Advisers refer to other consumers in the consumer’s social network who help them obtain evaluations of the provider’s products. The social network in this paper is a type of social network that social commerce is more concerned about, where members have certain emotional attachment (Knoke Citation2001), such as relatives, friends, classmates, and colleagues, collectively referred to as acquaintances. Judgers are consumers sharing their product evaluations with providers, e.g. consumers leaving ratings within the seller’s store of an e-commerce platform. The main distinctions between advisers and judgers are as follows: first, for consumers, advisers come from their social networks, whereas judgers are not necessarily from consumers’ social networks; second, advisers’ evaluations are typically not visible to the product provider, while judgers’ evaluations are visible to the provider.
Figure 1. Structure of social commerce trust model.
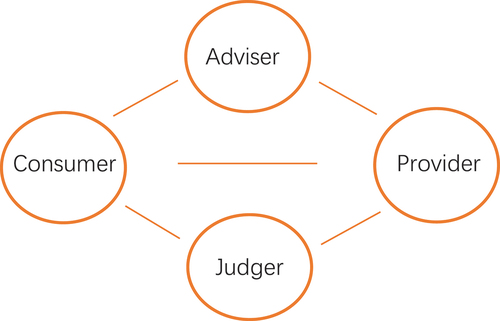
The relationships (interactions) among system elements include the following: (1) Product transactions between consumers (or advisers, judgers) and providers. (2) Information sharing between consumers and advisers. This sharing is manifested in that consumers inquiry about evaluations of providers’ products from advisers and advisers give consumers their evaluations. If advisers have no experience for the product, they can introduce their acquaintances to consumers, allowing consumers to consult them. Thus, advisers assume two sub-roles: evaluation sharer and referrer. (3) Information sharing between judgers and providers, where judgers share their evaluations of products with the product providers. (4) Information sharing between consumers and judgers, such as consumers consulting the product evaluations judgers have given to providers. It is through these interactions that consumer trust is generated, encompassing trust in providers, advisers, or judgers.
Process
Based on the above structure, the overall process of the CAST model can be discussed from different perspectives according to the three roles: consumer, adviser, and judger.
For consumers, the process is as follows: (1) Consumers have the intention to purchase a product. (2) Consumers determine the list of alternative product providers based on their past experiences and search ability. (3) Consumers estimate the trustworthiness of each provider. To make more accurate evaluations, consumers not only learn from their own experiences but also seek advice from advisers in social networks and consider opinions from judgers in e-commerce platforms. (4) According to the evaluation results, consumers select the expected best product provider. (5) After purchasing and consuming the product, consumers make the product evaluations, and measure the credibility of advisers and providers.
For advisers, the process is as follows: (1) Advisers receive a consumer’s request for advice on a provider’s product. (2) Advisers decide whether to share with a certain probability. (3) If advisers are willing and have purchased the product, they share their own evaluations. The reason for not combining other evaluations here is to avoid the correlated evidence problem (Pearl Citation1988). If advisers have not purchased the product before, they introduce their acquaintances to the consumer. Advisers who eventually share evaluations may manipulate them with a certain probability, including exaggeration or disparagement.
For judgers, the process is as follows: (1) Judgers purchase providers’ product and share their evaluations with the providers. (2) The evaluations shared with providers may be manipulated with a certain probability. Common evaluation manipulation in the market includes exaggeration, disparagement, or deletion.
Evaluation
Evaluation of the Provider
When conducting product evaluations for providers, the CAST model adopts three sources of trust information: own trust, adviser trust, and judger trust.
Own Trust
Own trust refers to the consumer’s trust in the provider’s product based on their own purchase experiences, namely direct trust (Sabater and Sierra Citation2002; Shehada et al. Citation2018), or interaction trust (Huynh, Jennings, and Shadbolt Citation2006).
In e-commerce, consumers have their own subjective perceptions of product satisfaction, so own trust is often regarded as the most important source of trust. However, researchers have used various methods to calculate this. One is to use the arithmetic mean, where the evaluation values obtained from all transactions are summed, then divided by the total number of transactions (Pinyol et al. Citation2012). This method treats the weight of each evaluation equally, but the utility of the product may change over time. Hence, it is more reasonable to use the weighted mean to combine the evaluation values of multiple transactions as shown in EquationEquation (1)(1)
(1) :
where R represents the calculated trust value, c is the consumer, p is the product provider, d is the dimension (e.g., product quality, logistics, service attitude, after-sales support, etc.), s represents the source of trust, o is own trust, a is adviser trust, j is judger trust, i.e., Ro indicates consumer c’s evaluation of provider p’s product trustworthiness in dimension d based on c’s own experiences; and r stands for rating which means the evaluation value, w is the weight of the rating, n is the total number of ratings involved in the calculation. R and r values range in [0, 1], so R needs to be normalized. In addition, according to different application scenarios and research purposes, the weight can consider different factors, such as time and amount, etc. The final weight can be obtained by combining multiple weight factors as EquationEquation (2)(2)
(2) :
where w is the weight in EquationEquation (1)(1)
(1) ; ω denotes a certain weight factor; λ is the elasticity parameter, representing the contribution of the factor to the result, ranging in [0, 1], and its sum is 1; n is the number of weight factors. However, this paper only considers time weight, specifically the interval between current time and rating occurrence time. Generally, more recent ratings are more valuable. The calculation formula for ω is as follows:
where t represents rating time; Δt represents the time interval between the current time and the rating time; γ is a scaling factor, which can control the influence of the time interval on the weight value.
Adviser Trust
Adviser trust refers to the consumer’s trust in the provider’s products based on evaluations from acquaintances in social networks. Acquaintances can be direct or indirect. When consumers seek advice from advisers, there is a probability that advisers share fake evaluations. In typical social interactions, people tend to lie less to close friends than to casual friends or strangers, because this would make them feel uncomfortable. The closer the relationship between friends, the less self-serving lies (DePaulo and Kashy Citation1998). Therefore, the probability value can be set to be related to the emotional attachment level of the adviser to the consumer. The higher the level, the lower the probability of deception by the adviser. Additionally, when referrers exist in the process, this probability value is also related to the emotional attachment level between the evaluation sharer and the last referrer. For example, consumer a1 asks a2 for a product’s evaluation, a2 refers a3 to a1, and the probability of a3 sharing a fake evaluation is influenced not only by the emotional attachment level of a3 to a1 but also by that of a3 to a2. This leads to EquationEquation (4)(4)
(4) :
where Pfa represents the probability that the adviser shares the fake evaluation; E1 is the emotional attachment level of the adviser who shares the evaluation to the consumer, and E2 is the emotional attachment level of the adviser who shares the evaluation to the adviser who acts as the last referrer; Ethold is the threshold of emotional attachment level, assuming that when it is higher than this value, the adviser does not deceive, such as close relatives and friends; φ is a scaling factor, which can control the influence of emotional attachment level on the probability of the adviser’s deception. The evaluation can be exaggerated or disparaged, and the calculation is as EquationEquation (5)(5)
(5) :
where Rf denotes the value of a fake evaluation; Rmin and Rmax are the minimum and maximum ratings, respectively; Rog is original rating; β is the extent of exaggeration or disparagement, exaggerate when the original rating is negative and disparage when it is positive.
A concept closely related to emotional attachment is social intimacy (Miller and Lefcourt Citation1982). The level of social intimacy between acquaintances decays as the distance between them in the social network increases. If its value is set from 0 to 1, it decays fast when it approaches 1, and decays slowly when it approaches 0 (Liu et al. Citation2013). Therefore, when the consumer and the adviser are indirect acquaintances, their emotional attachment level can be calculated using EquationEquation (6)(6)
(6) :
where 1 and n are indirect acquaintances, E1,n represents the emotional attachment level of consumer 1 to adviser n, and its value is the product of the emotional attachment level of acquaintances between the two, for example, consumer 1 finds adviser 3 through adviser 2, then E1,3 equals E1,2 multiplied by E2,3.
When consumers receive evaluations from advisers, they also integrate them based on different weights. The calculation method is shown in EquationEquation (1)(1)
(1) , where c represents the role of the adviser. Similar to own trust, the weights first consider the factor of time. Second, the emotional attachment level between consumers and advisers is taken into account. In social commerce, evaluations shared by acquaintances with a stronger emotional attachment are generally considered more credible and less likely to be manipulated. Additionally, if the subjectivity (i.e. preference) of different consumers is considered, it can also be used as a weight factor. The closer the adviser is to the consumer in subjectivity, the higher the credibility of the evaluation shared by the adviser. By combining multiple weight factors, the final weight can be obtained as shown in EquationEquation (2)
(2)
(2) . When both subjectivity and deception are present, the adviser level is used to comprehensively represent the evaluation differences caused by subjectivity and deception. The calculation method is mentioned in the following section. The logic of weight factor selection is as follows: (1) If subjectivity and deception are not considered, only time interval is used as the weight factor. (2) If subjectivity is not considered but deception is, time interval and emotional attachment level are used. (3) If subjectivity is considered, time interval and adviser level are used.
Judger Trust
Judger trust refers to the consumer’s trust in the provider’s products based on evaluations from judgers. While judger trust is easier to obtain than adviser trust, the provider can influence the authenticity of the evaluation in various ways, such as giving buyers money or gifts in return if their ratings are positive, deleting or hiding negative ratings, bribing fake evaluation makers to give competitors negative ratings and so on. Additionally, when consumers do not leave ratings, many e-commerce platforms default to positive ratings. Therefore, it is generally believed that the reliability of evaluations obtained through judger trust is lower than that of own trust and adviser trust. The judger trust value is also calculated as EquationEquation (1)(1)
(1) , where c represents the judger. The weighted mean of multiple evaluations is adopted to obtain the value of judger trust. Similar to own trust, use time interval as the weight factor.
Overall Trust
From the abovementioned three sources of trust, three separate evaluations of the provider’s product trustworthiness can be obtained. However, it is necessary to combine them to obtain an overall trust value, as shown in EquationEquation (7)(7)
(7) :
where Roa is consumer c’s overall evaluation of provider p’s product trustworthiness in dimension d; Rs is the trust value based on each source; Ws is the importance of each source; ρs is the reliability of the evaluation obtained from each source.
Importance Ws reflects consumers’ confidence in each trust source. Since evaluations from consumers’ own experiences are usually the most credible, the importance of own trust can be set as the highest and fixed. However, the importance of adviser trust and judger trust change as consumers learn, i.e., after each purchase, consumers get their own evaluations of the provider’s product, compare them with evaluations from advisers or judgers regarding the same product, and aggregate the differences calculated each time to obtain the final degree of difference. Greater differences indicate lower importance and lesser credibility for that trust source. See EquationEquation (8)(8)
(8) :
where Ws is the importance of the adviser or judger trust; Wsd is the default value (Wad for adviser trust, Wjd for judger trust); crs is the evaluation of the importance of a trust source by a consumer after a certain purchase; n is the number of evaluations; wts is the evaluation weight, which can be either variable (e.g., changing over time) or fixed and equal, depending on the situation; Ws ranges from 0 to 1, and also needs to be normalized. The calculation of crs is shown in EquationEquation (9)(9)
(9) :
where cra and crj respectively denote the perceived importance of the adviser and judger trust sources by consumer c at time t; Ract is the consumer’s actual evaluation of a provider at this time; Rs is the evaluation of the provider by a trust source at this time. It should be noted that, using EquationEquation (8)(8)
(8) , the general importance of the judger trust can be obtained by aggregating crj values based on all providers transacted. As the credibility of various providers can differ, by aggregating crj values based on a specific provider, the specific importance of the judger trust for that provider can be obtained. When calculating the importance of the judger trust in EquationEquation (7)
(7)
(7) , if the consumer is unaware of the specific importance of the target provider, the general importance is used. As for the importance of adviser trust, when considering consumer subjectivity, different importance is distinguished based on the different characteristics of the provider’s products.
The reliability ρs in EquationEquation (7)(7)
(7) reflects the quality of evaluations obtained from each trust source at this time. If the calculation of reliability involves multiple factors, EquationEquation (10)
(10)
(10) is used to combine them:
where n is the number of factors and ρi is the value of each reliability factor; λ is the elasticity parameter, which reflects the contribution of each factor to the result, and the sum of λi is 1. Factor selection can be referred to the FIRE model (Huynh, Jennings, and Shadbolt Citation2006), using two factors: the total number of ratings and rating deviation. The calculation formula for the factor of the total number of ratings is as follows:
where ρsum is the factor value of the total number of ratings; w is the rating weight, as the reliability of each rating may differ; αsum is the slope factor, which can adjust the rate at which ρsum change with the sum of w. The calculation of the rating deviation factor is as follows:
where ρdev is the factor value of the rating deviation; w is the rating weight; r is the rating value; Rs is the overall rating of a trust source, which is obtained from EquationEquation (1)(1)
(1) . To calculate the overall reliability of the ratings from three sources, EquationEquation (13)
(13)
(13) can be used:
where ρoa is the overall reliability; Ws is the importance of own trust, adviser trust, and judger trust. Therefore, when consumers choose among multiple providers, they will consider the calculation results of EquationEquation (7)(7)
(7) and (Equation13
(13)
(13) ) simultaneously. In addition, if there is a multi-dimensional evaluation, the final rating can be obtained by combining the ratings from all dimensions using EquationEquation (14)
(14)
(14) :
where Rfnl is the final rating, namely consumer c’s ultimate product evaluation of provider p; n is the number of dimensions; Rd is the rating of a dimension; Wd is the weight of a dimension, which represents the importance of that dimension.
Evaluation of the Adviser and the Judger
In addition to evaluating product providers, consumers also need to evaluate advisers to choose better ones. For the same provider, consumers and advisers may have different evaluations. There are two reasons for the difference, one is the authenticity of the adviser’s evaluations, and the other is the subjectivity of the adviser. Therefore, the evaluation algorithm needs to identify the credible advisers who are both honest and close to the subjectivity of the consumer, and as mentioned above, the adviser level can be used as an indicator to measure the two. The general idea of the algorithm is as follows: by comparing the differences between the evaluations of the consumer and the adviser for a certain provider, the value of the adviser level is determined. The specific implementation steps are as follows: after each purchase, the consumer performs a Cartesian product of all the ratings of the provider by the consumer and all the ratings of the same provider by the adviser and gets the rating entry pair of the consumer and the adviser (the entry contains rating value and time). Then based on different rating time intervals between the consumer and the adviser, the rating entry pairs are grouped, and those with the same time interval are in one group. We then calculate the difference between the rating values of the consumer and the adviser in each rating entry pair, the smaller the difference, the higher the adviser level. If there are multiple rating entry pairs in the group, the average can be calculated using EquationEquation (15)(15)
(15) :
where l is the adviser level, ranging in [0, 1], and ti is the rating time interval between the consumer and the adviser, i.e., when the rating time interval is ti, consumer c estimates the level of adviser a as l; rc is the consumer’s rating for a provider, and ra is the adviser’s rating for the provider; n is the number of rating entry pairs in the time interval group. Then, based on the adviser level obtained each time, the weighted mean is used to calculate the final adviser level, as shown in EquationEquation (16)(16)
(16) :
where L represents the overall evaluation of the adviser a’s level by consumer c, ranging in [0, 1]; n is the number of rating time intervals involved in the calculation; l is the adviser level calculated based on a certain rating time interval; Wl is the weight, reflecting the reliability of l. Wl value is related to two factors. First is time factor, i.e. the rating time interval between the consumer and the adviser, as product utility may change. The smaller the time interval, the more reliable the l value. The second is the quantity factor, i.e. the number of rating entry pairs corresponding to the same time interval. The greater the number, the more reliable the l value. The calculation is as EquationEquation (17)(17)
(17) :
where Wl is the overall weight; n is the number of weight factors; wl is a weight factor; λ is the elasticity parameter similar to EquationEquation (2)(2)
(2) . λ1 is for the time factor, λ2 is for the quantity factor. The time weight factor is calculated using EquationEquation (3)
(3)
(3) . The quantity weight factor is calculated using EquationEquation (18)
(18)
(18) :
where wlq is the quantity weight value; q is the number of rating entry pairs under a certain time interval; αq is the slope factor, which can adjust the rate at which wlq changes with q. The same evaluation algorithm can also be applied to evaluate the judger.
Selection
Selection of the Alternate Provider
Consumers, in order to maximum their utility, usually choose multiple competitive product providers for comparison. In the social commerce market, there is a wide variety of products. To identify suitable alternative providers, it relies on both consumers’ online search ability and their past experiences. For example, for inferior products purchased previously, the chance to choose them again diminishes. Such as EquationEquation (19)(19)
(19) :
where Pbl is the probability of being on the blacklist, meaning the likelihood that a consumer c excludes a provider p from the alternative list when purchasing products; and Fbl is the number of times of purchasing products with poor utility from a certain provider. If the rating of a product is less than the acceptable rating threshold ARthold, it is considered to have poor utility.
Selection of the Final Provider
After the product trustworthiness of the alternative providers has been evaluated, there may be two groups of providers, one with unknown trustworthiness and another with known trustworthiness. There are three cases: (1) If all are unknown, a provider will be randomly selected as the final target provider. (2) If all are known, select the provider whose product has the highest trustworthiness. (3) If some are unknown and some are known, it faces the “exploration or exploitation” dilemma in reinforcement learning, i.e., should the unknown higher trustworthiness be explored in group one, or should the known highest trustworthiness be exploited in group two. For this problem, this paper adopts the widely recognized Softmax algorithm based on the Boltzmann distribution (Sutton and Barto Citation2018; Tijsma, Drugan, and Wiering Citation2017), and the calculation is as EquationEquation (20)(20)
(20) :
where P(a) is the probability of action a; ER(a) is the expected return of action a; n is the number of alternative actions; and T is a temperature parameter that decreases over time. For the above problem of final provider selection, action a here refers to the consumer randomly selecting a product provider from group one.
Selection of the Adviser
When consumers select advisers (i.e. acquaintances who can provide advices) from their social networks, the acquaintances can also be divided into two groups, one group with unknown adviser level and another group with known adviser level. In this way, there are three cases: (1) If all are unknown, some acquaintances with the highest level of emotional attachment will be selected. (2) If all are known, some acquaintances with highest level of adviser will be selected. (3) If some are unknown and some are known, like the provider selection, this presents an “exploration or exploitation” dilemma. The probability calculation is as in EquationEquation (20)(20)
(20) . Action a here refers to the consumer selecting the adviser with the highest level of emotional attachment from group one, and its probability is P(a). The probability of selecting the adviser with the highest level from group two is 1-P(a).
Furthermore, consumers find it difficult to traverse all direct or indirect acquaintances within their social networks, so the search breadth and depth can be set. The number of direct acquaintances that consumers can consult does not exceed the search breadth. If acquaintances have no relevant experience, they can introduce their own direct acquaintances to consumers. Thereby, consumers can then consult their acquaintances’ acquaintances in a layer-by-layer manner, but the number of layers does not exceed the search depth.
Simulation
Testbed
The testbed is developed using NetLogo. The objects selected for comparison contain the highly cited classic FIRE model, the more typical Shehada model in recent research, the centralized model (which uses a centralized evaluation mechanism similar to most current e-commerce platforms), and the no-model approach (where consumers can randomly select providers). The testbed for the social commerce consumer trust model is discussed from the aspects of agent attributes and behaviors.
Agent Attribute
Agents are divided into two categories: consumers and providers, randomly distributed in a two-dimensional simulated world of social commerce, in which there are two networks: the social network among consumer agents and the e-commerce network between consumer and provider agents. The attributes of consumer agents are as follows:
Model or approach used by consumers in purchasing decisions. Options are as follows: CAST, FIRE, Shehada, centralized model, and no-model approach. Consequently, consumer agents can be divided into five groups based on different models or approaches.
Consumer subjectivity. When consumers choose advisers, they prioritize those with preferences close to their own. To simplify the model, five product characteristics are set, and each product is given a characteristic, and each consumer has different preferences for these five characteristics, and the degree of preference follows a discrete uniform distribution: −0.4 means dislike, −0.2 means somewhat dislike, 0 means neutral, 0.2 means somewhat like, 0.4 means like. Each consumer agent has a preference list as in .
Table 1. Consumer agent attributes.
Consumer direct acquaintance repository. By setting the parameters of the direct acquaintance circle, consumers within this parameter value radius are considered direct acquaintances of each other (see ). The emotional attachment level between acquaintances obeys a normal distribution (see ). Moreover, the values are asymmetric, meaning the emotional attachment level of a to b may not be equal to that of b to a.
Other attributes. Including purchase activity level (reflecting the frequency with which consumers need a product), which follows a normal distribution as in . Additionally, there are attributes, such as the total utility obtained by consumers, the number of purchases, the consumer’s own rating repository for providers, the adviser’s rating repository for providers, the consumer’s rating repository for advisers, the provider’s honesty repository (measuring the credibility of judger’s ratings given by the provider), and the provider’s blacklist, etc.
As for product providers, like existing research, in order to simplify the model without losing generality, it is assumed that each provider has only one product, and there is competition among products. Thus, the attributes of provider agents are as follows:
Product Type. Products are classified into four types by their utility levels: good, ordinary, bad, and unstable (see ). The quantity of each type can be set by the ratio of inferior product providers (i.e. IPR, including bad and unstable).
Table 2. Provider product utility classification.
Product utility. The utility of good, ordinary, and bad products satisfies a normal distribution, and the utility of unstable products is randomly distributed, as shown in .
Provider honesty. It reflects the reliability of the judger’s ratings held by the provider. There are three types: very honest, very dishonest, and sometimes dishonest, as shown in . The quantity of each type can be set by the ratio of dishonest providers (i.e. DPR, including very and sometimes dishonest). If the ratio is 0.6, fake evaluations account for around 40%, approximately consistent with the result of FakeSpot (Citation2021) study.
Table 3. Provider honesty classification.
Product characteristic. Five characteristics are defined, with each product having one characteristic randomly represented by a random number, as shown in .
Table 4. Provider agent attributes.
The judger’s rating repository for the provider’s products. To reflect the phenomenon of fake evaluations, the ratings in the repository will be manipulated with a certain probability, which is related to the provider honesty. The lower the honesty, the higher the manipulation probability. Different manipulation behaviors and their proportions can be set based on different market environments or experimental purposes. This experiment contains three common behaviors: (1) Exaggerating evaluation, setting the evaluation value to 1, reflecting the phenomenon of incentivized positive evaluations by cash or gift; (2) Disparaging evaluation, setting the evaluation value to 0, reflecting the phenomenon of malicious negative evaluations; (3) Removing evaluation, reflecting the phenomenon of hiding or deleting negative evaluations. The proportion of exaggerating evaluation is set to 0.6. When the original evaluation is negative, the proportion of disparaging evaluation is 0.1, the proportion of removing evaluation is 0.3, and when the original evaluation is positive, the proportion of disparaging evaluation is 0.4. Based on the typical situation in the market, evaluations with values lower than 0.6 (i.e. 3-star) are regarded as unacceptable negative evaluations.
Agent Behavior
The agent behavior reflects the changes exhibited by the agent in each round of experiments, which can be described from the perspectives of the consumer and provider agent.
The Consumer Agent Behavior
At the beginning of each round, if consumer agents have a demand to purchase a certain type of product, they will search for product providers within their ability. By setting the parameter of the consumer vision, representing consumers’ ability to search for products, the providers within this parameter value as the radius are regarded as alternative product providers, see . After obtaining the alternative providers, consumer agents using CAST will also eliminate inferior products providers with a probability based on past experiences.
Table 5. Main experimental parameters.
Next is the provider selection. For consumers based on no-model, a provider will be randomly selected from the list of alternative providers. However, the behavior of consumers using different models is different. Consumers based on centralized model use only judger trust. Consumers based on the Shehada model use their own trust and adviser trust. Consumers based on FIRE and CAST use their own trust, adviser trust, and judger trust. Except for no-model approach, the four trust models individually calculate the product trustworthiness of each alternative provider, and handle the results in three cases: (1) If the product trustworthiness of all providers is unknown, one of them is randomly selected. (2) If the product trustworthiness of all providers is known, the provider with the highest product trustworthiness is selected. (3) If the product trustworthiness of some providers is unknown and that of other providers is known, CAST and FIRE use the Softmax algorithm based on Boltzmann distribution to select the provider. In addition, since this experiment assumes that the provider honesty, consumer subjectivity, and emotional attachment do not change over time, the weight (wts) in EquationEquation (8)(8)
(8) is set to be fixed and equal.
When calculating the adviser trust, consumers using the Shehada model only consult their direct acquaintances, while the FIRE and CAST adopt a referrer system similar to the Yu model, with the search breadth and depth as in . And when consumers using FIRE and CAST choose acquaintances, they refer to their known acquaintances’ credibility. The credibility calculation is based on the difference between consumers’ and their acquaintances’ product evaluations. However, FIRE compares the consumer’s latest evaluation with acquaintances’ all evaluations, and CAST compares the consumer’s all evaluations with acquaintances’ all evaluations. Additionally, if the credibility of all acquaintances is known, the most credible acquaintances will be chosen; if unknown, FIRE will choose them randomly, and CAST will choose those with higher emotional attachment; and if the credibility of some acquaintances is unknown while some are known, CAST uses the Softmax algorithm.
After consumers select the provider, purchase, and consume the product, they update their total utility gain, and then evaluate the product. The evaluation value can consider the subjectivity of the consumer, as shown in EquationEquation (21)(21)
(21) :
where Rsub is the consumer’s subjective evaluation value; Robj is the objective evaluation value; is the degree of subjectivity, with values are as listed in . Consumers using the Shehada, FIRE, and CAST models will also recalculate the adviser’s credibility based on this evaluation. Finally, consumers will share the evaluation with providers. Like existing research, this experiment assumes that consumers are willing to share.
The Provider Agent Behavior
To reflect the variability of the social commerce market, the main behaviors of provider agents are as follows: firstly, at the end of each round, providers will move in the market with a certain probability; secondly, providers with unstable product utility will randomly change their utility; furthermore, there is a probability that the product utility of stable types of providers will also undergo slight changes; moreover, the product types of all providers will change with a probability; lastly, providers will exit the market at a certain ratio. To ensure that the experimental environment is not affected, it is assumed that when providers exit, the same number of new providers will enter the market, and the ratio of dishonest and inferior product providers will remain unchanged.
In addition, there is some randomness in the testbed’s operation. To make the results more reliable, the Monte Carlo principle can be followed to execute the simulation multiple times and take the average to obtain the final results (Adamopoulou and Symeonidis Citation2014). In this paper, the number of experimental executions is set to 10, and to simplify the model without affecting the experimental objectives, the evaluation of provider products is done only from one dimension. The main experimental parameters involved above are shown in .
Model Validation
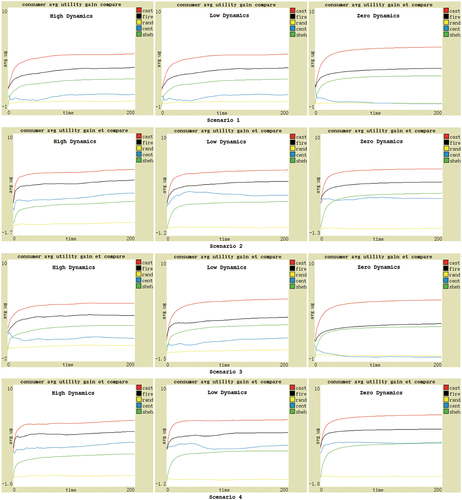
Model validation based on different social commerce market scenarios can make the results more convincing. Therefore, according to whether to consider consumer subjectivity and whether to consider the adviser deception due to different levels of emotional attachment, the scenarios can be categorized into four types: (1) Both are considered; (2) Only the adviser deception is considered; (3) Only the consumer subjectivity is considered; (4) Neither is considered. In the actual social commerce market, Scenario 1 is common, and the other three also exist. Sometimes, due to subjectivity, the same product may bring different utility to different consumers. Sometimes the impact of subjectivity may be negligible. Sometimes advisers may give fake evaluations. Sometimes advisers are close relatives or friends with a high level of emotional attachment and generally do not deceive. Thus, the experimental hypothesis is that under these four scenarios, the average utility obtained by consumers using CAST should be higher than that of other comparison subjects.
When the consumer subjectivity and adviser deception are both considered (i.e. Scenario 1), the average utility gained by consumer agents using CAST, FIRE, Shehada, centralized model, or no-model is shown in . The x-axis represents the number of rounds (ticks) per experiment, indicating time. The y-axis represents the average utility gained by the consumer groups using different models or no-model, and the utility value is calculated based on the actual purchase numbers of consumers and the average result from multiple experiment executions. As shown in the figure, CAST performs the best, maintaining the highest utility, improving the fastest, while FIRE is second, Shehada (sheh) third, centralized (cent) fourth, and no-model (rand) is the worst. Through analysis, there are several points: (1) The utility gained by the consumers using no-model is the lowest, as they do not adopt any trust model, and only randomly select the provider, thus indicating the necessity of trust model. (2) The utility gained by the consumers using the centralized model is also very low and fluctuates obviously. This is due to many fake evaluations from the judger trust source. It indicates vulnerability to fake evaluations if solely relying on a single trust source. (3) The consumer utility gain in Shehada model is lower than that in FIRE and CAST, primarily due to two reasons. First, it only gathers evaluations from direct acquaintances, i.e., one-layered adviser evaluations, whereas FIRE and CAST can gather multi-layered adviser evaluations from social networks. Second, it uses a simple arithmetic mean when aggregating historical evaluations without considering weight factors like time. (4) Compared with FIRE, CAST greatly improves the utility gained by consumers. There are three reasons. Firstly, when evaluating the adviser level, FIRE only compares the consumer’s current evaluation with the adviser’s evaluations, which can lead to inaccuracy, especially when the product utility is variable. In contrast, CAST compares the consumer’s all evaluations with the adviser’s evaluations, resulting in more reliable adviser levels. Second, the importance of trust sources in FIRE remains unchanged, but the importance of adviser and judger trust source in CAST is continuously updated as consumers learn, making it more adaptable to the changing market environment. Thirdly, after the purchase, consumers in CAST can blacklist providers with low product utility, gradually reducing the likelihood of selecting their products again until they are completely blocked.
Figure 2. Performance based on four scenarios.
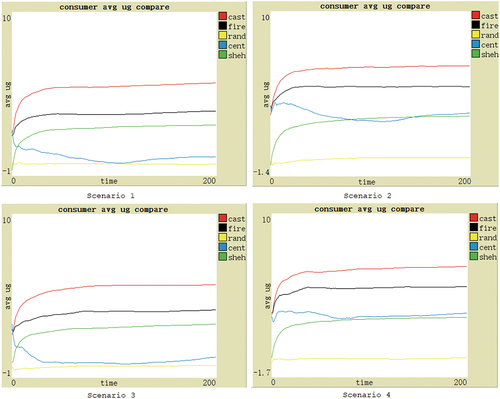
The other three scenarios are also shown in . Similar to Scenario 1, CAST exhibits a significant advantage and steady improvement in average utility as consumers continue learning. However, in Scenarios 2 and 3, because the consumer subjectivity is not considered, the performance of the centralized model is slightly improved, but still far inferior to CAST. Therefore, our hypothesis is supported.
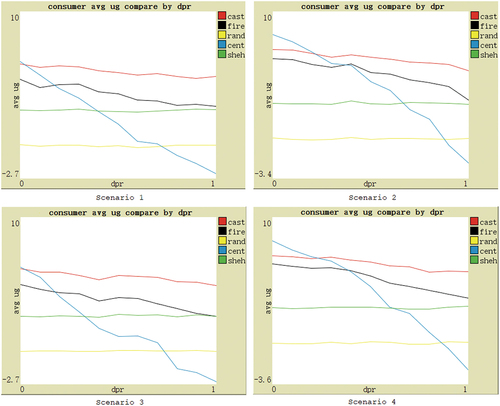
Since there are still many differences in features of different social commerce markets, and the features of the same market also change. To further validate the effectiveness of the CAST model, the performance of each model and no-model can be compared based on several main feature parameters. These parameters are as follows: (1) the ratio of dishonest providers, indicating the proportion of providers with fake judger evaluations; (2) the ratio of inferior product providers, representing the proportion of providers with bad or unstable product utility; (3) the ratio of deceptive behavior of advisers, measuring the extent to which advisers share fake evaluations with consumers; (4) the number of providers; (5) the dynamics of providers. Therefore, the experimental hypothesis is that when these five feature parameter values change, based on four different scenarios, the average utility obtained by consumers using CAST should be higher than that of other comparison subjects.
For the ratio of dishonest providers, the performance under four scenarios is shown in . In Scenario 1, as the ratio increases, the consumer utility gain of the centralized model decreases rapidly, even lower than that of the no-model, because it only relies on the judger trust. However, Shehada model does not use the judger trust and is minimally affected. As for FIRE, its utility gain also progressively declines primarily due to the fixed importance of the judger trust, making it unable to adapt to the increase in fake evaluations in the market. In contrast, CAST can maintain the utility gain at a relatively high level as the ratio increases. Although there is also a decrease, the magnitude is significantly smaller than that of FIRE. The main reason is that CAST has greater adaptability, and the importance of the judger trust can decrease with the increase in the ratio of dishonest providers. The results in the other three scenarios are similar. Furthermore, when the ratio is very low, the centralized model outperforms CAST. This is because the judger’s evaluations have high authenticity in this case, resulting in a high importance of the judger trust. The centralized model uses only the judger trust, while CAST has three trust sources, and the adviser trust has a proportion of fake evaluations. Although the trust source weight in CAST can change with learning, it requires some time. However, according to the experimental settings in , for Scenario 1 and 3, only when the authenticity of the judger’s evaluations exceeds 99.4% (DPR < 0.01), the centralized model outperforms CAST. For Scenarios 2 and 4, the authenticity of the judger’s evaluations needs to exceed 88% (DPR < 0.2). But such situations are currently rare in the social commerce market, so from a practical perspective, CAST remains effective. The hypothesis is essentially confirmed.
Figure 3. Performance based on four scenarios with changes in the dishonest providers ratio.
For the ratio of inferior product providers, the performance under four scenarios is shown in . With the increase of the ratio, the average utility gained by consumers under different scenarios decreases. Centralized model has the largest drop in performance down to below no-model, illustrating that such models are highly susceptible to fluctuations in product utility. CAST, FIRE, and Shehada models are less affected by this. Most of the time, the CAST performance is maintained first, followed by FIRE, and Shehada model basically ranks third. But when the ratio is extremely low (less than about 0.06), the centralized model brings the highest utility, even higher than CAST. Analyzing the reasons, the experiment sets the ratio of dishonest providers to 0.6, which means that there are 64% of the real evaluations in the judger trust source, and there are almost no inferior products in the market, so even if only relying on the judger trust, consumers using the centralized model can find better product providers. However, CAST has three trust sources. Although the weight of the judger trust can be adjusted as consumers learn, it takes some time, which leads to the average utility gain of consumers being slightly lower than that of consumers using the centralized model. Nevertheless, in the real social commerce market, it is extremely rare to encounter such a low ratio of inferior product providers. The hypothesis is essentially validated.
Figure 4. Performance based on four scenarios with changes in the inferior product providers ratio.
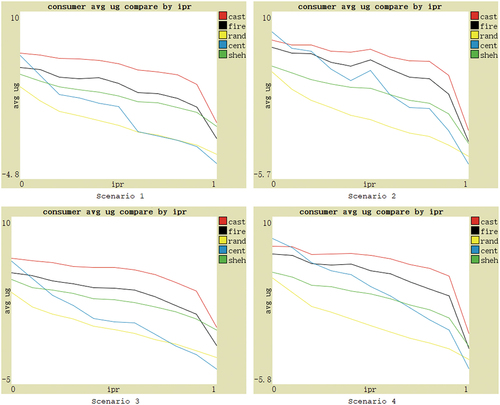
For the ratio of deceptive behavior of advisers, the performance under four scenarios is shown in . Centralized model and no-model do not involve the adviser trust, only for reference. With the increase in the deception probability scaling factor in EquationEquation (4)(4)
(4) , the deceptive behavior of advisers increases, and the average utility gain of consumers using CAST fluctuates slightly, but consistently remains at the highest level. Moreover, in Scenarios 1 and 3, the performance of CAST fluctuates less than FIRE, demonstrating stronger adaptability. The hypothesis is verified. In Scenarios 2 and 4, Shehada model has the smallest performance fluctuations primarily because it only involves one layer of social relationship, resulting in less affect.
Figure 5. Performance based on four scenarios with changes in the ratio of deceptive behavior of advisers.
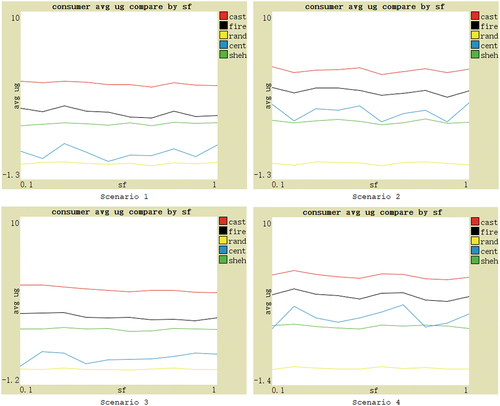
For the changes in the number and dynamics of providers, the performance under four scenarios are shown in respectively. Provider dynamics are reflected in four aspects: the probability of the provider moving in the market, the probability of the stable product provider changing product utility, the probability of the provider changing product utility type, and the probability of the provider exiting the market. The high dynamics means that the four values are 20%, 20%, 2%, and 2%, respectively; low dynamics means that the four values are 5%, 5%, 0.5%, and 0.5%, respectively; zero dynamics means that all four values are 0. It can be seen that CAST maintains a competitive advantage compared to the others. The hypothesis is supported.
Figure 6. Performance based on four scenarios with changes in the number of providers.
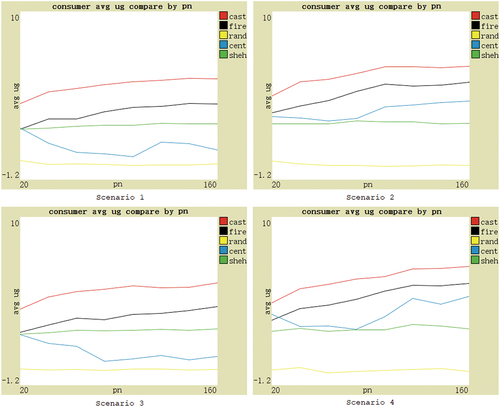
Figure 7. Performance based on four scenarios with changes in the dynamics of providers.
Implications
This paper designs an adaptive consumer trust model CAST for social commerce. Compared with existing models, this model has the following advantages: (1) When evaluating providers, it comprehensively integrates evaluations from consumers themselves, social networks (advisers), and e-commerce platforms (judgers), which better handles situations where a source is missing or has low credibility, such as when there are many fake evaluations in the e-commerce platform. Furthermore, it proposes a consumer learning mechanism to dynamically adjust the importance of the adviser and judger trust, allowing for more adaptation to market changes. (2) When evaluating advisers, it compares all evaluations for the same provider from consumers and advisers, improving calculation accuracy. (3) When setting alternative providers, a blacklist mechanism is introduced to eliminate inferior product providers based on transaction experiences, thereby improving selection efficiency and accuracy. (4) When selecting advisers and providers, to deal with the “exploration or exploitation” problem in reinforcement learning, the Softmax algorithm is used to enhance selection accuracy and adapt for changing environments. Furthermore, during the selection of advisers, it also considers the emotional attachment level between consumers and advisers, effectively reducing deceptive behaviors of advisers.
Leveraging this research, not only can a better model be provided for related theoretical studies, but its main practical implication lies in using this model as a basis to develop a new adaptive distributed product evaluation system for the social commerce market. An application scenario is as follows: (1) Consumers activate the system on the social commerce platform and form a circle of acquaintances who can collaborate on shopping. (2) When consumers intend to purchase a certain type of product, they input keywords and click ok. (3) The system automatically searches for alternative product providers, excluding those with poor utility based on known experiences. (4) The system automatically sends requests to acquaintances in the social network to obtain their evaluations on these alternative products. It also queries evaluations from other consumers on the e-commerce platform, combining them with consumers’ own past experiences to get a comprehensive product evaluation. (5) Consumers make the final decision based on the system’s calculation results, purchase the product, and provide feedback. In summary, relying on this system, buyers can obtain products with higher utility, foster connections with acquaintances; moreover, sellers’ products can get more accurate evaluations so that superior products retain, inferior ones eliminate; additionally, it can stimulate social and business activities on social commerce platforms, promoting their further development.
The model and algorithm presented here can also be referenced for theoretical research or practical applications in other fields, such as social media and online communities for evaluating the credibility of users and their generated content; group decision-making for integrating multiple opinions and preferences to obtain optimal decisions; online learning platforms for assessing the quality of courses and teaching proficiency; scientific collaboration for estimating the suitability of partners; and the Internet of Things for identifying the reliability of devices.
Conclusions
The social commerce market has its own characteristics, high uncertainty, and many changes. Existing product evaluation systems have significant shortcomings. In order to help consumers better obtain trustworthy products, this paper proposes the CAST model. To validate its effectiveness, the typical models are selected as comparison objects, and different scenarios of the social commerce market are focused on, namely four scenarios divided according to whether to consider consumer subjectivity and adviser deception. The changes in the main market feature parameters are also based on, including the ratio of dishonest providers, the ratio of inferior product providers, the ratio of deceptive behavior of advisers, the number of providers, and the dynamics of providers. The results show that compared to other models, CAST can assist consumers to identify better product providers faster and obtain higher utility. This proves that the proposed model in this paper is more suitable for the characteristics of the social commerce market and exhibits stronger adaptability.
However, this study has some limitations. First, while the experiments show that CAST outperforms other models, there is still potential to enhance the utility gain for consumers. Therefore, future research could further compare with existing models to analyze strengths and weaknesses, aiming to devise more refined algorithms. Secondly, although this paper’s simulations include parameters based on real data (e.g. the fake evaluation ratio) and experiments with different parameter values, it is necessary to incorporate more real data from markets to further validate the model’s effectiveness. Third, this paper assumes that advisers and judgers are willing to share their evaluations in similar studies. While this does not affect the conclusions, in practical social commerce, not everyone is willing to share evaluations within social networks or e-commerce platforms. Hence, in the trust model, considering the sharing probability of advisers and judgers and incorporating the sharing promotion mechanism is a direction worthy of research. Fourthly, due to many judgers leaving anonymous evaluations or using different accounts on different e-commerce platforms, it is difficult for consumers to identify judgers. Therefore, in the overall calculation, the weight of the judger’s evaluation is only based on the time and does not consider the judger’s subjectivity or honesty. Future research could address this issue, as there are also many judgers willing to leave non-anonymous evaluations and an increasing number of platforms support registration using easily identifiable unified social media accounts. Lastly, more factors influencing consumer trust could be considered to enhance the construction of the trust model.
Data Availability Statement
The authors confirm that the data supporting the findings of this study are available within the article. For more data, contact the corresponding author.
Disclosure Statement
No potential conflict of interest was reported by the authors.
Additional information
Funding
References
- Accenture. 2022. Why shopping’s set for a social revolution. Accessed June 6, 2023. https://www.accenture.com/us-en/insights/software-platforms/why-shopping-set-social-revolution.
- Adamopoulou, A. A., and A. L. Symeonidis. 2014. A simulation testbed for analyzing trust and reputation mechanisms in unreliable online markets. Electronic Commerce Research and Applications 13 (5):368–34. doi:10.1016/j.elerap.2014.07.001.
- Al-Adwan, A. S., and H. Yaseen. 2023. Solving the product uncertainty hurdle in social commerce: The mediating role of seller uncertainty. International Journal of Information Management Data Insights 3 (1):1–16. doi:10.1016/j.jjimei.2023.100169.
- Botelho, V., F. Enembreck, B. C. Avila, H. de Azevedo, and E. E. Scalabrin. 2009. Encrypted certified trust in multi-agent system. Proceedings of the 13th International Conference on Computer Supported Cooperative Work in Design, 227–32. doi:10.1109/CSCWD.2009.4968063.
- Chamba-Eras, L., A. Arruarte, and J. A. Elorriaga. 2023. T-VLC: A trust model for virtual learning communities. IEEE Transactions on Learning Technologies 16 (5):847–60. doi:10.1109/TLT.2023.3288363.
- Chen, G. Z., F. P. Zeng, J. Zhang, T. T. Lu, J. F. Shen, and W. J. Shu. 2021. An adaptive trust model based on recommendation filtering algorithm for the internet of things systems. Computer Networks 190:107952. doi:10.1016/j.comnet.2021.107952.
- DePaulo, B. M., and D. A. Kashy. 1998. Everyday lies in close and casual relationships. Journal of Personality & Social Psychology 74 (1):63–79. doi:10.1037/0022-3514.74.1.63.
- Fakespot. 2021. Let’s talk about fake reviews. Accessed October 1, 2023. https://www.fakespot.com/post/lets-talk-about-fake-reviews-part-1.
- Fang, H., J. Zhang, and M. Sensoy. 2018. A generalized stereotype learning approach and its instantiation in trust modeling. Electronic Commerce Research and Applications 30:149–58. doi:10.1016/j.elerap.2018.06.004.
- Fang, H., J. Zhang, and M. Sensoy. 2020. A 2020 perspective on “A generalized stereotype learning approach and its instantiation in trust modeling”. Electronic Commerce Research and Applications 40:40. doi:10.1016/j.elerap.2020.100955.
- Gan, Z. B., Q. Ding, K. Li, and G. Q. Xiao. 2011. Reputation-based multi-dimensional trust algorithm. Journal of Software 22 (10):2401–11. doi:10.3724/SP.J.1001.2011.03909.
- García, J. J. L., D. Lizcano, C. M. Ramos, and N. Matos. 2019. Digital marketing actions that achieve a better attraction and loyalty of users: An analytical study. Future Internet 11 (6):130. doi:10.3390/fi11060130.
- Gong, Y. H., L. Chen, T. H. Ma, and V. S. Sheng. 2020. A comprehensive trust model based on social relationship and transaction attributes. Security and Communication Networks 2020:1–10. doi:10.1155/2020/8887596.
- Hosseinnezhad, M., M. A. Azgomi, and M. R. E. Dishabi. 2024. A probabilistic trust model for cloud services using bayesian networks. Soft Computing 28 (1):509–26. doi:10.1007/s00500-023-08264-z.
- Hui, H. W., Z. X. Gong, J. W. An, and J. Z. Qi. 2023. A dynamic bayesian-based comprehensive trust evaluation model for dispersed computing environment. China Communications 20 (2):278–88. doi:10.23919/JCC.2023.02.018.
- Huynh, T. D., N. R. Jennings, and N. R. Shadbolt. 2005. On handling inaccurate witness reports. 8th Int. Workshop on Trust in Agent Societies (TRUST), Utrecht, Netherlands.
- Huynh, T. D., N. R. Jennings, and N. R. Shadbolt. 2006. An integrated trust and reputation model for open multi-agent systems. Autonomous Agents and Multi-Agent Systems 13 (2):119–54. doi:10.1007/s10458-005-6825-4.
- Ji, S. J., Q. Zhang, J. P. Li, D. K. W. Chiu, S. H. Xu, L. Yi, and M. G. Gong. 2020. A burst-based unsupervised method for detecting review spammer groups. Information Sciences 536:454–69. doi:10.1016/j.ins.2020.05.084.
- Knoke, D. 2001. Changing organizations: Business networks in the new political economy. New York: Westview Press.
- Leong, L. Y., T. S. Hew, K. B. Ooi, and A. Y. L. Chong. 2020. Predicting the antecedents of trust in social commerce – a hybrid structural equation modeling with neural network approach. Journal of Business Research 110:24–40. doi:10.1016/j.jbusres.2019.11.056.
- Li, Y. J., F. X. Wang, S. W. Zhang, and X. F. Niu. 2021. Detection of fake reviews using group model. Mobile Networks & Applications 26 (1):91–103. doi:10.1007/s11036-020-01688-z.
- Liu, B. 2020. A survey on trust modeling from a Bayesian perspective. Wireless Personal Communications 112 (2):1205–27. doi:10.1007/s11277-020-07097-5.
- Liu, G. F., Y. Wang, M. A. Orgun, and E. P. Lim. 2013. Finding the optimal social trust path for the selection of trustworthy service providers in complex social networks. IEEE Transactions on Services Computing 6 (2):152–67. doi:10.1109/TSC.2011.58.
- Liu, X., A. Datta, and K. Rzadca. 2013. Trust beyond reputation: A computational trust model based on stereotypes. Electronic Commerce Research and Applications 12 (1):24–39. doi:10.1016/j.elerap.2012.07.001.
- Miller, R. S., and H. M. Lefcourt. 1982. The assessment of social intimacy. Journal of Personality Assessment 46 (5):514–18. doi:10.1207/s15327752jpa4605_12.
- Mujawar, T. N., and L. B. Bhajantri. 2022. Behavior and feedback based trust computation in cloud environment. Journal of King Saud University - Computer and Information Sciences 34 (8):4956–67. doi:10.1016/j.jksuci.2020.12.003.
- Pearl, J. 1988. Probabilistic reasoning in intelligent systems: Networks of plausible inference. San Francisco, CA: Morgan Kaufmann.
- Pinyol, I., J. Sabater, P. Dellunde, and M. Paolucci. 2012. Reputation-based decisions for logic-based cognitive agents. Autonomous Agents and Multi-Agent Systems 24 (1):175–216. doi:10.1007/s10458-010-9149-y.
- Ramchurn, S. D., T. D. Huynh, and N. R. Jennings. 2004. Trust in multi-agent systems. The Knowledge Engineering Review 19 (1):1–25. doi:10.1017/S0269888904000116.
- Sabater, J., and C. Sierra. 2002. Reputation and social network analysis in multi-agent systems. International Conference on Autonomous Agents and Multiagent Systems (AAMAS). doi:10.1145/544741.544854.
- Sabater, J., and C. Sierra. 2005. Review on computational trust and reputation models. Artificial Intelligence Review 24 (1):33–60. doi:10.1007/s10462-004-0041-5.
- Sharma, S., P. Menard, and L. A. Mutchler. 2019. Who to trust? Applying trust to social commerce. Journal of Computer Information Systems 59 (1):32–42. doi:10.1080/08874417.2017.1289356.
- Shehada, D., C. Yeun, M. Zemerly, M. Al-Qutayri, Y. Al-Hammadi, and J. K. Hu. 2018. A new adaptive trust and reputation model for mobile agent systems. Journal of Network and Computer Applications 124:33–43. doi:10.1016/j.jnca.2018.09.011.
- Statista. 2020. Share of amazon shoppers in the United States who trust product reviews on amazon as of February 2020. Accessed January 1, 2023. https://www.statista.com/statistics/623659/amazon-customer-review-usage-usa/.
- Sutton, R. S., and A. G. Barto. 2018. Reinforcement learning: An introduction, 2nd ed. Cambridge, MA: MIT Press.
- Taylor, P., N. Griffiths, L. Barakat, and S. Miles. 2017. Stereotype reputation with limited observability. International Conference on Autonomous Agents and Multiagent Systems (AAMAS). doi:10.1007/978-3-319-71682-4_6.
- Tijsma, A. D., M. M. Drugan, and M. A. Wiering. 2017. Comparing exploration strategies for Q-learning in random stochastic mazes. IEEE Symposium Series on Computational Intelligence (IEEE SSCI). doi:10.1109/SSCI.2016.7849366.
- Wang, N. K., D. J. Wei, H. Mi, J. Zang, and S. Wang. 2022. Analysis of carbon emission energy inventory from refrigerant production and recycling carbon compensation. Applied Sciences 12 (1):1–26. doi:10.3390/app12010001.
- Wang, Y., L. Q. Tian, and Z. N. Wu. 2021. Trust modeling based on probabilistic linguistic term sets and the MULTIMOORA method. Expert Systems with Applications 165:113817. doi:10.1016/j.eswa.2020.113817.
- Wu, T., X. Liu, and J. D. Qin. 2019. An interval type-2 fuzzy trust evaluation model in social commerce. Computational Intelligence 35 (4):1113–31. doi:10.1111/coin.12239.
- Wu, Z. N., L. Q. Tian, Y. Zhang, and Z. G. Wang. 2021. Web user trust evaluation: A novel approach using fuzzy petri net and behavior analysis. Symmetry 13 (8):1–15. doi:10.3390/sym13081487.
- Xu, G. Q., G. X. Zhang, C. Xu, B. Liu, M. Q. Li, Y. Ren, X. H. Li, Z. Y. Feng, and D. G. Zhang. 2017. A multi-attribute rating based trust model: Improving the personalized trust modeling framework. Multimedia Tools & Applications 76 (4):5833–49. doi:10.1007/s11042-015-2539-z.
- Yadav, M. S., K. de Valck, T. Hennig-Thurau, D. L. Hoffman, and M. Spann. 2013. Social commerce: A contingency framework for assessing marketing potential. Journal of Interactive Marketing 27 (4):311–23. doi:10.1016/j.intmar.2013.09.001.
- You, X. L., F. J. Hou, and F. Chiclana. 2024. A reputation-based trust evaluation model in group decision-making framework. Information Fusion 103:102082. doi:10.1016/j.inffus.2023.102082.
- Yu, B., and M. P. Singh. 2002. An evidential model of distributed reputation management. International Conference on Autonomous Agents and Multiagent Systems (AAMAS). doi:10.1145/544741.544809.
- Yu, B., and M. P. Singh. 2003a. Detecting deception in reputation management. International Conference on Autonomous Agents and Multiagent Systems (AAMAS). doi:10.1145/860575.860588.
- Yu, B., and M. P. Singh. 2003b. Searching social networks. International Conference on Autonomous Agents and Multiagent Systems (AAMAS). doi:10.1145/860575.860587.
- Zacharia, G., and P. Maes. 2000. Trust management through reputation mechanisms. Applied Artificial Intelligence 14 (9):881–907. doi:10.1080/08839510050144868.
- Zhang, J., and R. Cohen. 2008. Evaluating the trustworthiness of advice about seller agents in e-marketplaces: A personalized approach. Electronic Commerce Research and Applications 7 (3):330–40. doi:10.1016/j.elerap.2008.03.001.
- Zhao, W. J., F. Hu, J. Wang, T. Shu, and Y. Xu. 2023. A systematic literature review on social commerce: Assessing the past and guiding the future. Electronic Commerce Research and Applications 57:1–12. doi:10.1016/j.elerap.2022.101219.
- Zhou, S., G. Zhang, and X. F. Meng. 2022. LocTrust: A local and global consensus-combined trust model in MANETs. Peer-To-Peer Networking and Applications 15 (1):355–68. doi:10.1007/s12083-021-01250-y.