
 ?Mathematical formulae have been encoded as MathML and are displayed in this HTML version using MathJax in order to improve their display. Uncheck the box to turn MathJax off. This feature requires Javascript. Click on a formula to zoom.
ABSTRACT
In this study, we investigate entropy measurements for subdivided cage networks based on topological indices. We specifically calculate different entropy, redefining Zagreb entropy, ,
,
entropy, atom bond connection entropy, and Randic entropy. We examine the graphical behavior of various entropy measures using the line fit approach. The results highlight patterns in the distribution of entropy values and interactions between them, which shed light on the intricate connectivity and structural properties of segmented cage networks. This work improves our understanding of cage network dynamics and provides a visual framework for interpreting their behavior.
Introduction
Mathematical chemistry is an interdisciplinary field that studies various chemical processes by fusing mathematical concepts and techniques with chemical principles. It provides a quantitative framework for understanding and interpreting chemical processes, bridging the gap between theoretical modeling and empirical data. Among the several mathematical methods utilized in mathematical chemistry are differential equations, graph theory, linear algebra, and statistical analysis.
The topology, or molecular graph, of a chemical substance can be used to calculate numerical values known as topological indices. They provide an approach to detecting molecular structural properties independent of spatial arrangement or specific atomic details. Understanding topological characteristics like cycles, branching patterns, and molecular connections all of which are contained in these indices is necessary to comprehend the many chemical and physical properties of molecules. Topological indices are widely used to predict molecular properties like reactivity, solubility, and biological activity based on their structural features in computational chemistry, chemoinformatics, and quantitative structure-activity relationship (QSAR) studies.
In mathematical chemistry, the study of molecular structure and bonding is essential. Because molecules are represented as graphs, with atoms as nodes () and chemical bonds as edges
, graph theory is crucial to this field of study. The degree of a vertex
, indicated by
, is the total number of edges incident to that vertex. It helps scientists to investigate properties, predict behaviors, and analyze and understand complex chemical structures. Salamat et al. (Citation2021) calculated several indexes based on degrees. To identify and create new compounds with certain characteristics and functions, researchers can benefit from the concepts and methods of graph theory. These insights can be gained into the interactions between atoms, the arrangement of bonds, and the general three-dimensional form of molecules (Zhao et al. Citation2023). Graph theory ideas and methods provide insight into the symmetry, coupling, and reaction processes of molecules. Moreover, mathematical techniques help to make sense of the relationship between structure and characteristics, which makes it easier to anticipate and create new compounds with the desired properties (Estrada et al. Citation1998).
The degree of uncertainty, or randomness, in a graph’s structure is measured by a property called entropy. This metric evaluates the degree of disorder or complexity inside the network by considering the distribution of vertices and edges together with their connection patterns.
To provide us with a better understanding of the structural aspects of weighted graphs, Lu et al. (Citation2022) suggest a unique entropy measure that captures the complexity and uncertainty inherent in weighted networks. In HAVARE BC (Çolakoğlu Havare and Havare Citation2019), the regression model for various chemical structures was covered. The study also offers a comprehensive theoretical framework for estimating edge-weighted graph entropy and describes its potential applications in several fields, such as pattern recognition, data mining, and network research. In Ghani et al. (Citation2023), entropy was covered. The findings of this research provide fresh insights into the analysis of complicated networks and further the field of graph theory. Lal, Bhat, and Sharma (Citation2024) investigate how these indices can be used to characterize the structural characteristics and complexity of carbon nanotubes with Y-shaped connections.
Shanmukha et al. Citation2021 discussed the entropy for different networks. Chu et al. (Citation2023) developed mathematical models that explain how entropy measurements in graphite carbon nitride structures are related to various topological indices. In addition to offering important new insights into the interplay between topological indices and entropy measurements in graphite carbon nitride, this study attempts to advance our knowledge of the material’s complexity and structural characteristics. The design and characterization of materials based on graphite carbon nitride, notably in photocatalysis and energy storage applications, would be significantly impacted by the study’s findings. Salamat et al. (Citation2021) discuss the topological indices. These findings offer significant new understandings of the properties, behavior, and performance of these materials, facilitating improved engineering and optimization to raise their effectiveness and efficiency in a range of real-world uses. Ghani et al. (Citation2023) calculated the entropy in several networks. Consequently, the research findings contribute to the progress of technologies related to energy storage systems, environmental cleanup, and renewable energy generation, which could lead to more advancements in clean and sustainable energy solutions.
Rauf et al. (Citation2022), use entropy indices as descriptors to forecast and characterize a variety of physio-chemical aspects, such as bioactivity, toxicity, and solubility, of breast cancer treatments. Ghani et al. (Citation2023) discuss the topological indices of various graphs. Through careful data analysis and statistical modeling, the study provides insights into the relationship between these entropy indices and the physio-chemical properties of breast cancer drugs, which contributes to the development of computational tools and approaches for drug discovery and design in the treatment of breast cancer.
To characterize important properties of organic components, mathematical chemistry employs graph invariants, which are numerical numbers obtained from molecular graphs (Gao et al. Citation2017; Imran et al. Citation2018). Degree-based indices are a sort of topological indices that are widely used in predicting certain properties of chemical compounds such as bioactivity, boiling point, energy dissipation, stability, and several other physicochemical factors. These indices are critical in understanding the characteristics and behaviors of chemicals in diverse circumstances (Randic Citation1975; Siddiqui, Imran, and Ahmad Citation2016). These indices play a crucial role in theoretical chemistry due to their relevance in practical chemical applications. Zhang et al. undertook a thorough examination of the topological indices of several molecular graphs, including generalized bridge molecular networks, Carbon nanotubes, and chemical graph products (Zhang et al. Citation2018). Ravi et al. Citation2023 discussed the QSPR analysis. They most likely investigated the mathematical qualities and characteristics of these many sorts of molecular structures in their research, emphasizing how topological indices might provide useful information about their connections, forms, and other essential elements (Zhang, Muhammad Awais, and Javaid Citation2019). Furthermore, Zhang et al. have provided a physical analysis of heat formation and entropy in Ceria Oxide (Zhang et al. Citation2022). Additionally, Siddiqui, Imran, and Ahmad (Citation2016) and Vukičević and Furtula (Citation2009), might be consulted for a more extensive analysis of these indices. displays many topological indices. In the table
varies from 1 to 3.
Table 1. Degree-based topological Indices: .
The concept of information entropy was initially introduced by Shannon in the field of communication theory (Shannon Citation1948). However, it was later discovered that information entropy is applicable in various domains, including molecular graphs (Bonchev Citation2003; Karreman Citation1955; Rashevsky Citation1955). In the field of chemistry, information entropy serves two primary purposes. For starters, it can be used as a structural descriptor to evaluate the complexity of chemical structures (Bonchev Citation1995). This application is valuable in establishing connections between structural and physicochemical characteristics (Bonchev and Trinajsti Citation1977), numerically distinguishing isomers of organic molecules (Bonchev, Mekenyan, and Trinajsti Citation1981), and classifying natural and synthetic chemicals (Castellano and Torrens Citation2015). Secondly, information entropy is useful for analyzing physicochemical processes and simulating information transmission. Kobozev demonstrated its effectiveness in studying such processes, while Zhdanov employed entropy values to investigate chemical processes involving organic compounds (Zhdanov Citation1979). The mathematical definition of information entropy is as follows:
In the context of this discussion, the logarithm is assumed to have a base of . The variables
,
, and
represent the vertex set, edge set, and the edge weight of the edge
in a graph
.
Several graph entropies have been computed in previous studies using characteristic polynomials, vertex degrees, and graph order. Recent research has focused on graph entropies based on independent sets, matchings, and vertex degrees (Manzoor, Siddiqui, and Ahmad Citation2020). Dehmer and Mowshowitz proposed various relationships between graph complexity and Hosoya entropy (Cao and Dehmer Citation2015). For further exploration and investigation, additional references include (Morowitz Citation1955; Shannon Citation2001; Sol and Valverde Citation2004)
• Randic entropy
After inserting the values from into Equation 1 and performing simplifications, the final expression is as follows:
• Atom bond connectivity entropy
After inserting the values from into Equation 1 and performing simplifications, the final expression is as follows:
• The Geometric arithmetic entropy
After inserting the values from into Equation 1 and performing simplifications, the final expression is as follows:
• First Zagreb entropy
After inserting the values from into Equation 1 and performing simplifications, the final expression is as follows:
• Second Zagreb entropy
After inserting the values from into Equation 1 and performing simplifications, the final expression is as follows:
• Hyper Zagreb entropy
After inserting the values from into Equation 1 and performing simplifications, the final expression is as follows:
• Forgotten entropy
After inserting the values from into Equation 1 and performing simplifications, the final expression is as follows:
• Third Zagreb entropy
After inserting the values from into Equation 1 and performing simplifications, the final expression is as follows:
• First Redefined Zagreb entropy
After inserting the values from into Equation 1 and performing simplifications, the final expression is as follows:
• Second Redefined Zagreb entropy
After inserting the values from into Equation 1 and performing simplifications, the final expression is as follows:
• Third Redefined Zagreb Index entropy
After inserting the values from into Equation 1 and performing simplifications, the final expression is as follows:
Methodology and Novelty
By adding a vertex on each edge, we enlarged the hexagonal cage network graph of order
with
duplicates. We looked into the original graph’s characteristics as well as those of its divided graphs. For the generalized hexagonal cage network graph
of order
with
copies, we specifically computed the entropy measure using the topological indices and compared them computationally. Additionally, we looked at how the graphs and their divided versions behaved. The general Randic entropy and its subdivided form, the first, second, and third Zagreb indices entropies, as well as the general Zagreb index entropy, were all computed in this work.
By adding a vertex on each edge, we enlarged the hexagonal cage network graph of order
with
duplicates. We looked at the characteristics and indices of the parent graph and its child graphs. In particular, we computed and compared the entropy measure for the generalized hexagonal cage network graph
of order
with
copies using the topological indices. We also examined the behavior of both the divided graphs and the original graphs. The general Randic entropy and its subdivided form, the entropies of the first, second, and third Zagreb indices, and the general Zagreb index entropy were all estimated in this work. In addition, we calculated the subdivided graph’s hyper-Zagreb index entropy. See (Manzoor, Siddiqui, and Ahmad Citation2021) for further information on these entropy measures.
In this paper, a unique approach to understanding complex network architectures is presented by integrating topological indices on segmented cage networks with entropy metrics. Through thorough linear regression analysis, we interpret intricate relationships between structural traits and entropy metrics, providing fresh insights into the underlying mechanisms governing network dynamics and functionality.
Hexagonal Cage Network  Drawing Algorithm
Subdivided cage networks are a type of molecular structure composed of interconnected cage-like units that are further subdivided into smaller components. These networks are characterized by their hierarchical structure and are capable of exhibiting complex topological properties. They are intriguing in chemistry and materials research, among other fields, because of their potential applications in molecular engineering and nanotechnology.
Hexagonal Cage network drawing algorithm:
Step 1: Begin with dimensional hexagonal network
.
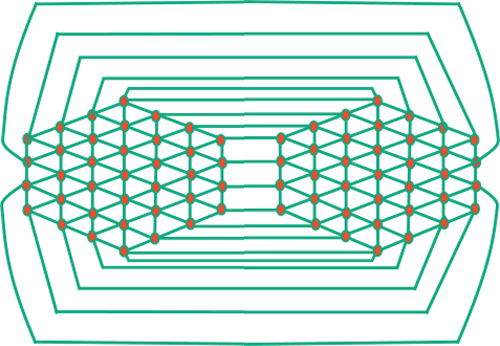
Step 2: Connect the boundary vertices of with the corresponding boundary vertices of its mirror image. By doing so, a cage network is formed that consists of two identical copies of
see .
Figure 1. Generalized cage network.
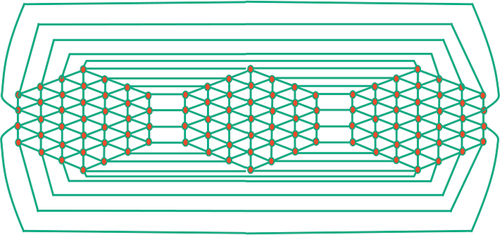
Step 3: To add a third copy of to the cage network, we remove the edges that connect the second half of the second mirror copy. The vertices that are no longer connected form connections with half of the boundary vertices of the third copy. Additionally, we join the boundary vertices of the second half of the third copy with the boundary vertices of the first half of the first copy see .
Figure 2. Generalized cage network.
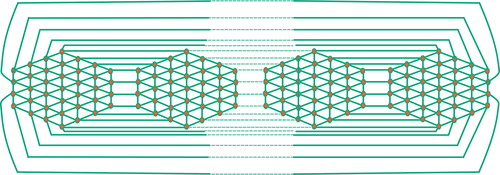
Step 4: By repeating this process of adding new mirror copies, we obtain a generalized hexagonal cage network denoted as
with
copies. Refer to for an illustration of this network.
Figure 3. Generalized cage network.
Result and Discussion
The division of edges of is shown in .
Table 2. Division of edges of .
Utilizing the information from , we obtain various topological indices, the numerical values of which are presented in . The pictorial representation of these indices can be observed in .
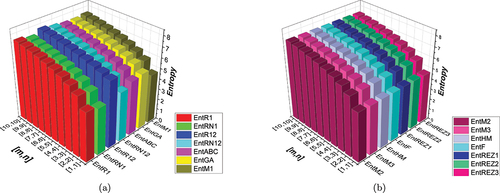
Figure 4. (a) Graphical comparison of different indices (b) a visual comparison of various indices.
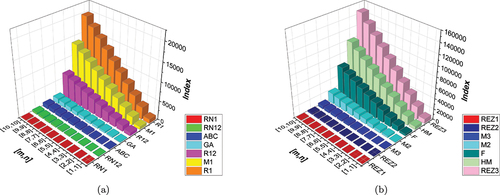
Table 3. Numerical comparison of topological indices.
Based on and [], it is evident that as and
increase, the Randi index for
shows a notably rapid increase compared to the other indices. Similarly, in ()), we can observe that as
and
increase, the Third Redefined Zagreb Index (
) exhibits a more pronounced growth rate compared to the other indices.
The primary focus of our work is on computing the entropy measure using a variety of topological indices. This approach allows us to quantify the complexity or information content of a system based on its topological characteristics.
• Randic entropy of
By utilizing and EquationEquation 2(2)
(2) , we can calculate the Randic index for
.
By utilizing and EquationEquation 2(2)
(2) , we can calculate the Randic index for
.
By utilizing and EquationEquation 2(2)
(2) , we can calculate the Randic index for
.
By utilizing and EquationEquation 2(2)
(2) , we can calculate the Randic index for
.
A numerical comparison between Randic entropies is shown in .
Table 4. Numerical comparison of randic entropies.
• The atom bond connectivity entropy of
Using the information contained in and EquationEquation 3(3)
(3) , We can get the following outcomes:
• The Geometric arithmetic entropy of
Using the information contained in and EquationEquation 4(4)
(4) , We can get the following outcomes:
• First Zagreb entropy of
Using the information contained in and EquationEquation 5(5)
(5) , We can get the following outcomes:
• Second Zagreb entropy of
Using the information contained in and EquationEquation 6(6)
(6) , We can get the following outcomes:
Numerical comparison between and
entropies is shown in .
Table 5. Numerical comparison of and
entropies.
• Third Zagreb entropy of
Using the information contained in and EquationEquation 9(9)
(9) , We can get the following outcomes:
• Hyper Zagreb entropy of
Using the information contained in and EquationEquation 7(7)
(7) , We can get the following outcomes:
• Forgotten entropy of
Using the information contained in and EquationEquation (8)(8)
(8) , We can get the following outcomes.
• First Redefined Zagreb entropy of
Using the information contained in and EquationEquation 10(10)
(10) , We can get the following outcomes:
Numerical comparison between and
entropies is shown in .
Table 6. Numerical comparison of and
entropies.
• Second Redefined Zagreb entropy of
Using the information contained in and EquationEquation 11(11)
(11) , We can get the following outcomes:
• Third Redefined Zagreb entropy of
Using the information contained in and EquationEquation 12(12)
(12) , We can get the following outcomes:
Numerical comparison between and
entropies is shown in .
Table 7. Numerical comparison of and
entropies.
Based on the information presented in and , it is apparent that as and
increase, the entropy of the Randi index for
exhibits a significant growth rate compared to other entropies. Similarly, by referring to and , we can observe that with increasing values of
and
, the entropy of
demonstrates a more pronounced increase compared to other indices.
Figure 5. (a) A visual comparison of several entropies (b) a visual comparison of several entropies.
Our study’s findings shed interesting light on the connection between network complexity and entropy values in subdivided hexagonal networks. We now go into great detail about these results, explaining the trends that have been seen and how they relate to the dynamics and structure of the network.
First, we observed that as the network subdivision level increases, entropy values also grow. This trend suggests that rising network complexity, which is characterized by more subdivisions, leads to higher entropy, which indicates a higher level of unpredictability and uncertainty within the network structure. This finding supports the logical theory that more intricate and linked networks exhibit higher levels of complexity.
Furthermore, our study showed interesting correlations between some topological indices and entropy values. For instance, we found a positive link between some topological features, such as clustering coefficients or degree centrality, and entropy metrics. This implies that more central or clustered nodes tend to contribute higher entropy to the network overall, which could be a reflection of their importance in fostering structural cohesiveness or information flow within the network.
Linear Regression Model
The percentage of the dependent variable’s variance (entropy) that the independent variable or variables (indices) can account for is determined using the R-squared method. The range is 0 to 1, where 1 represents an ideal fit. R-squared values above a given threshold indicate a stronger correlation between the variables. In a statistical model, the standard error is the mean deviation between the anticipated and observed values of a dependent variable. It is a measurement of the degree to which the sample mean differs, on average, from the expected population mean. Inferential statistics and hypothesis testing can benefit from the application of this statistical metric, which evaluates the accuracy and dependability of estimates generated from sample data. It shows the degree of future prediction accuracy of the model. A smaller standard error indicates a better fit between the model’s predictions and the actual data points. The overall significance of the linear regression model is assessed using the F-statistic. It evaluates the linear relationship between the independent and dependent variables and determines its statistical significance. A greater F-statistic indicates a stronger connection.
We can contrast the R-squared values, standard errors, and F-statistics of various linear regression models to decide which one is superior. A higher F-statistic denotes a more significant relationship, a lower standard error denotes better prediction accuracy, and a higher R-squared generally denotes a better fit. We conducted an examination of the entropies associated with the configuration, considering different values of
and
. In , we depict the linear fitting between the indices and the entropy measure. The linear curve fitting strategy was used to determine the connection between entropy and other indices by modifying the underlying parameters using curve fitting techniques. shows the correlation coefficient values for each index in relation to entropy. The linear regression models developed for each index and its connection with entropy are listed below:
Figure 6. Line fit plot of different entropies for .
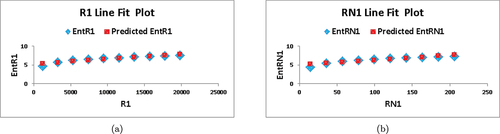
Figure 7. Line fit plot of different entropies for .
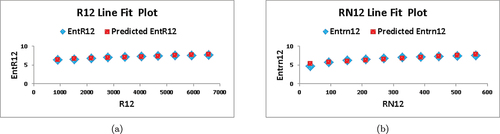
Figure 8. Line fit plot of different entropies for .
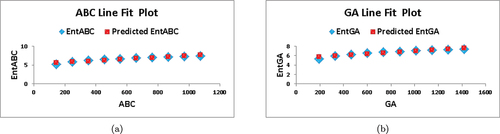
Figure 9. Line fit plot of different entropies for .
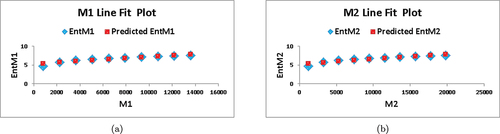
Figure 10. Line fit plot of different entropies for .
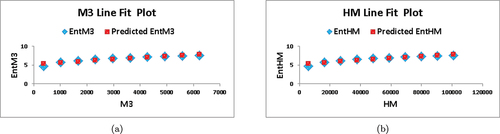
Figure 11. Line fit plot of different entropies for .
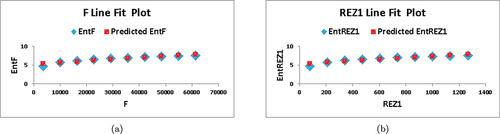
Figure 12. Line fit plot of different entropies for .
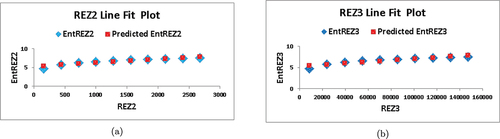
Table 8. Statistical parameters for linear model.
Based on the information provided in and , we observe that for , the values of
and
are the highest among all the indices, indicating a strong correlation with the entropy measure. Furthermore, the value of
is the lowest compared to the other indices, implying superior forecast accuracy. These findings suggest that
serves as the best predictor among the indices considered.
Conclusion
This study investigated the best predictor of entropy as well as the relationship between entropy and numerous topological indices. Among the indices examined were redefined Zagreb indices, ,
,
, atom bond connection entropy, and Randic entropy. The study found that the greatest predictor was the
index because of its strongest correlation with entropy. This implies that, in the situation under discussion,
is a trustworthy indicator for forecasting the entropy measure. The findings show that the entropy of the system is significantly influenced by the structural characteristics represented by the
index. The findings of this research hold significant ramifications for comprehending the correlation between entropy and topological indices in the domain of chemistry. The
index is a good predictor that may be used by researchers to estimate and analyze the entropy values of different chemical systems. Predicting the complexity, stability, and physicochemical characteristics of molecules can benefit from this knowledge. Our findings suggest a linear link between entropy and topological indices based on both theoretical and practical evidence. We have been able to identify key topological features that influence entropy in subdivided cage networks and approximate this relationship.
Key Findings
We have obtained some important results from our study on entropy measurements applied to divided hexagonal networks:
• Entropy and Network Complexity: We found that the degree of network subdivision and entropy values were positively correlated, as was the unpredictability of the network architecture.
• Correlation with Topological Indices: Degree centrality and the clustering coefficient are two examples of topological characteristics that have been discovered to positively correlate with entropy metrics.
Limitations
These observations notwithstanding, our study has several limitations:
• Simplified Model: We study a particular class of complex systems, represented by segmented hexagonal networks. Our results may have limited relevance to other kinds of networks or real-world situations.
• Linear Regression Assumptions:Since linear correlations are assumed when using linear regression analysis to investigate the relationship between entropy measures and network properties, complex network structures may not always support these assumptions.
Future Directions
Consequently, several directions for further study become apparent:
• Diverse Network Types: Examine how entropy metrics can be applied to a wider variety of network types, such as scale-free networks, small-world networks, and real-world networks from other domains.
• Nonlinear Analysis Techniques: Beyond the constraints of linear regression, investigate nonlinear analysis techniques to capture more intricate correlations between entropy metrics and network properties.
Authors Contributions
This work was equally contributed by all writers.
Supplemental Material
Download Zip (895.2 KB)Data Availability Statement
The data used to support the findings of this study are cited at relevant places within the text as references.
Disclosure Statement
No potential conflict of interest was reported by the author(s).
Supplementary Material
Supplemental data for this article can be accessed online at https://doi.org/10.1080/08839514.2024.2387490
References
- Bollobs, B., and P. Erds. 1998. Graphs of extremal weights. Ars Combinatoria 50:225–22.
- Bonchev, D. 2003. Complexity in chemistry, introduction and fundamentals, Taylor and Francis, Boca Raton, (2003). FL, USA 2:1–00.
- Bonchev, D. G. 1995. Kolmogorov’s information Shannon’s entropy, and topological complexity of molecules. Bulgarian Chemical Communications 28 (3–4):567–82.
- Bonchev, D., O. V. Mekenyan, and N. Trinajsti. 1981. Isomer discrimination by topological information approach. Journal of Computational Chemistry 2 (2):127–48. doi:10.1002/jcc.540020202.
- Bonchev, D., and N. Trinajsti. 1977. Information theory, distance matrix, and molecular branching. Journal of Chemical Physics 67 (10):4517–33. doi:10.1063/1.434593.
- Cao, S., and M. Dehmer. 2015. Degree-based entropies of networks revisited. Applied Mathematics and Computation 261:141–47. doi:10.1016/j.amc.2015.03.046.
- Castellano, G., and F. Torrens. 2015. Information entropy-based classification of triterpenoids and steroids from Ganoderma. Phytochemistry 116:305–13. doi:10.1016/j.phytochem.2015.05.008.
- Chu, Z. Q., M. K. Siddiqui, S. Manzoor, S. A. K. Kirmani, M. F. Hanif, and M. H. Muhammad. 2023. On rational curve fitting between topological indices and entropy measures for graphite carbon nitride. Polycyclic Aromatic Compounds 43 (3):2553–70. doi:10.1080/10406638.2022.2048034.
- Çolakoğlu Havare, Ö., and Havare. 2019. Çoklu Doğrusal Regresyon Kullanılarak Monokarboksilik Asitlerin Bazı Termodinamik Özelliklerin Belirlenmesi. Bitlis Eren Üniversitesi Fen Bilimleri Dergisi 8 (2):466–71. doi:10.17798/bitlisfen.500500.
- Estrada, E., L. Torres, L. Rodríguez, and I. Gutman. 1998. An atom-bond connectivity index. Modelling the enthalpy of formation of alkanes. Indian Journal of Chemistry 37A:849–55.
- Furtula, B., and I. Gutman. 2015. A forgotten topological index. Journal of Mathematical Chemistry 53 (4):1184–90. doi:10.1007/s10910-015-0480-z.
- Gao, W., M. Kamran Siddiqui, M. Naeem, and N. Abdul Rehman. 2017. Topological characterization of carbon graphite and crystal cubic carbon structures. Molecules 22 (9):1496. doi:10.3390/molecules22091496.
- Ghani, M. U., F. J. Campena, S. Ali, S. Dehraj, M. Cancan, F. M. Alharbi, and A. M. Galal. Characterizations of chemical networks entropies by K-banhatii topological indices. Symmetry 15 (1):143. Accessed January 3, 2023. doi:10.3390/sym15010143.
- Gutman, I. 2013. Degree-based topological indices. Croatica Chemica Acta 86 (4):351–61. doi:10.5562/cca2294.
- Imran, M., M. K. Siddiqui, M. Naeem, and M. A. Iqbal. 2018. On topological properties of symmetric chemical structures. Symmetry 10 (5):1–21. doi:10.3390/sym10050173.
- Karreman, G. 1955. Topological information content and chemical reactions. The Bulletin of Mathematical Biophysics 17 (4):279–85. doi:10.1007/BF02477754.
- Lal, S., V. K. Bhat, and S. Sharma. 2024. Computational analysis of nm-polynomial based topological indices and graph-entropies of carbon nanotube Y-junctions. Journal of Mathematical Chemistry 62 (1):73–108. doi:10.1007/s10910-023-01520-5.
- Lu, J., H. Mutee-Ur-Rehman, S. Nazeer, X. An, and T. Rashid. 2022. The edge-weighted graph entropy using redefined Zagreb indices. Mathematical Problems in Engineering 2022:1–12. doi:10.1155/2022/5958913.
- Manzoor, S., M. K. Siddiqui, and S. Ahmad. 2020. On entropy measures of molecular graphs using topological indices. Arabian Journal Chemistry 13 (8):6285–98. doi:10.1016/j.arabjc.2020.05.021.
- Manzoor, S., M. K. Siddiqui, and S. Ahmad. 2021. Degree-based entropy of molecular structure of hyaluronic acid curcumin conjugates. The European Physical Journal Plus 136 (1):1–21. doi:10.1140/epjp/s13360-020-00976-7.
- Morowitz, H. 1955. Some order-disorder considerations in living systems. The Bulletin of Mathematical Biophysics 17 (2):81–86. doi:10.1007/BF02477985.
- Randic, M. 1975. Characterization of molecular branching. Journal of the American Chemical Society 97 (23):6609–15. doi:10.1021/ja00856a001.
- Ranjini, P. S., V. Lokesha, and A. Usha. 2013. Relation between phenylene and hexagonal squeeze using harmonic index. International Journal of Graph Theory 1 (4):116–21.
- Rashevsky, N. 1955. Life, information theory, and topology. Bulletin of Mathematical Biology 17 (3):229–35. doi:10.1007/BF02477860.
- Rauf, A., M. Naeem, J. Rahman, and A. V. Saleem. 2022. (QSPR study of ve-degree based end vertice edge entropy indices with physio-chemical properties of breast cancer drugs. Polycyclic Aromatic Compounds 23 (2):1–14.
- Ravi, V., Ã. Ã. Natarajan Chidambaram, Ö. Çolakoğlu, H. Ahmed, S. Jaganathan, and J. Jaganathan. 2023. QSPR study and distance-based new topological descriptors of some drugs used in the COVID-19 treatment. Journal of Mathematics 20 (23):1–15. doi:10.1155/2023/1187415.
- Salamat, N., M. Kamran, S. Ali, M. A. Ashraful Alam, R. Hussain Khan, and F. Tchier. 2021. Several characterizations on degree-based topological indices for star of David network. Journal of Mathematics 2021:1–11. doi:10.1155/2021/9178444.
- Shanmukha, M. C., A. Usha, N. S. Basavarajappa, and K. C. Shilpa. 2021. Graph entropies of porous graphene using topological indices. Computational & Theoretical Chemistry 1197:113142. doi:10.1016/j.comptc.2021.113142.
- Shannon, C. E. 1948. A mathematical theory of communication. Bell System Technical Journal 27 (3):379–423. doi:10.1002/j.1538-7305.1948.tb01338.x.
- Shannon, C. E. 2001. A mathematical theory of communication. ACM SIGMOBILE Mobile Computing and Communications Review 5 (1):3–55. doi:10.1145/584091.584093.
- Shirdel, G. H., H. RezaPour, and A. M. Sayadi. 2013. The hyper Zagreb index of graph operations. Iranian Journal of Mathematical Chemistry 4 (2):213–20.
- Siddiqui, M. K., M. Imran, and A. Ahmad. 2016. On Zagreb indices, Zagreb polynomials of some nanostar dendrimers. Applied Mathematics and Computation 280:132–39. doi:10.1016/j.amc.2016.01.041.
- Sol, R. V., and S. I. Valverde. 2004. Information theory of complex networks: On evolution and architectural constraints. Complex Networks Lectures Notes in Physics 650:189–207.
- Vukičević, D., and B. Furtula. 2009. Topological index based on the ratios of geometrical and arithmetical means of end-vertex degrees of edges. Journal of Mathematical Chemistry 46 (4):1369–76. doi:10.1007/s10910-009-9520-x.
- Wang, C., S. Wang, and B. Wei. 2016. Cacti with extremal PI index. Transactions on Combinatorics 5 (4):1–8.
- Zhang, X., H. Muhammad Awais, and M. Javaid. 2019. Molecular interactions of renin with chikusetsusaponin IV and Momordin IIc. Journal of Chemistry 2019:1–7. doi:10.1155/2019/6720616.
- Zhang, X., A. Rauf, M. Ishtiaq, M. K. Siddiqui, and M. Hussain Muhammad. 2022. On degree based topological properties of two carbon nanotubes. Polycyclic Aromatic Compounds 42 (3):866–84. doi:10.1080/10406638.2020.1753221.
- Zhang, X., X. Wu, S. Akhter, M. Kamran Jamil, J.-B. Liu, and M. Reza Farahani. 2018. Edge-version atom-bond connectivity and geometric arithmetic indices of generalized bridge molecular graphs. Symmetry 10 (12):751. doi:10.3390/sym10120751.
- Zhao, X., M. K. Siddiqui, S. Manzoor, S. Ahmad, M. H. Muhammad, and J. B. Liu. 2023. On computation and analysis of entropy measures for metal-insulator transition super lattice. IETE Journal of Research 3 (5):1–12.
- Zhdanov, Y. A. 1979. Information entropy in organic chemistry. Rostov University (In Russian) 1:1–20.