
 ?Mathematical formulae have been encoded as MathML and are displayed in this HTML version using MathJax in order to improve their display. Uncheck the box to turn MathJax off. This feature requires Javascript. Click on a formula to zoom.
ABSTRACT
There are often discrepancies in complementary trade data published by different countries. This article develops a method that compares the data for each country with those of its partner countries and assigns reliability scores which are then used to calculate a harmonized dataset. The whole process, from procuring and preparing the data to calculating the harmonized dataset, is described and discussed. The focus of this study is methodological. No actual analysis of trade data is provided. The approach contains numerous elements that might be useful when reconciling data from different sources without external indicators for true values.
I. Introduction
International trade statistics collected by customs or statistical authorities reveal much about the international trade system, its markets, and evolution. From these data, the market shares of export countries can be calculated for a particular resource, and supply risks and resource criticality can be assessed. Similarly, when looking at the evolution of net exports of countries over time, emerging exporters and, thus, potential trade partners can be identified.
Unfortunately, international trade data are neither complete nor very reliable or consistent. Many developing countries do not report their respective data, while for most reported data, the exporter and importer list different figures.
For these reasons, it is helpful to use mirrored data (matching reports from the other country involved in a specific trade flow) to maximize data availability and quality, yielding a corrected harmonized dataset for further analysis. This study presents a methodology to correct and analyze mineral resource trade data in several steps. For each step, we refer to alternative approaches from the literature. The following methods proposed for harmonizing trade datasets with the help of mirrored data are referenced in this article:
the Global Trade Analysis Project (GTAP), preparing data for its computable general equilibrium (CGE) model (Gehlhar Citation1996);
NBER Working Paper 11040, “World Trade Flows 1962–2000” (Feenstra et al. Citation2005);
the Base pour l’Analyse de Commerce International (BACI) database of the French research institute Centre d’Etudes Prospectives et d’Informations Internationales (CEPII) (Gaulier and Zignago Citation2010);
the World Input-Output Database (WIOD) (Dietzenbacher et al. Citation2013; Timmer et al. Citation2015);
an analysis of copper trade flows (Tercero Espinoza and Soulier Citation2016); and
the OECD-WTO Balanced Trade in Services database (Fortanier et al. Citation2017).
Faced with such a wide range of approaches to this complex task, the Organization for Economic Cooperation and Development’s (OECD) Working Party on International Trade in Goods and Services Statistics published the first version of a coordinated, modular, and transparent approach for creating a balanced international merchandise trade statistics database (Fortanier and Sarrazin Citation2016). It was meant to produce a collectively-owned benchmark dataset to serve as a resource for efforts like the Trade in Value Added (TiVA) database. The reason we developed our own unique approach instead of following this coordinated approach is twofold.
Firstly, the OECD study has not been consistently updated; in particular, the numbered, country-specific modules have not been continually added as originally planned. The modules were to be developed with input from bilateral trade asymmetry meetings and, hence, held a lot of promise, but the existing two modules by themselves do not offer much value.
Secondly, like much of the existing literature on harmonizing trade data, the OECD’s approach uses United Nations (UN) Comtrade data as a starting point, whereas we use data from a commercially available database, the Global Trade Atlas (GTA) of IHS Markit, formerly Global Trade Information Services, Inc. Our reasons for using data from the Global Trade Atlas are outlined in the next section, the most important being better data availability and the use of automatic unit conversions.
However, we appreciate their effort in bringing transparency to these approaches and making it easier to compare them. We will, therefore, refer to the corresponding modules of the OECD approach for each step of this methodology and discuss the commonalities and differences between these and other approaches as we go along.
This article is structured as follows: We begin by describing the raw data and our choice of data source, continuing with the steps necessary to prepare the raw data for harmonization and then describing the harmonization itself. In Section 3, we discuss the dataset resulting from our correction process by showing a sample distribution of the differences between country reports, listing countries’ reliability scores, and showing their evolution over time. We also provide descriptive statistics about our dataset and show examples of the harmonized values our correction methodology produces. We then describe the different ways in which we attempted to compare the performance of our approach to that of others, or the accuracy of the resulting harmonized dataset to those from others’ approaches. We discuss the challenges involved in such a comparison and end with numerous suggestions for further research. Due to licensing issues, and because the focus of this article is the correction and analysis process for and not actual mineral resource trade data, no extensive raw or harmonized data are provided.
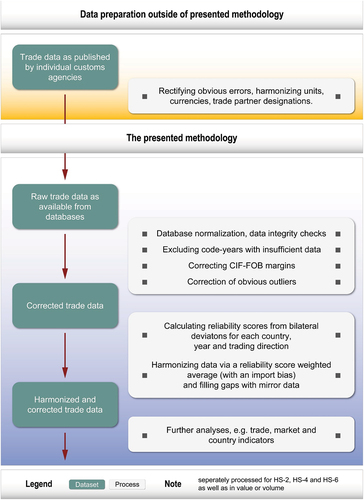
As you follow the steps of the methodology, please refer back to for an illustration of the process.
Figure 1. Flow chart of trade data processing. Source: Author’s compilation.
II. Data and methodology
Our methodology, as detailed here, was in many ways shaped by the idiosyncrasies of our dataset and our use case. With different intended uses, other choices might be more fitting, while with different data sources or data on trade in different goods, parts of the data description or preparation might not be suitable or applicable.
While we encourage all readers to examine these questions of transferability and applicability, we believe the core of our methodology, the specific way in which we used mirrored data and reliability scores to harmonize conflicting reports in a set of trade data, is useful for a large share of researchers working with such data and could potentially be transferable to datasets outside of international trade, where many researchers report inconsistent values.
This section is divided into several subsections that describe our process step-by-step. We begin by discussing the available raw data and then move on to different ways in which these data were cleaned and prepared. Finally, we discuss data harmonization.
Raw data
Import and export data are generally collected and published by a country’s customs authorities. For each trade flow, the data include information on the good, trade partner, and direction of trade as well as the value and quantity in tons (or a unit appropriate for the respective commodity). Commodities are classified according to the categories defined in the Harmonized Coding System of the World Customs Organization (WCO).
Each category is identified by a six-digit number (HS-code), and these numbers are assigned in a hierarchical way such that the codes of similar products only differ in the last two digits. For example 720110 is the code for “Non-alloy pig iron in pigs, blocks or other primary forms, containing, by weight, ≤ 0.5% of phosphorus” while 720150 refers to “Alloy pig iron and spiegeleisen, in pigs, blocks and other primary forms.” Both are subcategories of 7201, “Pig iron and spiegeleisen, in pigs, blocks and other primary forms,” which is, in turn, a subcategory of Chapter 72, “Iron and steel.”
Some countries further subdivide the six-digit codes into eight or ten-digit codes. However, as specifications beyond the six-digit level are not standardized across countries, six-digit codes remain the most detailed data for broad analyses of international trade (Statistisches Bundesamt Citation2018; WCO Citation2017; Zollportal Citation2019). Our dataset on trade in mineral resources is comprised of all product groups with six-digit HS-codes being inside the chapters shown in .
Table 1. Chapters of the HS-codes included in our dataset for mineral resource trade.
One important thing to keep in mind when working with such data is that the Harmonized Coding System is not static. As trade patterns change and some distinctions between goods become less relevant while new distinctions are made between others, and as trade increases in some goods and decreases in others, the system is regularly revised. In these revisions, some codes are discontinued, while new codes are added.
This becomes relevant for our approach wherever individual countries continue to report data in obsolete codes or fail to report data in newly added codes after revisions have taken effect. Unfortunately, there is no easy solution to this problem. One approach mentioned in the literature that can be particularly helpful for running time-series analyses on trade of products whose codes were subject to revisions is to pool the reported trade from multiple codes in such a way that the definition of the pool was unaffected by said revisions (Miao and Fortanier Citation2017). As we did not have a particular timeframe for time-series analyses in mind, but rather aimed to provide a dataset that could serve as the basis for analyses with all possible time frames, some of which might end before or begin after a revision took place, we did not choose this approach so as to not limit the granularity of our dataset unnecessarily.
Instead of pooling codes, we left the data as they were. Our methodology is designed to correct for the kind of country-specific reliability issues that the reporting of trade in outdated codes produces. Another possible approach would be to identify cases where reporters keep using deleted codes or fail to report data in newly added ones and simply exclude data from these reporters for the affected codes for the years following the revision.
While HS-codes are standardized, the reporting by partner countries is not. Reporting countries might refer to them by different names or aggregate them differently. Some include all reports for dependent islands and overseas territories in the data of the sovereign country, while others report data for many such areas separately.
While the names can easily be harmonized and most databases provide trade data with such harmonization already completed, the aggregation issue is more complex. Sometimes, it is just a question of deciding on one definition for countries and aggregating all reports accordingly. Commercial data providers generally do that, where it is possible. As part of Module A, “Data collection, organization, harmonization of geography,” of their coordinated approach, Fortanier and Sarrazin (Citation2016) use the same official geographical definition as the national reporter. For example, they follow France’s decision to include trade for Monaco in its own trade data, even though some external trade partners report the data for Monaco separately.
However, sometimes disaggregation is required and disaggregated data are simply unavailable. To avoid the guesswork for all cases in which aggregated reports need to be disaggregated, and because dependent islands and overseas territories are mostly insignificant trading partners anyway, the methodology described here simply uses the data as reported.
Beyond the names and possible aggregation of trade partners, partner attribution might also follow different standards, known as the general and special trade systems. The special trade system excludes customs warehouses, all types of free-zones, and premises for inward processing from the statistical territory, while the general trade system does not. Most databases provide trade data uniformly in one of the two systems. This analysis only uses data from the general trade system.
To avoid having to collect data from all customs authorities individually, it is also possible to draw upon existing databases. As mentioned above, these harmonize the names of the reporter and partner countries, making it much easier to match two reports about the same trade flows. The UN Comtrade database reports yearly totals for the reporting countries. The same data can be accessed from the World Integrated Trade Solution (WITS) of the World Bank in cooperation with the United Nations Conference for Trade and Development (UNCTAD) and the International Trade Center (ITC) Trade Map (a cooperation of the World Trade Organization (WTO) and UNCTAD).
Additionally, there are commercial databases for trade data, such as the Global Trade Tracker, Trade Data Monitor, and Global Trade Atlas. The Global Trade Atlas, as our dataset of choice, provides data on country-specific codes beyond the six-digit level, aggregates diverging partner country categories as mentioned above, provides data uniformly in either of the two trade systems used for partner attribution, converts units and currencies, and discloses information on where countries do not collect or choose not to disclose some of the more detailed data. Finally, the GTA also provides more data (more reporters and more historical data) and a better temporal resolution than Comtrade, offering quarterly and monthly data. However, despite all the conveniences of commercially available datasets, the basic problem of fundamentally separate and often conflicting reports from different sources that do not easily make up a coherent picture remains, even in their data.
Despite the wealth of data that these databases provide, data availability also remains a key issue. For many years, especially those that lie further back, only data from a handful of reporters are available. As these reporters collectively represent only a small fraction of actual trade, including these years in an analysis can significantly distort the results. This is why we have only included data for those years in our analysis for which at least 10 countries reported export data and at least 10 countries reported import data.
Value versus volume
Another pivotal question in any analysis of international trade is the decision whether the raw data used should be value data or volume data. Traditionally, analyses of the mineral resources market favor volume data. Traded ore volumes do not necessarily correspond to traded metal volumes because grades can be very heterogeneous but looking at volumes at least eliminates exchange rate and price fluctuations as additional variables.
However, there is often a mismatch between the units that different countries apply to volume data they report in the same HS-code category, e.g., weight and number. This rules out any meaningful comparison. While all units for which useful conversion factors exist are convertible into units of weight through the Global Trade Atlas, some reports remain incompatible. Furthermore, there are cases in which individual countries report volume data for one product in two different units or not at all. On the other hand, it is the monetary quantities on which customs duties are levied, and the customs agencies, therefore, have a strong incentive to avoid gaps and inaccuracies in their data collection (Bacchetta et al. Citation2012, 39). For all these reasons, value allows for a better comparison between countries in most scenarios, which is why value in US$ was chosen as the focus for the methodology in this study.
Data in monetary units can be reported in different standards. Export data are often reported as “free on board” (FOB), the price at which a raw material could be bought at the port of exit. Import data are generally reported as “cost, insurance, freight” (CIF), which is the FOB price plus all costs incurred until arrival in the destination country except import duties. While not all countries handle it this way and a few use different reporting standards, freight and insurance costs need to be adjusted for in almost all cases to permit comparison of the data reported by the importing and exporting countries, respectively.
Gaulier and Zignago (Citation2010) apply such a correction to the Comtrade data for their BACI database in the form of a regression analysis, using estimated CIF/FOB margins and controlling for factors like distance, a common border, being landlocked, and differences between commodities. For example, parameters like the volume, consistency, and hazardousness of commodities can influence freight costs. Dietzenbacher et al. (Citation2013) follow a similar model, estimating CIF/FOB margins using a gravity model.
The OECD developed a comparable methodology and benchmarked it using some of the few data on CIF/FOB margins that customs authorities have published (Miao and Fortanier Citation2017). Where data were only available in standards other than CIF or FOB, but sufficiently similar in definition, they used these values to estimate freight and insurance cost margins instead. For New Zealand, for example, “value for duty” (VFD) import values were used because CIF were not available. The findings in the form of margin estimates for freight and insurance costs per good, year, and trade relation can be retrieved from a public database. We used these to prepare the data for our correction and harmonization methodology, eliminating the systematic gap between reported import and export data and adjusting both to the FOB standard. In the coordinated approach, this is Module B, “Conversion to common valuation (FOB)” (Fortanier and Sarrazin Citation2016).
Data cleaning
The data also need to be cleaned, eliminating obvious outliers that occur for numerous reasons. For instance, a “kg” figure may be reported in tons or vice versa. Other errors may result from slipped or mistaken decimal and thousands separators (Tercero Espinoza and Soulier Citation2016). Such outliers can have a huge impact on the analysis results, even of aggregated data, because of their considerable deviation from the true values. These errors, since they are limited to individual data points and can occur even in data from countries that are otherwise very reliable, are not appropriately addressed by our method of data harmonization, which relies on reliability scores for individual reporters. The correction of such errors is, therefore, a major reason for cleaning the data prior to our main harmonization.
One method to address such outliers described in Fortanier et al. (Citation2017) involves manually editing cases that can be clearly identified. Gaulier and Zignago (Citation2010) exclude atypical and very influential values that they identify using Cook’s distance. Cook’s distance describes the influence of the inclusion or omission of individual observations in a regression analysis (Cook Citation1977). Tercero Espinoza and Soulier (Citation2016) identify as outliers those data points that deviate by several orders of magnitude from the directly preceding and succeeding data points in a time series, i.e., from the preceding and following year. They do not omit the outlier entirely but correct each with an appropriate factor, e.g., a factor of 0.01 for a deviation by a factor of 100. The coordinated approach does not include a correction of outliers (Fortanier and Sarrazin Citation2016).
The methodology presented here follows the approach used by Tercero Espinoza and Soulier (Citation2016). In the absence of a process to reliably identify whether an unusual value resulted from a mistake or a genuine fluctuation in trade flows, the calibration of any automatic data cleaning procedure must, as all of the aforementioned approaches do, rely on subjective judgment.
By our subjective judgment, automatically correcting values that differ from the preceding and succeeding data points by just one order of magnitude or a factor of 10 seemed to result in the correction of too many accurate values (Type 1 error), while only correcting deviations of at least a factor of 1,000 seemed to miss significant outliers (Type 2 error).
Corrections were, therefore, made for deviations of two orders of magnitude or more. Additionally, only sets of values (data point and the one preceding and succeeding it) where the smallest exceeded 100 dollars were corrected, as it seemed to us as if instances of intermittent trade would otherwise have triggered frequent and unwarranted corrections.
For the over 6 million trade flows in the considered dataset, this approach identified and corrected only 121 outliers. We suggest a possible improvement of this approach in our suggestions for further research.
Other peculiarities of international trade data are classified data or data that are not reported in full detail for other reasons. Some countries publish data for some products or product groups at an aggregate level (in terms of HS-codes) without giving details of the underlying subcategories. A further complication is the fact that this need not be true for all the data in those subcategories. Countries may publish some data only at the aggregate level but also some data for individual subcategories. Similarly, for example, in some trade to and from the European Union, the partner country may not be disclosed.
Dietzenbacher et al. (Citation2013) allocate such confidential trade proportionally across trade partners, while Fortanier and Sarrazin (Citation2016) create a separate geographical category for unspecified trade. The Global Trade Atlas similarly provides explicit categories for trade identified as “classified,” and we have followed that approach in our methodology.
Beyond CIF/FOB margins, classified data, and outliers, the UN Trade Statistics especially stresses the role of partner attribution as a source for persistent asymmetries in country reports. As mentioned above, partner attribution can follow different standards and it might at times even be impossible for an exporting country to know the final destination of a product (UN Trade Statistics Citation2019). Similarly, it might at times be difficult for a country to identify or collect data on the true country of origin of incoming goods. As a result, some partner countries are attributed on a country of consignment or country of last known destination basis. While using data from the GTA rectifies the standards issue, a systematic correction is very difficult for the other issues of partner attribution. We mention two possible approaches for further correction in our suggestions for further research.
Ideally, the numbers reported by the exporting and importing countries should be identical after correcting for CIF/FOB margins, obvious outliers, and addressing the issues of classified data and partner attribution, but this is rarely the case. Inaccuracies in the correction of CIF/FOB margins, general differences in the assessment of the value of the traded goods, further partner attribution issues, but also misclassifications of goods as well as simple input errors are just some of the sources of further asymmetries. Some effects appear to be systematic and related to individual countries or trade flows, while many others seem stochastic in nature.
The coordinated approach of the OECD Working Party highlights the fact that organizing bilateral asymmetry talks between the reporting agencies of different countries is the best method to resolve these asymmetries, being the only way of achieving completely reliable results and the total resolution of any asymmetries for individual trade flows (Fortanier and Sarrazin Citation2016). The OECD approach, therefore, allows for a large number of modules to be added to correct for these trade flow-specific effects. The first version of their approach includes such corrections for Hong Kong reexports (Module 1) and Swiss monetary gold (Module 2). However, until international organizations resume the slow and time-consuming process of bringing countries together for bilateral talks regarding their reporting asymmetries and to release data on their findings, this will not help with a systematic correction of the remaining 99.99% of trade flows.
Hence, the use of mirrored data (the data reported by both the importer and exporter on the same trade flow) has emerged in the literature as the most common strategy to deal with these issues and further harmonize trade data.
Mirrored data also help with another matter concerning trade data: missing values. Numerous countries are not included in commonly used databases, even for recent years. This is especially true for developing countries, which often play an important role in resource trade. However, as long as one of the countries involved in a trade flow reports the relevant data, mirrored data allow this trade to be examined and pieced together to create a picture of a developing country’s exports from all its individual partners’ reports.
Several methodologies have been proposed on how exactly mirrored data should be used to correct these discrepancies and also make up for missing data, yielding a harmonized and consistent dataset for further analysis.
Other’s approaches to data harmonization
To achieve a harmonized dataset wherever the exporter and importer involved in a trade flow have reported contradictory data, Tercero Espinoza and Soulier (Citation2016) take the average of both numbers.
Another approach is to trust import over export data wherever contradictions occur. While counter arguments do exist, import data are generally regarded as more reliable because imported goods are subject to import duties, giving customs authorities and traders an incentive to record these data accurately (Bacchetta et al. Citation2012; Feenstra et al. Citation2005; Hamanaka Citation2013; United Nations Citation1981). Furthermore, since the country of origin determines import levies and is usually easier to trace, it is not just the value of the traded commodities that is more accurate in import data, but also the reported country of origin, with authorities making sure that it is not just the port from which a good was last shipped (Gaulier and Zignago Citation2010; UN Trade Statistics Citation2019). This is also the reason why Feenstra et al. (Citation2005) applied this methodology to their analysis of global trade flows in the second half of the 20th century, and Dietzenbacher et al. (Citation2013) and Timmer et al. (Citation2015) to WIOD data.
Yet another approach is to calculate reliability scores for all countries and then choose the data from the country with the better score for any trade flow. Gehlhar (Citation1996) employs this approach to clean data for his CGE. For each commodity, his reliability score represents the percentage of trade volume for which the absolute value of the difference between a country’s own figures and partner reports lies within 20% of the import value. However, each importer’s and exporter’s worst partner is excluded from the calculation of their reliability score, meaning that reporters are not punished for bad partners.
The OECD and WTO also use a reliability or symmetry index to jointly create and publish databases of consistent merchandise and services trade data. In the coordinated approach, this is Module C, “Calculate ‘symmetry index-weighted’ bilateral trade by HS 6-digit product.” These authors do not merely trust the more reliable source, but instead use an average weighted by the scores of both sources (Fortanier and Sarrazin Citation2016; Fortanier et al. Citation2017). Like Gehlhar’s reliability scores, their symmetry index reflects the share of trade volume where a country and its partner reported the same figures. However, their index is specific, not just to the reporter, direction, and commodity, but also to the year in which the trade took place. Additionally, their criterion for a match is a difference between the reported and mirrored values being of no more than 10% of the sum of both values.
CEPII also uses reliability scores and weighted averages to calculate harmonized trade data but differ from the other methodologies mentioned in that they employ a regression analysis for calculating the scores. Another difference is that their reliability scores are not based on the share of reports that exceeds some threshold of difference to the mirrored value, but instead takes into account the absolute value of the difference. Instead of treating all differences in reporting equally, large mistakes have a larger impact than smaller ones in their methodology. CEPII applies all this to Comtrade data for their BACI database (Gaulier and Zignago Citation2010).
Data harmonization
The approach adopted for this study is to use the weighted average of a simple reliability score. It does not use regression analysis but allows the scale of the divergences to impact the score as described below. A score is calculated for each country and year, as well as for its role as importer or exporter. This allows countries to be “rewarded” for improvements over time or for having particularly accurate export data even when their import data are not as stellar. There is a trade-off in using year-specific reliability scores, as time-varying scores introduce yet another source of variation when conducting time-series analyses. However, as the reliability of the data provided by different countries should indeed be expected to vary over time and as conducting time-series analyses was not the only use we envisaged for our harmonized dataset, we judged this approach to be the more fitting one for us.
The reliability score described here differs from those used in the approaches by Gehlhar, the OECD, and WTO, as well as CEPII mentioned earlier, in that it does not take into account commodity-specific effects. It is possible that factors associated with individual commodities and how they are handled and accounted for create differences in reporting between countries. Especially when working with reliability scores to examine trade in baskets of goods that are more heterogeneous than mineral resources, the significance of this effect should be examined. If certain countries in such a dataset traded more in products that, by their nature, tended to have larger errors while others traded more in products where deviations tended to be smaller, ignoring commodity-specific effects could lead to significant distortions. In our case of trade in mineral resources, however, because the products have a certain degree of homogeneity and because of the large scale of international cooperation on standardizing reporting, we assume most differences in reporting to be attributable to the customs agencies, including the extent to which they participate in such efforts, follow international guidelines, and have effective policies and processes. Basing the calculation of reliability scores on all trade flows reported by a particular agency in a certain year and direction, instead of separating these reports further by all the hundreds of goods traded, considerably increases the average number of reports that form the basis for the calculation. Improving the basis for calculation and, hence, the robustness of the scores so significantly, going from sometimes just a handful to hundreds or thousands of reports, seemed worthwhile, although it meant not being able to account for commodity-specific effects.
To obtain the reliability score for any trade flow for which data from both involved countries exist, the difference between the reported values of both countries is calculated. This is expressed as a percentage of the higher value. For instance, if country reports exports of a commodity worth US$50 m to country
, and country
reports imports of that same commodity from country
worth US$70 m, the difference between the two values as a percentage of the higher value is (70–50)/70 = 29%. The difference of all import or export flows of a particular country and year are then averaged, and this average deviation is taken as the country’s import and export score of data reliability.
One important consideration in this process are zero values. Customs authorities do not normally report zeros, because their focus is on trade that actually occurs. However, to calculate differences between the reports by different countries, such implicit zero values (which constitute a 100% deviation from any positive value) have to be distinguished from actual missing data (which do not constitute a deviation from other values).
At first glance, both cases look the same, with one country reporting data for a particular trade flow and the partner country not reporting any such data. However, implicit zeros can be identified by the fact that the partner country in question did report data on other trade flows that year and could, hence, also be expected to have reported data on this particular trade flow, if it had been aware of any such trade. Using this approach, deviations of 100% where the zero value was not an implicit zero but merely missing data were omitted.
Another difficulty with regards to zero values are those cases in which both countries report implicit zeros. In most trade relationships, only a small number of all possible commodities are traded in any particular year (say, Mongolia and Paraguay). As a result, most trade flows are zero-zero. If one did not limit the calculation of the reliability score to those cases in which at least one partner gives an indication of trade having occurred, the millions of consistent zero-zero reports would dominate the averages. All these cases of 0% deviation would benefit especially those reporting countries with a low number of traded products. Therefore, we excluded all these cases of no trade from the calculation of our reliability scores.
Based on these considerations, we still have to address in detail the case where both trade partners report values and the case where one trade partner reports a value
and the other an implicit zero (see ).
Table 2. Overview of the different cases of trade data reporting by and
.
The methodology can be formally described as follows: Let countries be trade partners,
a trade direction (
the opposite direction),
a product group (HS-code),
a year, and
and
the corresponding trade values reported by
respectively. Our goal is to define a harmonized trade value
.
Thus, the deviation of the two reported trade values is calculated by:
The average deviation over all
deviations of a country
’s imports or exports in a year for all HS-codes
and all partner countries
is computed from that as follows:
Thus, the reliability score calculated can then be used to turn the conflicting data points for each trade flow into a weighted average “consensus” estimate of actual trade. Like in the CEPII methodology, the weight or trust factor assigned to the respective data points is calculated as the ratio of the reliability scores of the two involved countries. If there is only one data point, it will receive a weight of 100%. If the mean deviation of reports of country is 20% to all partner countries and the mean deviation of country
is 50%, the report of country
is given a weight of
and that of country
a weight of
. With the reported data from the example above (US$50 m for country
and US$70 m for country
), the corrected figure for this trade flow is, hence,
. This methodology, therefore, assigns weight in proportion to the reliability scores. For instance, if country
is twice as reliable as country
, the data of country
will also be given twice the weight. Note that this is a very cautious, defensive approach to correction, because even a very unreliable partner is still given enough weight for his reported data to have a considerable impact on the harmonized value. We deem that appropriate given the uncertainties that surround the calculation of the reliability scores. Formally, the two weights are given by:
This implies that:
With both originally reported trade values and
weighted, the harmonized trade value
is calculated as:
In the harmonized dataset, this value replaces the originally reported values for both countries. The following table summarizes the different cases of reporting by
and
regarding the existence of
as well as the existence and calculation of
.
To take into account the systematic difference in reliability between import and export data mentioned earlier, the weight for the report of the importing country was increased by 10% whereas the weight for the exporting country was decreased by 10%. Together, this adds up to a trust bonus of 20% for imports.
These numbers were chosen after a benchmarking process, running our harmonization methodology with different trust bonuses for imports, at the end of which 10% for each side seemed the most appropriate choice. This choice is admittedly based on our subjective judgment of what seemed the most fitting. We looked at the scale of the difference between the better and worse reliability scores and came up with a conservative estimate for the trust bonus that import reports deserve over export ones, given that the data still come from the same reporting agencies. As with choosing the right cutoff points for correcting outliers in the data, we must rely on subjective judgment, as there is no correct data to benchmark different trust bonuses against.
As any import data point can only ever be compared to an export data point, this greater reliability of import data is not already reflected in the reliability scores despite the calculation of separate scores for each country’s export and import data. We are, therefore, not simply correcting for an effect that is already accounted for in our reliability scores.
The revised dataset serves as the starting point for further interpretation and analysis.
A disclaimer about market-based indicators
Indicators like market shares or market-based trade balances that form the basis of many of our analyses are calculated for a specific market and, hence, based on a definition of that particular market. For such indicators, choosing the right HS-code category (or categories) and considering its (or their) homogeneity or heterogeneity is crucial.
The more heterogeneous a market definition is, the more carefully one has to evaluate whether the calculated indicators are useful or misleading. A trade balance or market share, calculated over trade by volume or value in a heterogeneous basket of products, will frequently not be representative of trade in any of the underlying products.
It should also be noted that simply trying to avoid as much heterogeneity as possible by making market definitions as narrow as possible creates its own problems. Instead of the composition problem, narrowly defined, very specific commodity categories may incur the so-called problem of small values (Bacchetta et al. Citation2012, 39). The narrower a category is, the more single cases can bias the data. Disaggregated data magnify problems and errors that arise from individual instances of type or classification errors. Similarly, any restructuring of the HS classification system, like the creation of new groups or deletion of obsolete groups, will create the most pronounced breaks in the series on the level of individual categories. Even without mistakes, there is a chance of single trade transactions completely inverting results for a specific category without this lack of robustness being obvious.
In conclusion, the right balance between the composition problem and the problem of small values needs to be found for each analysis. All market-based indicators can only ever be used with careful reference to the underlying market definition. Depending on the particular research question, very different definitions might be appropriate. For analyses that concern individual industries or product markets, only trade in products that meet very exact specifications might be relevant, while an economist studying economic development might be interested in the trade balance of all primary sector goods and other very broad categories. An example of such an employment of very broad definitions of commodity categories can be found in the country profiles of the “Raw Materials Information Systems” of the Joint Research Centre of the European Commission (JRC Citation2019). As a general guideline, it might be helpful to note that in economics, markets are usually defined in terms of the degree to which certain goods may be substitutes, which in turn very much depends on the time horizon (Stigler Citation1955).
III. Results and discussion
After running the trade data through the proposed methodology, we obtained a corrected and harmonized trade dataset. Due to licensing issues, we cannot publish the dataset. However, we can publish the reliability scores that we calculated as well as provide some exemplary results for 2017 trade in 6-digit product groups that have HS-codes beginning with 26 “Ores, Slag and Ash.” In 2017, there were 15,927 trade flows for these products in our dataset. These can be divided into the cases shown in .
Table 3. Frequencies of the different cases in the data for 2017, HS-26.
Figure 2. Histogram of reporting differences for the year 2017 within 6-digit product groups with HS-codes starting with “26.” Only cases where both countries reported positive values were included.
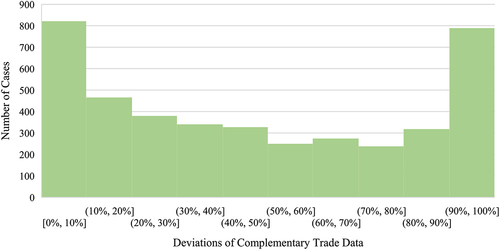
In , you can see the distribution of deviations of importer and exporter reports for the mentioned product groups and year where both values were positive. While approximately 20% of reports more or less dovetail with differences being smaller than 10%, another about 20% of reports show very large differences of over 90%. The remaining 60% of reports are almost evenly spread over the space from 10% to 90% deviation, with smaller deviations being slightly more common than larger ones.
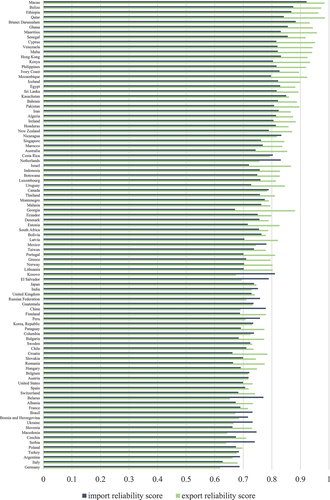
The reliability scores resulting from these and the reporting differences in all other product groups included in our dataset for the year 2017 are shown in . The underlying data can be viewed in Table A1 in the online Appendix. The lowest scores start at around a 60% average difference in reporting, and the highest reach over 90%. It is important to note that, besides the displayed distribution of differences between positive value reports, all cases in which implicit zeros and positive values are reported for the same trade flow also enter the calculation of the reliability scores. As a general pattern, it can be observed that import scores tend to be better than export scores for reporters that are overall less reliable, while the opposite is true for overall more reliable reporters.
Figure 3. Reliability scores for imports and exports by reporting country in 2017 (sorted by sum).
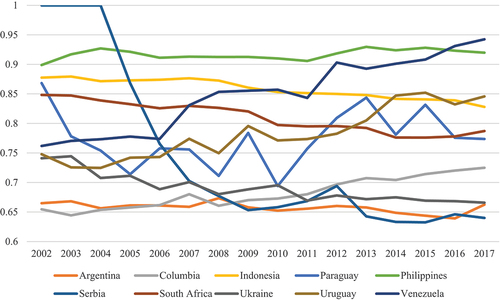
shows the reliability scores of 10 selected countries as they change over the course of 15 years. It can be observed that some reporters, like Serbia, go from being very unreliable to among the most reliable, while the reporting quality of others, like Venezuela, becomes considerably worse over the same time span. Meanwhile, the score of Paraguay is volatile throughout the entire period, without showing a clear trend, and the scores of the Philippines and Argentina are very stable, albeit at opposite ends of the spectrum.
Figure 4. Reliability scores for exports for selected countries over time.
You can see a few examples of our results that help show how the correction works in . The columns for reporter, partner, year, and HS-code were omitted due to licensing reasons. Each line corresponds to a different reporter-partner pair. The “exports” and “reverseexports” columns contain country reports with implicit zeros filled in and CIF/FOB margins and outliers corrected. “reverseexports” refers to the import figures reported by the partners, “harmonized” to the values that result from our correction methodology, and “simple_average” gives simple averages for comparison. “Rep_e_score” and “par_i_score” show the average deviations that reporters had for their export and the partners for their import reports. The value in the “harmonized” column can be calculated from the data provided in according to the formulas described in the last section.
Table 4. Examples of reports, scores, and harmonized values.
As another illustration for the effect of harmonization in actual data, before harmonization but after data cleaning, the sum of all reported exports for HS-code 260111 “Iron ore concentrates (other than roasted iron pyrites) and non-agglomerated” was US$76,397,796,162 in 2017. The sum of all reported imports was US$99,989,899,273. The sum of all harmonized values (same for imports and exports) was US$91,672,073,066.
Having shown the results that we get from our methodology, one important question remains: How can we compare the accuracy of the resulting dataset with that of the input data and datasets resulting from alternative methodologies? None of the cited articles that describe alternative correction methodologies provided an answer to this question. We tried different approaches.
First, we searched for a “correct” trade dataset for even just a small niche market, to have a benchmark to compare our results to and validate our methodology. However, there is no such thing as reliable harmonized international trade data. Even trade data that reputable market intelligence companies publish with their studies for individual metals do not constitute a useful benchmark. Despite limiting their scope to a small market that they study in depth and understand well, their trade data still rely on the same data sources and imperfect correction and harmonization methods that we seek to evaluate.
Second, we interviewed international experts in trade, tariffs, and raw materials about countries with a particularly high or low quality of trade data reporting. Their responses were intended for comparison with our calculated reliability scores. We received several responses from trade experts working for international agencies. Unfortunately, common replies reveal that the quality of data are difficult to assess. One expert argued: “We’re not in a position to judge the quality of transmitted raw data by reporters.” Another responded: “We are not able to answer your questions.” A third answered: “Nowadays, most countries have good customs data, (…) as long as the customs declarations are captured digitally (less paper).” He made a difference between value and volume (quantity): “The main problem is the information on quantity – which may not be verified by customs officers.” In general: “The discrepancy may not be related to the quality of data, but to how they were recorded – even when both countries comply 100% with international recommendations.” We understand that, in the absence of a large and systematic analysis, it might be difficult to point to particular countries as being above or below average in their trade data reporting. We also understand that such finger pointing might be inappropriate for representatives of international organizations, even if clear quality differences could be identified. In addition, we understand that deviations are not necessarily related to bad quality reporting, as there are many legitimate reasons for differences in data between reporters. However, with reference to , we disagree that differences in reporting are negligible or evenly distributed. Whether problems result from issues with partner attribution, a misclassification of goods, input errors, or any other factor, a number of factors suggest that we can make great progress toward better, harmonized trade data with methodologies such as ours. These factors include the range of our reliability scores, the efforts that others, including international organizations, have undertaken to develop similar methodologies and harmonize trade data, as well as the subjective experience of working with the data. In the end, any harmonized data set is better than none at all.
Third, we let colleagues, who are experts in different metals and the respective markets, rate trade datasets for the metals they know best. We presented them with raw trade data as reported, data where contradictory reports were reconciled by using simple averages, and data harmonized with our methodology in different columns of a spreadsheet. Our colleagues, who did not know which column was which, had to choose the column that represented the most accurate data. However, even experts in specific raw materials do not know the exact numbers traded in the market. In the absence of such verifiable data, it is difficult to judge the different datasets as better or worse, given that the differences are usually quite small.
IV. Conclusion
We have not found an objective approach for the validation of our methodology. To some extent, that is due to the nature of the problem. We have conflicting data from many sources but not a single completely reliable source of data that could help to objectively judge the reliability of all other sources. Without external validation, relying only on the dataset itself to judge its reliability, we have not found a better approach than taking the aggregate of all other sources as the benchmark for each source and using the average deviation as a reliability score.
To us, it seems the best way out of this conundrum is to get a hold of reliable data through some kind of manual process or source external to the dataset, no matter for how limited a niche of global mineral resource trade it may be, and use that as a benchmark to validate all the individual elements of the methodological discussion.
Despite not having had such a benchmark and having been unable to validate our methodology in that way, it does provide corrected and harmonized datasets that take into consideration the reliability of countries (as we measure it). We think that the methodology at hand can improve the reliability of trade datasets. It corrects flagrant errors, mirrors unique data from the reporter country to the partner country, and rectifies contradictory data in accordance with the reliability of countries in a transparent way. Aside from the above-mentioned urgently needed validation, we see additional avenues for further research.
Our first suggestion concerns the Rotterdam effect. Where a country is one of the largest suppliers of a particular resource to another country but itself imports significantly more of that resource than it exports, according to its own data; this effect is a likely cause. It is named after the phenomenon that, because partner attribution is such a difficult issue in trade statistics and sometimes import data are attributed by country of consignment rather than country of origin, large distribution hubs like the harbor of Rotterdam are often reported as the apparent source of many traded goods.
One possible addition to our methodology to address these issues and, thereby, specifically address partner attribution as another cause for deviations would be to identify these cases and substitute the net importer’s (e.g., the Netherland’s) largest suppliers (instead of the Netherlands) as sources for the importing country. The amount originally attributed to the Netherlands could be divided amongst these sources in accordance with the relative amounts that the Netherlands receives from each source. The same could also be done regarding exports to net exporters, identifying them as trading hubs and substituting their biggest “customers” (destination countries) as “customers” of the original exporter.
That the countries from which the net importer receives the goods are representative of those from which the destination country receives the goods through the net importer is no more than an assumption. However, similar attributions have been made in the past (Feenstra et al. Citation2005), and because this correction can be calculated automatically for large datasets for which there is currently no better alternative way to deal with these kinds of errors, it still has the potential to significantly improve the quality of trade data for subsequent analyses. If employed, this correction should precede the calculation of reliability scores, such that only deviations that are not due to clearly identifiable issues with partner attribution are taken into account for calculating the scores and weighted averages.
An alternative approach is what Fortanier and Sarrazin (Citation2016) began to add as individual modules to their coordinated approach. Module 1 contains adjustments to Hong-Kong Re-Exports, and similar to it, more modules could be added for the limited number of known distribution hubs that create larger issues in the data.
Our second suggestion for further research concerns the correction of outliers. Outliers are instances where the trade volume changes by orders of magnitude for one year only. The correction of such outliers could be made conditional on the trade partner of the reporting country not reporting a similarly high deviation for the preceding and succeeding years. With this increased reliability, the correction could then possibly be extended to lower order of magnitude outliers.
Our next suggestion for further research concerns not fully attributed, “confidential” trade. It may be feasible to ascertain which subcategory or partner country not fully attributed trade most likely belongs to by looking at deviations from the reports of trade partners. Future analyses could implement this as another step preceding the calculation of the reliability score, further improving the accuracy of the final result.
Our last suggestion is for researchers working with gravity models of trade. The importance of using harmonized data when working with such models can be examined by comparing the coefficients, standard errors, and p-values of common covariates like GDP and distance to those obtained with alternative datasets. While there are no datasets without any harmonization, because the raw data contain two contradictory reports for every trade flow, different approaches to harmonization, from simply trusting the importer to different reliability score-based approaches, can be compared in this way. Larger differences indicate a higher importance of choosing the right dataset. Which methodology produces the better dataset, however, remains a difficult question to answer.
Acknowledgment
We are grateful to the Federal institute for Geosciences and Natural Resources, in particular, its German Mineral Resources Agency, for making this research possible. Discussions with our friends Elmar Rietveld of TNO (The Netherlands), Dominic Wittmer (Joint Research Centre (JRC) of the European Commission), and Viorel Nita (also JRC) have helped us tremendously in developing our ideas. We would like to thank our discussion partners at the WTO, WCO, Trade Data Monitor, Global Trade Tracker, UN Comtrade, and Roskill. Furthermore, our colleagues at DERA, most notably Siyamend Al Barazi, Dr. Peter Buchholz, Ulrike Dorner, Alexander Fritz, Maren Liedtke, Michael Schmidt, and Dr. Martin Schmitz provided plenty of helpful feedback.
Disclosure statement
No potential conflict of interest was reported by the authors.
Correction Statement
This article has been corrected with minor changes. These changes do not impact the academic content of the article.
References
- Bacchetta, M., C. Beverelli, O. Cadot, M. Fugazza, J.-M. Grether, M. Helble, A. Nicita, and R. Piermartini. 2012. A Practical Guide to Trade Policy Analysis, Geneva, Switzerland: World Trade Organization (WTO) Publications. https://www.wto.org/english/res_e/publications_e/wto_unctad12_e.pdf.
- Cook, R. D. 1977. “Detection of Influential Observation in Linear Regression.” Technometrics 19 (1): 15–18. https://doi.org/10.2307/1268249.
- Dietzenbacher, E., B. Los, R. Stehrer, M. Timmer, and G. de Vries. 2013. “The Construction of World Input-Output Tables in the WIOD Project.” Economic Systems Research 25 (1): 71–98. https://doi.org/10.1080/09535314.2012.761180.
- Europa Zollportal. 2019. Zolltarifnummern [Customs Tariff Numbers]. Accessed December 10, 2019. http://www.tariffnumber.com.
- Feenstra, R. C., R. E. Lipsey, H. Deng, A. C. Ma, and H. Mo. 2005. “World Trade Flows: 1962–2000.” NBER Working Paper 11040. Cambridge, MA: National Bureau of Economic Research. https://doi.org/10.3386/w11040.
- Fortanier, F., A. Liberatore, A. Maurer, G. Pilgrim, and L. Thomson. 2017. The OECD-WTO Balanced Trade in Services Database. Organization for Economic Cooperation and Development and the World Trade Organization, Paris, France. http://t4.oecd.org/sdd/its/OECD-WTO-Balanced-Trade-in-Services-database-methodology.pdf.
- Fortanier, F., and K. Sarrazin. 2016. “Balance International Merchandise Trade Data: Version 1.” OECD Working Party on International Trade in Goods and Trade in Services Statistics, March 21–24. Paris. https://www.oecd.org/officialdocuments/publicdisplaydocumentpdf/?cote=STD/CSSP/WPTGS%282016)18&docLanguage=En.
- Gaulier, G., and S. Zignago. 2010. “BACI: International Trade Database at the Product-Level. The 1994-2007 Version.” CEPII Document De Travail WP No. 2010-23, Centre D’Etudes Prospectives Et D’Informations Internationales, Paris, France. http://www2.cepii.fr/PDF_PUB/wp/2010/wp2010-23.pdf.
- Gehlhar, M. J. 1996. “Reconciling Bilateral Trade Data for Use in GTAP.” GTAP Technical Paper No. 10, Global Trade Analysis Project, Center for Global Trade Analysis, Lafayette, IN: Purdue University. http://docs.lib.purdue.edu/gtaptp/11.
- Hamanaka, S. 2013. “Revealing Informal Trade by the Mirror Trade Statistics Comparison: The Case of Lao PDR and Cambodia.” Paper presented at the World Customs Organization and World Bank Research Conference, Brussels, Belgium. June 3–4.
- JRC. 2019. “Raw Materials Information System; Country Profiles; Trade; Exports, Imports and Trade Balance by Selected HS Chapter in 2017(million USD)”. Joint Research Centre, European Commission, Ispra, Italy. https://rmis.jrc.ec.europa.eu/?page=country-profiles#/.
- Miao, G., and F. Fortanier. 2017. “Estimating Transport and Insurance Costs of International Trade.” OECD Statistics Working Paper No. 2017/04. Paris: OECD Publishing. https://doi.org/10.1787/8267bb0f-en.
- United Nations. 1981. “Strategies for Price and Quantity Measurement in External Trade: A technical report.” Statistical Papers Series M No. 69, New York: Statistical Office, Department of International Economic and Social Affairs, United Nations. https://digitallibrary.un.org/record/28683?v=pdf.
- Statistisches Bundesamt. 2018. “Warenverzeichnis für Außenhandelsstatistik Ausgabe 2019 [Commodity Register for International Trade Statistics Edition 2019].” Statistisches Bundesamt, Wiesbaden, Germany. http://www.destatis.de/warenverzeichnis.
- Stigler, G. J. 1955. “Introduction.” In Business Concentration and Price Policy, edited by Universities–National Bureau Committee for Economic Research, 3–14. Princeton, NJ: Princeton University Press. http://www.nber.org/chapters/c0950.
- Tercero Espinoza, L. A., and M. Soulier. 2016. “An Examination of Copper Contained in International Trade Flows.” Mineral Economics 29 (2–3): 47–56. https://doi.org/10.1007/s13563-016-0087-2.
- Timmer, M. P., E. Dietzenbacher, B. Los, R. Stehrer, and G. J. de Vries. 2015. “An Illustrated User Guide to the World Input-Output Database: The Case of Global Automotive Production.” Review of International Economics 23 (3): 575–605. https://doi.org/10.1111/roie.12178.
- UN Trade Statistics. 2019. UN Comtrade Knowledgebase: Bilateral Asymmetries, New York: United Nations. https://unstats.un.org/wiki/x/B4WEBQ. Statistics Division.
- WCO. 2017. HS Nomenclature 2017 Edition. Brussels, Belgium: World Customs Organization. http://www.wcoomd.org/en/topics/nomenclature/instrument-and-tools/hs-nomenclature-2017-edition/hs-nomenclature-2017-edition.aspx.