
Abstract
The aim of this study is to investigate whether NGAL, given its advantages over traditional biomarkers, can be used to describe the dynamic characteristics of the renal tubulointerstitial insult caused by adenine. Subsequently, it will be possible to assess NGAL as a biomarker of any acute kidney injury, on top of chronic interstitial disease, if NGAL levels are stable through the chronic phase of our adenine model. Study group rats were fed an adenine diet, and control group rats were fed a regular diet only. Blood and urine samples for urea, creatinine and NGAL were drawn from each rat at the beginning of the study and after 1, 3, 4, 5, 6, 7 and 8 weeks. Kidney slices from these rats were stained with Hematoxylin-eosin (HE) and β-actin stainings. Serum urea, creatinine and NGAL levels and urinary NGAL/creatinine ratio in the study group were higher than baseline and than in the control group; these differences were statistically significant in some of the intervals. Tubulointerstitial changes and adenine crystals were evident in the study group rats. In the rats fed adenine, serum urea, creatinine and NGAL levels and urinary NGAL/creatinine ratio followed a triphasic pattern of kidney injury: an acute phase while on the adenine diet, a partial recovery phase after switching to the regular diet and a chronic kidney disease phase after stabilization of renal function. NGAL can serve a biomarker for acute kidney injury and possibly for chronic kidney disease in the tubulointerstitial rat model.
Introduction
Animal models of renal disease are important tools for studying pathophysiological processes in kidney diseases. Established techniques of acute and/or chronic kidney injury or disease include unilateral nephrectomy with partial excision of the other kidney, ischemia/reperfusion injury induced by clamping of one or both renal arteries, toxic injury models (such as exposure to cisplatinum), sepsis induced by cecal ligation and puncture, and glomerular models induced by injection of antigens or preformed antibodies.Citation1,Citation2
Adenine is a nephrotoxic agent which induces tubulointerstitial injury.Citation3 Irreversible tubular damage due to adenine crystallization, interstitial inflammation and fibrosis appear in the kidneys of rats that have been fed an adenine-enriched diet for 4 weeks. Thus, adenine is a simple and useful tool that can be applied to generate animal models of renal failure. A major advantage of this model is its high reproducibility comparing to the previously mentioned models. Rats fed an adenine-enriched diet develop chronic kidney disease with renal failure even after adenine excess is stopped. Indeed, chronic interstitial inflammation and damage remain following an early phase of acute kidney injury, which partially improves after the adenine administration ceases.Citation4
The objective of our study was to investigate whether neutrophil gelatinase-associated lipocalin (NGAL) can be used to describe the dynamic characteristics of the tubulointerstitial insult caused by adenine. One of the advantages of this novel biomarker of kidney injury over the traditional biomarkers is the fact that body weight does not influence the levels of NGAL. Another advantage is the earlier rise of NGAL levels. However, due to the gradual evolution of injury in rats caused by the ingestion of adenine, NGAL levels increase later in this model. Thus, NGAL levels are examined in our study in one-week intervals starting at the beginning of adenine exposure. If NGAL levels are stable through the chronic phase of the adenine model, it will be possible to assess the future use of NGAL as a biomarker for different forms of acute kidney injury on top of chronic kidney disease.
Methods
Animal model of kidney disease induced by adenine
Male Sprague-Dawley rats were divided into two groups: the study group (group A, 12 rats) and the control group (group B, 11 rats; one rat died after several days). Rats of group A were fed ad libitum with an adenine-enriched diet (0.75%, TD 08441, Teklad) for 4 weeks and then switched to a regular diet for an additional period of 4 weeks. Rats of group B were fed regular chow for 8 weeks. Approval by the Animal Welfare Committee was obtained.
Urea, creatinine and NGAL levels
To assess urea, creatinine and NGAL levels, blood samples were drawn from the tail of each rat at the beginning of the study, and after 1, 3, 4, 5, 6, 7 and 8 weeks. The same parameters were also assessed in urine samples, which were collected at the same time intervals after the blood samples were drawn and the rats urinated spontaneously. Serum and urine NGAL levels were measured using a NGAL ELISA kit (BioPorto, Denmark). Because urinary NGAL levels may be affected by urine volume, we normalized urinary NGAL to urinary creatinine.
Histology
After 4 weeks from the beginning of the study, a sample of three rats from each group was perfusion-fixed and sacrificed. The same procedure was carried out 4 weeks later in three rats from group A and two from group B. Hematoxylin-eosin (HE)- stained kidney slices from these rats were assessed blindly and scored on a 0–4 scale. Fibrosis in the slices was determined by β-actin staining, and the image analysis was performed on 6–9 frames for each selected renal region per animal, using ImageJ software.
Statistical analysis
The data are presented as the means ± SEM. Serum urea, creatinine and NGAL levels and the urinary NGAL/creatinine ratio were compared to baseline at each interval using Kruskal-Wallis and Dunn's tests and between the groups using t-tests. Comparisons of the fibrosis scores in group A after 4 and 8 weeks and in group B were carried out by one-way ANOVA using Newman–Keuls post-hoc test for between-group comparisons. A p value of <0.05 was considered statistically significant.
Results
During the 4 weeks on the adenine-enriched diet, group A rats lost weight from 249 ± 21 g to 207 ± 17 g. This weight was significantly lower (p< 0.001) than the average weight of group B rats after 4 weeks on the regular diet (328 ± 38 g), which increased from 251 ± 23 g. Afterwards the weight of rats of both groups, fed by regular diet, increased to 328 ± 39 g in group A and to 361 ± 48 g in group B.
The serum levels of urea and creatinine in group A were significantly higher than those in group B at each interval except for the baseline values, which were similar (p< 0.05). In group A, the blood urea level gradually increased from a baseline level of 42 ± 2 mg/dL to a maximal value of 221 ± 25 mg/dL after 4 weeks on an adenine-enriched diet. After switching from the adenine-enriched diet to a regular diet, the urea level gradually decreased to a plateau of 152 ± 28 mg/dL after 8 weeks. The serum creatinine values followed the same pattern: 0.33 ± 0.02 mg/dL at the start of the experiment, 1.63 ± 0.22 mg/dL after 4 weeks on the adenine-enriched diet and 1.12 ± 0.18 mg/dL after 8 weeks. With the exception of the urea level after 7 weeks, the differences between the levels of these parameters after 3 to 8 weeks and the baseline values in group A were significant (p< 0.05) ().
Figure 1. (A) Serum creatinine levels of rats in groups A (adenine diet) and B (regular diet) after 0–8 weeks. (B) Serum urea levels of rats in groups A (adenine diet) and B (regular diet) after 0–8 weeks. (C) Serum NGAL levels of rats in groups A (adenine diet) and B (regular diet) after 0–8 weeks. (D) Urinary NGAL/creatinine ratios of rats in groups A (adenine diet) and B (regular diet) after 0–8 weeks. #significant – A versus B, *significant – A at each week versus baseline.
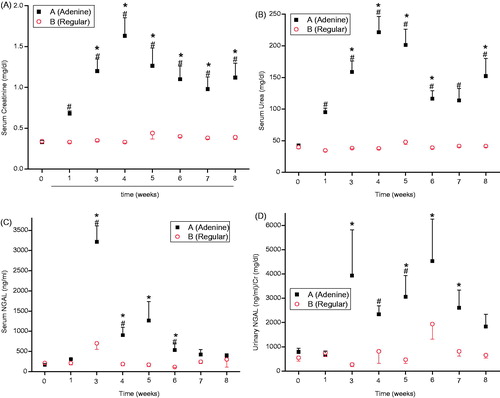
The serum NGAL levels were higher in group A than in group B at all intervals except at baseline (). This difference was significant after 3 and 4 weeks on the adenine-enriched diet and 2 weeks after switching to the regular diet. Serum NGAL increased gradually while the rats were fed the adenine-enriched diet to a maximal value after 3 weeks; afterwards, the serum NGAL levels gradually decreased until the end of the study. Notably, the serum NGAL levels were significantly higher than the baseline values (172 ± 30 ng/mL) after 3 and 4 weeks on the adenine-enriched diet and 1–2 weeks after switching to the regular diet (3210 ± 362, 903 ± 194, 1270 ± 450, 538 ± 144 ng/mL, respectively) (p ≤ 0.0005). The urinary NGAL/creatinine ratios were higher in group A than in group B except at baseline and after the first week, reaching significant differences after 4 weeks on the adenine-enriched diet and 1 week after switching to the regular diet (). Except after the first week, the urinary NGAL/creatinine ratios were increased in group A compared to baseline (792 ± 144 ng/mL/mg/dL) during the full duration of the study. These differences were significant 3 weeks after the beginning of the experiment and 1–3 weeks after switching to the regular diet, reaching a maximal value after 2 weeks on the regular diet (4532 ± 1732 ng/mL/mg/dL) (p< 0.05).
Kidney slices of group A rats after 4 weeks on the adenine-enriched diet, stained with HE and β-actin for fibrosis, showed interstitial inflammatory changes, tubular atrophy, interstitial fibrosis and adenine crystals in the cortex, medulla and papilla (). Fibrosis and tubular changes were more prominent in the group A rats that were sacrificed after 8 weeks, though inflammation was relatively scarce in the different regions of the kidneys (). These changes were not found in the kidneys of group B rats, which had normal histology after 4 and 8 weeks (, ).
Figure 2. (A) Interstitial inflammatory changes consisting mainly of fibrosis, adenine crystals and tubular atrophy in the kidney cortex of a rat from group A sacrificed after 4 weeks on the adenine diet and stained with hematoxylin-eosin. (B) More prominent interstitial fibrosis, adenine crystals and tubular changes with scant inflammation in the kidney cortex of a rat from group A sacrificed after 8 weeks and stained with hematoxylin-eosin. (C) Normal kidney cortex of a rat from group B after 8 weeks on a regular diet stained with hematoxylin-eosin.
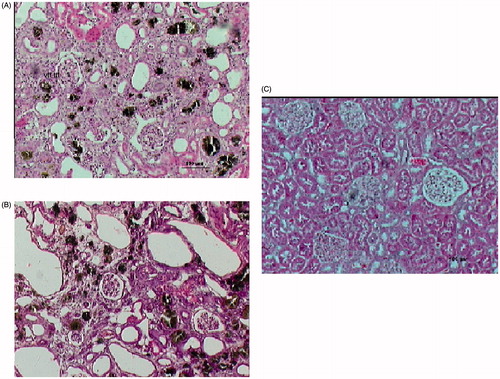
Figure 3. (A) Interstitial fibrosis in the kidney cortex of a rat from group A sacrificed after 4 weeks on an adenine diet and stained for β-actin. (B) More prominent interstitial fibrosis in the kidney cortex of a rat from group A sacrificed after 8 weeks and stained for β-actin. (C) Normal kidney cortex of a rat from group B after 4 weeks on a regular diet and stained for β-actin. (D) Image analysis of β-actin immunostaining density. The data from rats in group A (adenine diet) after 4 and 8 weeks are relative to the data from rats in group B (regular diet) after 4 weeks. Abbreviations: IBZ: interbundle Zone; VR: Vasa Recta.
Note: *p < 0.001 A versus B, **p < 0.01 A versus B.
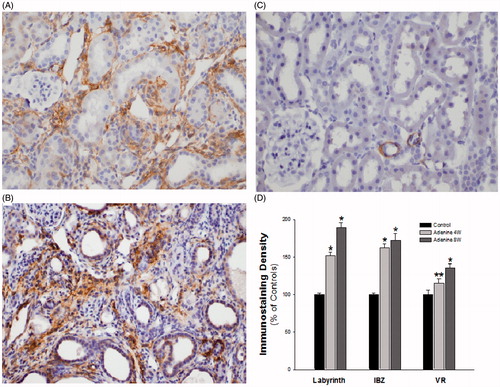
Table 1. Assessment of HE kidney slices of group a (adenine diet) and B (regular diet) rats by 0–4 scoring (average ± SEM).
In group A rats, the optical density of β-actin significantly increased relative to the group B rats in the different kidney regions by 15.2–62.7% at 4 weeks and by 36.0–89.2% at 8 weeks. With the exception of the outer medullary interbundle region, the increment between the two time points also reached statistical significance ().
Discussion
Creatinine and urea levels in the serum of the rats fed adenine followed a triphasic pattern of kidney injury: (a) acute phase while on an adenine-enriched diet; (b) partial recovery phase after switching to a regular diet; and (c) chronic kidney disease phase after stabilization of renal function. This has been roughly described in a previous study.Citation4 The patterns of serum NGAL levels and urinary NGAL/creatinine ratios were similar; however, unlike creatinine and urea, the serum NGAL levels and urinary NGAL/creatinine ratios were significantly different compared to baseline or to the rats fed the regular diet only in some of the intervals.
While the weight of group B rats (on a regular diet) increased gradually as expected, the weight of group A rats (on the adenine-enriched diet) decreased as a result of either the rats’ dietary preferences or their evolving uremia. After switching from the adenine-enriched diet to the regular diet, the recovering rats gained weight, though they did not succeed in completely catching up with the weight gain of rats in group B. The weight gain of rats in group A, though they were uremic, after switching to a regular diet, does not support uremia as the cause of weight loss while they were on the adenine-enriched diet. Though the increase of serum creatinine, a muscle product, reflects the decline in the glomerular filtration rate, this decline was underestimated given the weight loss and the muscle mass wasting of group A rats. In contrast, the serum creatinine levels of group B rats were stable despite their weight gain and their greater muscle mass.
In correlation with the pattern of serum markers, inflammatory changes were demonstrated by the HE staining of the kidneys during the acute phase, while the tubular atrophy and interstitial fibrosis observed by HE staining, consistent with previous findingsCitation3 and confirmed by β-actin staining, increased during the transition from the acute phase to the chronic phase.
In recent years, new biomarkers for kidney injury have been sought in light of the limitations of the traditional biomarker of serum creatinine, which rises above the normal range several days after the insult and is influenced by different factors, including age, gender, medications, muscle mass and diet. Some suggested markers include NGAL, KIM-1 (kidney injury marker-1), L-FABP (liver-type fatty acid-binding protein), and others. There is already substantial evidence for the advantages of these markers, the levels of which increase hours after kidney insult. As in our study, NGAL has been reported as a marker of acute kidney injury in other animal models.Citation5 Urinary NGAL levels have been shown to increase 3 h after toxic injury induced by cisplatin in miceCitation6 and in the first urinary output after acute ischemia in both rats and mice.Citation7
The advantages of NGAL are also evident in humans. Serum and urinary levels of NGAL have been shown to increase in adults and children with acute kidney injury in critical care units,Citation8 after ischemia due to nephron sparing surgery,Citation9 cardiac surgery,Citation10,Citation11 coronary angiographyCitation12 and kidney transplantation,Citation13 and in hemolytic uremic syndrome.Citation14
NGAL was previously investigated in an adenine model in just one experiment, though the results showed high levels of NGAL in the urine of mice on an adenine-enriched diet starting five days after the beginning of this diet until the deaths of the animals.Citation15 However, in that study, serum NGAL levels were not examined, and the recovery and chronic phases were not included because all samples were taken while the animals were on the adenine-enriched diet without switching to the regular diet. Our study demonstrates that NGAL can serve a biomarker for acute kidney injury and possibly for chronic kidney disease in a toxic tubulointerstitial rat model.
In our study, it is unclear whether the NGAL levels began to rise hours after the beginning of the adenine-enriched diet, which has been described after different insults in previous studies. This may be because the NGAL samples were not taken after a very short interval in our study. In contrast with most of the above mentioned studies, which showed the advantages of NGAL as an early marker of acute kidney injury, in our study, NGAL increased significantly only after 3 weeks during the acute phase. This may have been due to the adenine-based insult; rather than having immediate effects, the adenine exposure was progressive and dependent upon the amount of adenine ingested by the rats.
NGAL levels were significantly high in the late phases after the adenine-induced acute injury. Similarly, NGAL has also been reported to increase in the blood or urine of patients with chronic kidney disease,Citation16 with glomerulopathiesCitation17,Citation18 and polycystic disease.Citation19
Our study supports the scant evidence regarding NGAL and interstitial renal disease. Previously, high NGAL levels were found in the urine of patients with biopsy-proven tubulointerstitial damage; these elevated NGAL levels correlated mainly with tubular atrophy.Citation20,Citation21
By performing closely repeated serum creatinine and urea measurements, we showed a triphasic pattern of kidney damage in the rat model induced by an adenine-enriched diet. Qualitative and quantitative histological assessments demonstrated the acute and chronic damage to the rats’ kidneys. NGAL, a newly identified biomarker for acute and chronic kidney injury, was previously examined, at least partially, in an adenine model and in human tubulointerstitial renal disease. In our study, NGAL seems to be a reliable renal marker, although not significantly in all time intervals. Moreover, NGAL is a superior biomarker compared to creatinine levels because NGAL levels are independent of body mass. As demonstrated in this study, the simplicity, reproducibility and avoidance of traumatic insult in the model of advanced kidney disease induced by an adenine-enriched diet have prominent advantages over the traditional surgical/traumatic models of kidney damage.
Further studies should assess the role of NGAL in the handling of patients with tubulointerstitial disease. NGAL may be used as a marker in adenine-enriched diet animal model and in human renal disease, particularly in cases with tubule-interstitial damage. NGAL may also be a tool for assessing acute injury on top of chronic kidney disease. Finally, NGAL may be used to determine the efficacy of different interventions designed to prevent or treat kidney injury or to slow chronic disease progression.
Disclosure statement
The authors report no conflicts of interest.
References
- Tögel F, Westenfelder C. Recent advances in the understanding of acute kidney injury. F1000Prime Rep. 2014;6:83–88.
- Becker GJ, Hewitson TD. Animal models of chronic kidney disease: Useful but not perfect. Nephrol Dial Transplant. 2013;28:2432–2438.
- Yokozawa T, Zheng PD, Oura H, Koizumi F. Animal model of adenine-induced chronic renal failure in rats. Nephron. 1986;44:230–234.
- Okada H, Kaneko Y, Yawata T, et al. Reversibility of adenine-induced renal failure in rats. Clin Exp Nephrol. 1999;3:82–88.
- Abassi Z, Sagi O, Armaly Z, Bishara B. Neutrophil gelatinase-associated lipocalin (NAGL): A novel biomarker for acute kidney injury. Harefuah. 2011;150:111–116.
- Mishra J, Mori K, Ma Q, Kelly C, Barasch J, Devarajan P. Neutrophil gelatinase-associated lipocalin: A novel early urinary biomarker for cisplatin nephrotoxicity. Am J Nephrol. 2004;24:307–315.
- Mishra J, Ma Q, Prada A, et al. Identification of neutrophil gelatinase-associated lipocalin as a novel early urinary biomarker for ischemic renal injury. J Am Soc Nephrol. 2003;14:2534–2543.
- Siew ED, Ware LB, Gebretsadik T, et al. Urine neutrophil gelatinase-associated lipocalin moderately predicts acute kidney injury in critically ill adults. J Am Soc Nephrol. 2009;20:1823–1832.
- Abassi Z, Shalabi A, Sohotnik R, et al. Urinary NGAL and KIM-1: Biomarkers for assessment of acute ischemic kidney injury following nephron sparing surgery. J Urol. 2013;189:1559–1566.
- Krawczeski CD, Woo JG, Wang Y, Bennett MR, Ma Q, Devarajan P. Neutrophil gelatinase-associated lipocalin concentrations predict development of acute kidney injury in neonates and children after cardiopulmonary bypass. J Pediatr. 2011;158:1009–1015.
- Wagener G, Minhaz M, Mattis FA, Kim M, Emond JC, Lee HT. Neutrophil gelatinase-associated lipocalin and acute kidney injury after cardiac surgery: The effect of baseline renal function on diagnostic performance. Nephrol Dial Transplant. 2011;26:1717–1723.
- Bachorzewska-Gajewska H, Malyszko J, Sitniewska E, et al. NGAL (neutrophil gelatinase-associated lipocalin) and cystatin C: Are they good predictors of contrast nephropathy after percutaneous coronary interventions in patients with stable angina and normal serum creatinine? Int J Cardiol. 2008;127:290–291.
- Mishra J, Ma Q, Kelly C, et al. Kidney NGAL is a novel early marker of acute injury following transplantation. Pediatr Nephrol. 2006;21:856–863.
- Trachtman H, Christen E, Cnaan A, et al. Urinary neutrophil gelatinase-associated lipocalcin in D + HUS: A novel marker of renal injury. Pediatr Nephrol. 2006;21:989–994.
- Morishita Y, Ohnishi A, Watanabe M, Ishibashi K, Kusano E. Establishment of acute kidney injury mouse model by 0.75% adenine ingestion. Renal Failure. 2011;33:1013–1018.
- Mitsnefes MM, Kathman TS, Mishra J, et al. Serum neutrophil gelatinase-associated lipocalin as a marker of renal function in children with chronic kidney disease. Pediatr Nephrol. 2007;22:101–108.
- Bolignano D, Coppolino G, Lacquaniti A, Nicocia G, Buemi M. Pathological and prognostic value of urinary neutrophil gelatinase-associated lipocalin in macroproteinuric patients with worsening renal function. Kidney Blood Press Res. 2008;31:274–279.
- Hinze CH, Suzuki M, Klein-Gitelman M, et al. Neutrophil gelatinase-associated lipocalin is a predictor of the course of global and renal childhood-onset systemic lupus erythematosus disease activity. Arthritis Rheum. 2009;60:2772–2781.
- Bolignano D, Coppolino G, Campo S, et al. Neutrophil gelatinase-associated lipocalin in patients with autosomal-dominant polycystic kidney disease. Am J Nephrol. 2007;27:373–378.
- Nickolas TL, Forster CS, Sise ME, et al. NGAL (Lcn2) monomer is associated with tubulointerstitial damage in chronic kidney disease. Kidney Int. 2012;82: 718–722.
- Wu Y, Yang L, Su T, Wang C, Liu G, Li XM. Pathological significance of a panel of urinary biomarkers in patients with drug-induced tubulointerstitial nephritis. Clin J Am Soc Nephrol. 2010;5:1954–1959.