
Abstract
Backgrounds: Defect in kidney is one major reason of hypertension. The study aimed ao uncovering the regulatory mechanisms of miRNAs and the targets in hypertensive kidney.
Methods: Gene expression profile of GSE28345 and miRNA expression profile of GSE28283 were downloaded from GEO database. After data preprocessing, differently expressed genes (DEGs) and miRNAs (DE-miRs) were identified using limma package. Then targets of miRNAs were predicted according to information in relevant databases. Function and pathway enrichment analyses were performed for DEGs using DAVID software. Furthermore, protein–protein interaction (PPI) networks were constructed for up- and down-regulated genes, respectively, using the Cytoscape. Additionally, for down-regulated DEGs, the integrated regulatory network was established combining PPI network with the miRNA–mRNA interactions.
Results: As a result, 285 DEGs were identified, including 177 up-regulated and 108 down-regulated genes. Combined with the predicted targets of miRNAs, 22 up-regulated DE-miRs were identified. In the integrated network for down-regulated DEGs, three crucial nodes were identified as ASPN, COL12A1, and SCN2A. ASPN was predicted as target of miR-21 and miR-374b, and COL12A1 was the target of miR-30e, miR-21, and miR-195, while SCN2A was the target of miR-30e, miR-374b, and miR-195. Notably, COL12A1 and ASPN were linked with each other in the network.
Conclusion: Three crucial genes were identified in hypertensive kidney, such as COL12A1, ASPN, and SCN2A. ASPN might co-function with COL12A1, and they both might be the targets of miR-21. SCN2A might be a novel target of miR-30e and miR-374b. However, more experiments are needed to validate these results.
Introduction
Hypertension is the major risk factor that leads to cardiovascular disease with high mortality and morbidity.Citation1 It is often accompanied with numerous complications such as stroke, heart failure, and kidney diseases.Citation2 In the United States, although the management and control of hypertension have been dramatically improved from 1999 to 2010, the prevalence remains as stable as 30% among these years.Citation3
The endothelial dysfunction characterized by decreased synthesis of nitric oxide (NO) is a hallmark of hypertension. As the main extracellular cation, sodium retention in the extracellular could decrease the synthesis of NO. On the contrary, high plasma potassium, the main intracellular cation, has a beneficial effect on endothelial cells’ softness and could activate NO release.Citation4 Therefore, it is recommended in the prevention of hypertension to keep the low-level of plasma sodium and high-level of potassium.Citation4 It is theorized that hypertension is caused by a primary defect in the kidney.Citation5 Kidney has a potent effect on the control of sodium excretion via the renin–angiotensin system (RAS), which was supposed to be the critical mechanism for blood pressure regulation.Citation6 Therefore, it is urgent to investigate alterations in hypertensive kidneys.
Currently, various approaches including gene candidate analysis and genome wide search have been introduced into the identification of genetic components of hypertension,Citation7 and several candidate genes were identified, such as SPON1, GDF-15, and STK39.Citation8–10 However, gene alterations related to hypertensive kidney are rarely reported.
MicroRNAs (miRNAs) are small non-coding RNAs that could bind to complementary sequences of its targets and thereby result in the mRNAs’ degradation and the translation inhibition.Citation11 They are key regulators for gene expressions. Reportedly, hcmv-miR-UL112 is associated with the increased risk of hypertension.Citation12 Increased circulating miRNA-34a is detected in hypertensive patients with different liver diseases.Citation13 Despite these profound findings, the molecular mechanisms of hypertension, especially kidney-related hypertension, remain obscure.
A recent study using microarray technology identifies differentially expressed genes (DEGs) and miRNA (DE-miRs) between kidneys of hypertensive patients and normotensive controls. As a result, the study finds 46 DEGs and 13 DE-miRs in the renal cortex between the two kinds of samples, and gene expressions, such as APOE, SLC13A1, and CD36; and miRNA expressions, such as hsa-miR-21, hsa-miR-181a, and hsa-miR-663 are validated.Citation14 Nevertheless, the criteria for DEGs selection are not rigorous because the detailed fold change is not provided. In addition, interactions among the DEGs from protein level are not considered. Therefore, we re-analyzed their data by combining the gene expression profile GSE28345 with the miRNA expression profile GSE28283, to take full advantage of this microarray data and thereby uncover the potential gene interactions at protein level and the miRNA–mRNA regulations, thus to provide novel insights into the pathology of hypertension and potential biomarkers for the prognosis.
Methods
Microarray data
The gene expression profile GSE28345 and the miRNA expression profile GSE28283Citation14 were all obtained from the Gene Expression Omnibus (GEO, http://www.ncbi.nlm.nih.gov/geo, Bethesda, MD) database. Samples of the two profiles were the same, and they were from the renal cortex tissues. There were a total of eight samples: five were from hypertensive male patients (hypertensive samples) and three from normotensive male patients (control samples). The profile of GSE28345 was based on the platform of GPL6244 [HuGene-1_0-st] Affymetrix Human Gene 1.0 ST Array, and GSE28283 based on the GPL10850 Agilent-021827 Human miRNA Microarray (V3) (miRBase release 12.0 miRNA ID version) (Agilent Technologies, Palo Alto, CA).
Preprocessing of the two profiles and selection of DEG or DE-miRs
Raw data of the gene expression profile was normalized by Robust Multichip Average (RAM) algorithm,Citation15 and the samples were divided into hypertensive group and control group. Then, Linear Models for Microarray Analysis (limma, http://www.bioconductor.org/packages/release/bioc/html/limma.html) of Bioconductor RCitation16 was recruited to identify the differently expressed genes (DEGs). The thresholds were |log 2 fold change (FC)| >0.58 and p values <.05.
For miRNA profile, the raw data was interpreted by limma package to obtain signal intensity, and then were undergone the normexp background correctionCitation17 and quartile normalization.Citation18 Thereafter, t-test in limma package was utilized to identify DE-miRs between two groups. The cutoff values were |log 2 FC| ≥ 1 and p values <.05.
The prediction of target genes of miRNA
Databases including miRanda (http://mirdb.org/miRDB), PicTar (http://pictar.mdc-berlin.de), PITA,Citation19 TargetScan (www.targetscan.org) and MirTarget2Citation20 were searched to identify target genes of miRNAs. The interplayed miRNA–mRNAs that were recorded in at least three of the above databases were selected. Considering that miRNAs always regulate mRNA’s degradation and translation inhibition by binding to 3’ UTR of the mRNA, we extracted the interaction information between the corresponding transcripts (RefseqID) and miRNAs to reveal the interactions of miRNA–target.
The correlation analysis between differently expressed mRNAs and miRNAs
In the identified transcript–miRNAs, the interactions with reverse expressions were screened out. Subsequently, the transcript RefseqID was converted into gene symbols.
Functional enrichment analyses of DEGs
The Gene ontology (GO, http://www.geneontology.org/) and Kyoto Encyclopedia of Genes and Genomes (KEGG, http://www.genome.jp/kegg/pathway.html) pathway enrichment analyses were performed utilizing the Database for Annotation, Visualization and Integrated Discovery (DAVID, http://david.abcc.Ncifcrf.gov/) online software,Citation21 to recognize potential biological processes and pathways that DEGs were involved in. The cutoff values for the significant function and pathways were p values <.05 and the count (gene number that enriched in a specific function or pathway term) ≥ 2.
Construction of protein–protein interaction (PPI) network
By mapping the DEGs into Search Tool for the Retrieval of Interacting Genes (String, http://string-db.org/) database,Citation22 the interaction relationships among DEGs at protein level were screened. Then, the protein–protein interaction (PPI) networks for up- and down-regulated DEGs were constructed under the criterion of combine score >0.4, respectively. The Cytoscape software was used to visualize the networks.Citation23 We focused the down-regulated DEGs that might be down-regulated by the miRNAs, and the integrated regulatory network was constructed combining the PPI network of down-regulated genes with the miRNA–target interaction. The connectivity degrees were calculated through network statistical methods.
Results
Selection of DEGs and DE-miRs
According to the screening criteria, a total of 731 differently expressed transcripts were identified in the renal cortex tissues of hypertensive patients. Among them, 459 were up-regulated, corresponding to 177 DEGs; while 272 were down-regulated, corresponding to 108 DEGs.
Through the comparison of 859 known miRNAs between two groups, 22 up-regulated miRNAs in hypertensive group were identified. No down-regulated miRNAs were detected.
The predicted target genes of miRNAs
Based on the interactions between miRNAs and the target transcripts, and the differently expressed mRNAs, the reversely expressed miRNA–transcript interactions were recognized. For all the identified miRNAs were up-regulated, only the down-regulated mRNAs were chosen to predict the miRNA–mRNA interaction. As a result, 23 transcripts were selected and converted into corresponding genes symbols, and the relevant miRNA–mRNA interactions were identified ().
Table 1. Regulatory relationship between miRNAs and differentially expressed genes.
The function and pathways of the DEGs
For the up-regulated DEGs, KEGG pathway analyses indicated that they were significantly enriched in four pathways such as arachidonic acid metabolism (e.g., CYP2J2, CYP2B6, and GPX3), metabolism of xenobiotics by cytochrome P450 (MOXBCP) (e.g., UGT1A7, UGT1A10, and UGT1A6), maturity onset diabetes of the young (e.g., HNF1A, SLC2A2, and PKLR) and Drug metabolism (DGM) pathways (e.g., UGT1A7, UGT1A10, and UGT1A6) (). Notably, genes enriched in MOXBCP and DGM pathways were identical. Meanwhile, GO analysis indicated that these up-regulated DEGs were mainly involved in transmembrane transport process and diverse metabolic processes of cofactor, triglyceride, acylglycerol, neutral lipid, and glycerol ether ().
Table 2. Pathways analyses for up- and down-regulated DEGs.
Table 3. Biological processes for up- and down-regulated DEGs.
On the other hand, the down-regulated DEGs were primarily enriched in MOXBCP and DGM pathways, in which three genes of GSTM1, GSTM3, and ADH1B were all enriched (). Additionally, function of the down-regulated DEGs were significantly associated with regulation of tube size, regulation of blood vessel size, vascular process in circulatory system, chemical homeostasis, and inorganic anion transport (). Moreover, combined with the interactions of miRNA–mRNA, function of miRNAs was inferred according to that of mRNAs. As a result, the functions of miRNAs of seven targets were enriched. PDE8B (targeted by hsa-miR-128) was significantly enriched in cyclic nucleotide catabolic process and nucleoside monophosphate catabolic process; SLC26A7 (targeted by hsa-miR-132 and hsa-miR-223), SCN2A (targeted by hsa-miR-132, hsa-miR-194, hsa-miR-195, hsa-miR-223, hsa-miR-30e, and hsa-miR-374b), and SLC4A11 (targeted by hsa-miR-28-5p) were enriched in transport related function; KIT (targeted by hsa-miR-152) was significantly enriched in positive regulation of protein kinase activity, PPP1R3C (targeted by hsa-miR-374b) was significantly enriched in regulation of glycogen catabolic process; and PLN (targeted by hsa-miR-374b) were significantly enriched in homeostasis related processes (data not shown).
PPI networks of DEGs
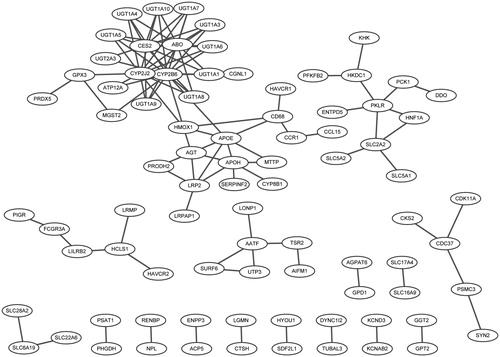
Based on information of the String database, the PPI networks of up- and down-regulated DEGs were constructed, respectively. In the PPI network for up-regulated DEGs, there were 84 nodes and 106 interactions (), and the hub nodes (degrees >5) were CYP2B6 (15), CYP2J2 (12), CES2 (10), ABO (9), APOE (7), and APOH (6).
Figure 1. Protein–protein interaction network for up- and down-regulated differently expressed genes.
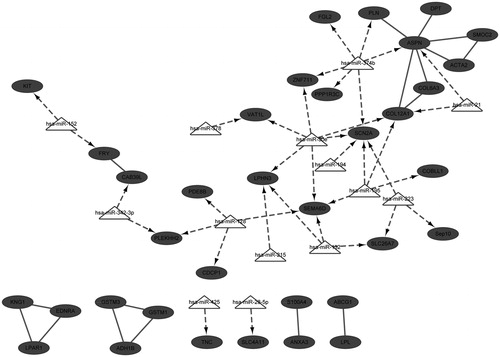
For down-regulated DEGs, the integrated network of miRNAs and DEGs was established, combining with the interactions of miRNA-mRNA. In this integrated network, there were 49 nodes and 54 interactions, and ASPN, COL12A1 and SCN2A were three hub nodes. In addition, key miRNAs like hsa-miR-30e, hsa-miR-374b, hsa-miR-128, hsa-miR-195, hsa-miR-132, and hsa-miR-223 were identified.
Discussion
Although hypertension is a chronic disease, it is an important factor for cardiovascular disease and a major cause for mortality.Citation24 In the present study, based on the analyses of microarray data, three down-regulated DEGs, ASPN, COL12A1, and SCN2A, were identified and predicted as targets of multiple miRNAs. As revealed in the integrated network (), ASPN was the target of miRNA-374b and miRNA-21, and COL12A1 was the target of miRNA-30e, miRNA-21, and miRNA-195, while SCN2A was the target of miRNA-30e, miRNA-374b, and miRNA-195. Notably, ASPN and COL12A1 were linked with each other in the integrated network.
Figure 2. Integrated network for down-regulated differently expressed genes.
COL12A1 is a homortrimer associated with type I collagen and its encoded protein belongs to the fibril-associated collagens with interrupted triple helices collagen family.Citation25 Reportedly, in renal cell carcinoma, expression of collagen genes are associated with poor prognosis in several tumor types and COL12A1 has been detected to be highly expressed in subtype three tumors.Citation26 COL12A1 is identified as the only collagen gene that up-regulated almost two fold in the db/db diabetic nephropathy mouse model, compared with normal mice.Citation27 Moreover, a recent study reveals that COL12A1 is up-regulated in salt-induced hypertensive rat.Citation28 As a class II secreted leucine-rich proteoglycans (SLRP), ASPN encodes a cartilage extracellular protein that could bind collagen and calcium.Citation29 In response to venous hypertension, ASPN is found to be significantly downregulated in varicose saphenous veins, compared with normal saphenous veins (NSV) (expression value: 40.0 versus 207.1).Citation30 However, most studies demonstrate ASPN is associated with osteoarthritis.Citation31,Citation32 ASPN was firstly implicated in renal cortex of hypertensive patients based on our study, suggesting it might be a novel gene marker for hypertensive kidney prognosis. Both of ASPN and COL12A1 are extracellular matrix (ECM) genes. Although there are no reports about their correlations, they are simultaneously down-regulated in mouse models and patient cells.Citation33 In addition, COL6A3, one family member of COL12A1, is also linked to ASPN in the sub-networks in early phase of Duchenne muscular dystrophy, based on the expression profile of GSE6011.Citation34 These collectively provide potent evidence that ASPN might function synergistically with COL12A1, as predicted in our integrated network ().
Regarding to the targeting interactions with miRNA, COL12A1 is reported as the target of miR-300-5p in adult rat cardiac fibroblastsCitation35 and the target of hsa-miR-16 in human obesity.Citation36 In the present study, COL12A1 was predicted as the target of hsa-miR-21, hsa-miR-30e, and hsa-miR-195. Reportedly, miR-21 is one of the miRNAs that induced by Angiotensin II. It is enriched in cardiac fibroblasts and could promote cardiac fibrosis via increasing expression of MMP2 in fibroblast.Citation35 Commonly, aberration of miR-21 links to development of various cancer types, and involves in numerous cellular process, such as proliferation, apoptosis and metastasis.Citation37,Citation38 In addition, COL12A1 is identified as one novel target of miR-26b in carcinoma-associated fibroblasts of breast cancer.Citation39 However, no targeting relationships between COL12A1 and miR-21, and miR-195 are reported yet. Interestingly, in renal mesangial cells, COL12A1 is suggested as a potential target of miR-30e*Citation40 further supporting our prediction of the targeting of hsa-miR-30e and COL12A1. For the targeting relationships between ASPN and miRNAs, ASPN is predicted as the target of miR-21 in hippocampus after traumatic brain injury.Citation41 Considering that COL12A1 was also predicted as the target of miR-21 but no validation and other prediction have been reported, it might be inferred the targeting of miR-21 on COL12A1 might be via the mediation of ASPN. However, more validation experiments are required.
Deletion of angiotensin II type 1 receptors could result in the disruption of epithelial sodium transport in proximal tubule, and then cause blood pressure alteration.Citation14 The sodium channels, voltage-gated alpha subunit gene SCN2A is considered as one candidate for hypertension detection.Citation7 However, based on current studies, this gene is mostly related to neurological disorders. Reportedly, mutations in SCN2A could cause seizures and epilepsy.Citation42,Citation43 With regard to the targeting miRNA and this gene, it is predicted as the target of miR-132, one of the neuronal activity-dependent miRNAs.Citation44 Unfortunately, there are few studies reported potential targeting of miR-30e or miR-374b and this gene, as predicted in our study. This suggests that SCN2A might be a novel target of these miRNAs in renal cortex of hypertensive patients. Likewise, we need extensive experiments to validate the findings in our study.
Although we provided more regulatory information than the study of Marques, there remained a limitation that all the predictive results need to be validated via substantial experiments. Nevertheless, our study is still of great value and provide novel insight into regulatory mechanisms on hypertensive kidney.
In conclusion, our results identified three crucial genes in hypertensive kidney, such as COL12A1, ASPN, and SCN2A. Among them, ASPN was linked to COL12A1 and they were both targets of miR-21. SCN2A might be the target of miR-30e and miR-374b. However, these regulatory relationships need to be further validated.
Disclosure statement
The authors report no conflicts of interest. The authors alone are responsible for the content and writing of the paper.
Related Research Data
References
- Cloutier L, Schiffrin EL. Hypertension prevalence and control: Impact of method of blood pressure measurement. Curr Cardiovasc Risk Rep. 2012;6:267–273.
- Coffman TM. Under pressure: The search for the essential mechanisms of hypertension. Nat Med. 2011;17:1402–1409.
- Guo F, He D, Zhang W, et al. Trends in prevalence, awareness, management, and control of hypertension among United States adults, 1999 to 2010. Journal of the American College of Cardiology 2012; 60:599–606.
- Büssemaker E, Hillebrand U, Hausberg M, et al. Pathogenesis of hypertension: Interactions among sodium, potassium, and aldosterone. Am J Kid Dis. 2010;55:1111–1120.
- Harris RC, Zhang M-Z. Dopamine, the kidney, and hypertension. Curr Hypertens Rep. 2012;14:138–143.
- Crowley SD, Gurley SB, Oliverio MI, et al. Distinct roles for the kidney and systemic tissues in blood pressure regulation by the renin-angiotensin system. J Clin Investigat. 2005;115:1092–1099.
- Mocci E, Concas MP, Fanciulli M, et al. Microsatellites and SNPs linkage analysis in a Sardinian genetic isolate confirms several essential hypertension loci previously identified in different populations. BMC Med Genet. 2009;10:81
- Fava C, Danese E, Montagnana M, et al. Serine/threonine kinase 39 is a candidate gene for primary hypertension especially in women: Results from two cohort studies in Swedes. J Hypertens. 2011;29:484–491.
- Clemitson J-R, Dixon RJ, Haines S, et al. Genetic dissection of a blood pressure quantitative trait locus on rat chromosome 1 and gene expression analysis identifies SPON1 as a novel candidate hypertension gene. Circulat Res. 2007;100:992–999.
- Nickel N, Kempf T, Tapken H, et al. Growth differentiation factor-15 in idiopathic pulmonary arterial hypertension. Am J Respirat Crit Care Med. 2008;178:534–541.
- Nunez-Iglesias J, Liu C-C, Morgan TE, et al. Joint genome-wide profiling of miRNA and mRNA expression in Alzheimer's disease cortex reveals altered miRNA regulation. PLoS One. 2010;5:e8898.
- Li S, Zhu J, Zhang W, et al. Signature microRNA expression profile of essential hypertension and its novel link to human cytomegalovirus infection. Circulation. 2011;124:175–184.
- Jansen C, Eischeid H, Goertzen J, et al. The role of miRNA-34a as a prognostic biomarker for cirrhotic patients with portal hypertension receiving TIPS. PLoS One. 2014;9:e103779.
- Marques FZ, Campain AE, Tomaszewski M, et al. Gene expression profiling reveals renin mRNA overexpression in human hypertensive kidneys and a role for microRNAs. Hypertension. 2011;58:1093–1098.
- Irizarry RA, Hobbs B, Collin F, et al. Exploration, normalization, and summaries of high density oligonucleotide array probe level data. Biostatistics. 2003;4:249–264.
- Smyth GK. Limma: Linear models for microarray data. Bioinformatics and Computational Biology Solutions Using R and Bioconductor. Springer, NY; 2005.
- Ritchie ME, Silver J, Oshlack A, et al. A comparison of background correction methods for two-colour microarrays. Bioinformatics. 2007;23:2700–2707.
- Noerholm M, Balaj L, Limperg T, et al. RNA expression patterns in serum microvesicles from patients with glioblastoma multiforme and controls. BMC Cancer. 2012;12:22.
- Kertesz M, Iovino N, Unnerstall U, et al. The role of site accessibility in microRNA target recognition. Nat Genet.2007;39:1278–1284.
- Grün D, Wang Y-L, Langenberger D, et al. microRNA target predictions across seven Drosophila species and comparison to mammalian targets. PLoS Comput Biol. 2005;1:e13.
- Da Wei Huang BTS, Lempicki RA. Systematic and integrative analysis of large gene lists using DAVID bioinformatics resources. Nat Protocols. 2008;4:44–57.
- Franceschini A, Szklarczyk D, Frankild S, et al. STRING v9. 1: Protein–protein interaction networks, with increased coverage and integration. Nucl Acids Res. 2013;41:D808–D815.
- Smoot ME, Ono K, Ruscheinski J, et al. Cytoscape 2.8: New features for data integration and network visualization. Bioinformatics. 2011;27:431–432.
- Chow CK, Teo KK, Rangarajan S, et al. Prevalence, awareness, treatment, and control of hypertension in rural and urban communities in high-, middle-, and low-income countries. JAMA. 2013;310:959–968.
- Posthumus M, September AV, O'Cuinneagain D, et al. The association between the COL12A1 gene and anterior cruciate ligament ruptures. Br J Sports Med. 2010;44:1160–1165.
- Zhao H, Ljungberg B, Grankvist K, et al. Gene expression profiling predicts survival in conventional renal cell carcinoma. PLoS Med. 2005;3:e13.
- Brunskill EW, Potter SS. Changes in the gene expression programs of renal mesangial cells during diabetic nephropathy. BMC Nephrol. 2012;13:70.
- Liu Y, Taylor NE, Lu L, et al. Renal medullary microRNAs in Dahl salt-sensitive rats miR-29b regulates several collagens and related genes. Hypertension. 2010;55:974–982.
- Salmon CR, Tomazela DM, Ruiz KGS, et al. Proteomic analysis of human dental cementum and alveolar bone. J Proteom. 2013;91:544–555.
- Javier BB, Rahmi O, Marc L, et al. Extracellular matrix remodelling in response to venous hypertension: Proteomics of human varicose veins. Cardiovasc Res. 2016;110:419–430.
- Elise Duval NB, Magalie H, Ikuyo K, et al. Asporin expression is highly regulated in human chondrocytes. Mol Med. 2011;17:816–823.
- Jazayeri R, Qoreishi M, Hoseinzadeh HR, et al. Investigation of the asporin gene polymorphism as a risk factor for knee osteoarthritis in Iran. Am J Orthop.2013;42:313–316.
- Vidak S, Kubben N, Dechat T, et al. Proliferation of progeria cells is enhanced by lamina-associated polypeptide 2α (LAP2α) through expression of extracellular matrix proteins. Genes Dev. 2015;29:2022–2036.
- Bernardini C, Censi F, Lattanzi W, et al. Gene regulation networks in early phase of Duchenne muscular dystrophy. IEEE/ACM Trans Comput Biol Bioinform. 2013;10:393–400.
- Jiang X, Ning Q, Wang J. Angiotensin II induced differentially expressed microRNAs in adult rat cardiac fibroblasts. J Physiol Sci. 2013;63:31–38.
- Li J, Zhou C, Li J, et al. Global correlation analysis for microRNA and gene expression profiles in human obesity. Pathol Res Pract. 2015;211:361–368.
- Si M, Zhu S, Wu H, et al. miR-21-mediated tumor growth. Oncogene. 2006;26:2799–2803.
- Rask L, Balslev E, Jørgensen S, et al. High expression of miR‐21 in tumor stroma correlates with increased cancer cell proliferation in human breast cancer. APMIS. 2011;119:663–673.
- Verghese ET, Drury R, Green C, et al. Role of miR-26b in carcinoma-associated fibroblasts and effect on migration and invasion of breast cancer epithelial cells. The Lancet. 2014;383:S103.
- Castro NE, Kato M, Park JT, et al. Transforming growth factor β1 (TGF-β1) enhances expression of profibrotic genes through a novel signaling cascade and microRNAs in renal mesangial cells. J Biol Chem. 2014;289:29001–29013.
- Redell JB, Zhao J, Dash PK. Altered expression of miRNA‐21 and its targets in the hippocampus after traumatic brain injury. J Neurosci Res. 2011;89:212–221.
- Hirose S, Mohney RP, Okada M, et al. The genetics of febrile seizures and related epilepsy syndromes. Brain Dev.2003;25:304–312.
- Herlenius E, Heron SE, Grinton BE, et al. SCN2A mutations and benign familial neonatal‐infantile seizures: the phenotypic spectrum. Epilepsia. 2007;48:1138–1142.
- Hansen KF, Obrietan K. MicroRNA as therapeutic targets for treatment of depression. Neuropsychiatr Dis Treat. 2013;9:1011–1021.