
Abstract
Blood and urine biochemistry screening tests are important for initial detection of diabetes, determination of severity of its complications, and monitoring of therapy. We evaluated the effects of aqueous chicory seed extract (CSE), on renal biochemical parameters, histology, and Na+/glucose cotansporters, SGLT1 and SGLT2 expression levels using metformin, and aspirin as controls. Late stage type 2 diabetes (LT2D; FBS, >300 mg/dl) and early stage type 2 diabetes (ET2D; FBS, 140–220 mg/dl) were induced in rats by streptozotocin (STZ group) and a combination of STZ and niacinamide (NIA/STZ group), respectively. A non-diabetic group was included as control. Treatment included daily intraperitoneal injections of either CSE (125 mg/kg b.w.) or metformin (100 mg/kg b.w.) and oral aspirin (120 mg/kg b.w.) for 21 days. At the end, blood and 24 h urine samples were collected; and kidneys were saved at −80 ˚C. CSE reduced urinary α1-microgobulin excretion in ET2D (p = .043), and serum uric acid (p = .045), and glomerular diameter (p < .01) in LT2D. Metformin appeared to be more effective in LT2D with respect to serum uric acid, urea, and BUN (< .05). Both CSE and metformin improved histology. Aspirin improved several blood and urine variables, but appeared to aggravate morphological damages to the kidney tissue. The absolute values of albumin, α1-microglobulin or total protein in urine rather than their creatinine ratios seemed more useful in the detection of early kidney damage; CSE was able to repair the kidney damage and α1-microglobulin was sensitive enough to allow monitoring of the improvements caused by the treatment.
Introduction
A healthy kidney is essential for glucose homeostasis. Kidney filters glucose and subsequently reabsorbs the filtered glucose or excretes it into urine; it uptakes glucose for its energy needs; and also releases into circulation the glucose that it has newly synthesized via gluconeogenesis.Citation1 Obesity, metabolic syndrome, and diabetes generate unfavorable changes in the kidney tissue and alter its functions.
Chronic kidney disease (CKD) can be initiated by hyperglycemia and lead to diabetic nephropathy (DN), which is the major cause of end-stage renal disease (ESRD).Citation2 Evidence suggests that DN develops much earlier in the course of the disease; there seems to be 4–7 years of asymptomatic phase between the onset of hyperglycemia and the actual clinical diagnosis of type 2 diabetes (T2D). During this lag period, chronic complications of diabetes, such as nephropathy, retinopathy, and cardiovascular disease that are caused mainly by micro- and macro-vascular changes in the endothelium of blood vessels, and metabolic acidosis, continue to develop in disguise.Citation3,Citation4
Although microalbuminuria is an important stage of kidney disease in diabetes,Citation5 it has been reported that kidney damage can occur without evident proteinuria or microalbuminuria. High-fat diet, for example, can cause significant kidney damage without any evidence of proteinuria or hyperglycemia. In addition, hyperglycemia and hypertension are needed for the presence of protein in urine.Citation6,Citation7 But, as diabetic patients often suffer from both hyperglycemia, hyperlipidemia, as well as hypertension, they are susceptible to kidney complications; therefore, traditional biomarkers including macro and microalbuminuria, and creatinine, as a marker of estimated glomerular filtration rate (eGFR), can still be used in the detection and monitoring of kidney damages.Citation8–13
We have previously shown the hypoglycemic and antihyperlipidemic effects of lyophilized Cichorium intybus L. aqueous seed extract (CSE).Citation14,Citation15 The aim of the present study was to test the usefulness of CSE in preventing diabetes-induced kidney damage. A number of DN biomarkers, such as urea, BUN, uric acid, creatinine, albumin, α1-microglobulin, total protein, sodium, potassium, and GFR were measured in serum and urine, and in the renal tissue samples of rats with early type 2 diabetes (ET2D) and late type 2 diabetes (LT2D).Citation16 We also noted kidney histology and the expression of Na+/glucose cotransporters in kidney tissue homogenates. Metformin and aspirin were used as controls.
Materials and methods
All the experiments were performed on the sera, urine samples and kidney tissues obtained from rats used in another study.Citation16
Preparation of plant extract, metformin and aspirin
The lyophilized powder of CSE that was stored at −20 °C belonged to a previous study from our laboratory.Citation14 Metformin and aspirin pills (Chemidaru industrial company, Tehran, Iran) were purchased from a drug store and crushed manually.
Animals
Animal care
Animal handling and treatment were performed in the Biochemistry Department of the School of Medicine, Tehran University of Medical Sciences (TUMS). Healthy adult male 8-week old Wistar albino rats weighing 190–260 g were obtained from University of Tehran, Institute of Biochemistry and Biophysics and housed in standard and clean cages (2 per cage) in animal room (temperature 22 ± 2 °C) and 12-h light/dark cycle with access to a standard rat chow and water ad libitum. The study was ethically approved by the review board of TUMS.
Induction of experimental diabetes
In brief, early and late stage type 2 diabetes (ET2D and LT2D) were induced in overnight fasted rats by single intraperitoneal injections of streptozotocin (STZ, 55 mg/kg) or combination of STZ (55 mg/kg) and niacinamide (NIA, 200 mg/kg, 15 min later), dissolved in chilled citrate buffer (0.3 ml).Citation14 Hyperglycemia was confirmed on days 4 and 10 after injection by measuring glucose levels in peripheral blood obtained from the tail vein (GlucoSure STAR, ApexBio, Taiwan). STZ-injected rats with fasting blood sugar (FBS) above 300 mg/dl in both occasions (day 4 and day 10) were considered as LT2D rats, and NIA/STZ-injected rats with stable FBS ranging between 140 and 220 mg/dl were considered as ET2D.Citation16 Normal rats received an injection of the vehicle without either STZ or NIA. STZ and NIA were obtained from Sigma-Aldrich Co. (St. Louis, MO).
Experimental design, group designation and treatment
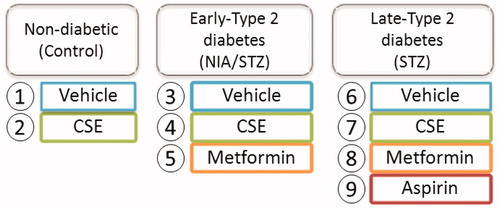
After diabetes induction, rats were assigned into nine groups (n = 6) as presented in and treatment was started on day 10. Groups 1 (Control, non-diabetic), 3 (NIA/STZ or ET2D), and 6 (STZ or LT2D) received injections of the vehicle (0.3 ml). Groups 2 (CSE-control), 4 (CSE-NIA/STZ), and 7 (CSE-STZ) were injected with CSE. Groups 5 (Met-NIA/STZ) and 8 (Met-STZ) were injected with metformin. The injections of CSE and metformin were daily and intraperitoneal, and lasted for 21 days (3 weeks); Group 9 (Asp-STZ) received daily aspirin orally by gavage. According to weekly body weights, certain amounts (mg) of CSE, metformin, and aspirin were pre-weighed in separate microtubes and kept in refrigerator; they were mixed with 0.3 ml of manually prepared and autoclaved citrate buffer (20 mM, pH 4.5) immediately before administration.Citation16
Figure 1. Rat groups. Duration of treatment, 21 days. Treatments included: CSE, 125 mg; metformin, 100 mg; and aspirin, 120 mg; per body weight per day.
Sample collection
At the end of the treatment time (day 31), animals were placed individually in metabolic cages for 24 h urine collection with access to water overnight. After measuring the volume, urine samples were acidified with 1 ml of 0.1 M HCL and centrifuged at 1200 rpm for 15 min; aliquots were stored at −80 °C. The rats were anesthetized with diethyl ether and sacrificed. Blood samples were collected for biochemical analysis by direct cardiac puncture and sera were separated by centrifugation at 3000 rpm for 15 min. The kidneys were submerged in liquid nitrogen after separation from the body and stored at −80 °C.
Biochemical analysis
Measurement of urea, uric acid, creatinine and albumin in serum and urine was performed by spectrophotometric methods using diagnostic kits (Ziest Chem Diagnostics, Tehran, Iran). A kit from the same company based on the Biuret method was used to determine total protein in the serum, and the Bradford method was used to measure total protein in tissue homogenates and urine samples.Citation17 ELISA (NovaTeinBio, Woburn, MA) was used to measure α1-microglobulin in serum and urine. Sodium and potassium levels in serum were measured by flame-photometry. Glucose level in urine was measured by glucose oxidase activity assay kit (Ziest-Chem, Iran). GFR was calculated according to the following formula:
Histological observation
A small piece of frozen kidney tissues of all groups were fixed in an aqueous solution of 10% formaldehyde, dehydrated in graduated ethanol (50–100%), cleared in xylene, and embedded in paraffin. Renal sections (5 μm) were examined with a photomicroscope (400×) after staining with hematoxylin and eosin (H&E) dye.
Membrane preparation for SGLT1 and SGLT2 blotting
Half of each kidney tissue was homogenized in chilled buffer A (137 mM NaCl, 8.1 mM Na2HPO4, 2.7 mM KCl, 1.5 mM KH2PO4, 2.5 mM EDTA, 1 mM dithiothreitol, 0.2 mM PMSF, mM cocktail) by hand homogenizer and further by trituration with insulin syringe. Lysates were first centrifuged at 6000g for 15 min at 4 °C. The supernatants were centrifuged at 120,000g for 1 h at 4 °C to prepare cytosolic and total particulate fractions. The total particulate fractions, which contained membrane fraction, were washed twice and resuspended in buffer A containing 1% (v/v) Triton X-100.Citation18 After centrifugation, the protein in each fraction was quantified by the Bradford procedure.
Western blot analysis
For each electrophoresis lane, equal amounts of protein (30 μg) were mixed with loading buffer and boiled for five minutes. Samples were separated on an 8% sodium dodecyl sulfate-polyacrylamide gel and then transferred to polyvinylidene fluoride (PVDF) membrane. PVDF blots were blocked by incubation in PBST (20 mM PBS, pH 7.4, and 0.1% Tween 20) containing 5% nonfat skim milk overnight at 4 °C and then incubated with a rabbit polyclonal antibodies against SGLT1 (1: 1000 dilution), SGLT2 (1: 200 dilution), and β-actin (1: 3000 dilution) for 2 h at 37 °C (Abcam Inc., Cambridge, MA). After three washing steps (PBST, each step 5 min), a horseradish peroxidase (HRP)-conjugated polyclonal secondary anti-rabbit antibody (1: 20,000 dilution) was added and incubated for 1 h. After three washing steps, the bands were visualized with enhanced chemiluminescence detection kit (ECL) (Thermo Scientific, Waltham, MA). Image J software (NIH) was used for densitometric analysis of the bands.
Statistical analysis
Statistical analysis was performed by SPSS software (version 20, Chicago, IL). Normal distribution of continuous variables was checked by the Kolmogrov–Smirnov test in each group. All variables in each group had normal distribution, so the comparison of continuous variables between different groups was carried out by one-way analysis of variance (ANOVA) followed by the Scheffe and Dunnett T3 post hoc tests. Data were presented as the mean ± standard deviation (SD). The level of significance was considered .05. Pearson coefficients were measured for association between continuous variables.
Results
Body weights and FBS
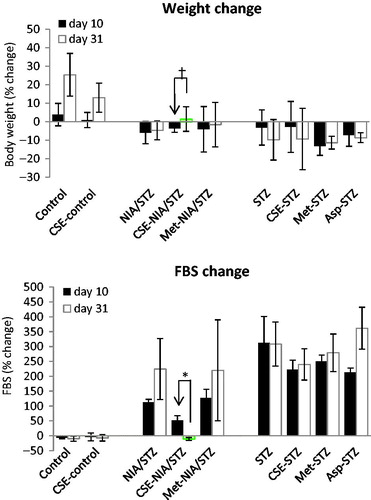
After diabetes induction, FBS levels increased significantly to >300 mg/dl in STZ groups (LT2D), and ranged between 140 and 220 mg/dl in NIA/STZ groups (ET2D); the LT2D rats lost significant weight, but weight loss was not significant in NIA/STZ-induced diabetes (ET2D).Citation16 The percent changes of FBS and body weight at the end of treatment (day 31) versus start of treatment (day 10) are shown in ; CSE significantly lowered FBS (p < .001) and increased body weight (p = .032) in ET2D rats.
Figure 2. Comparison of body weights and FBS levels after confirmation of diabetes induction (day 10, black bar) vs. at the end of study time (day 31, white bar). *p < .001; †p = .032.
Blood and urine parameters in the final day of treatment (day 31)
Untreated diabetic groups
Induction of LT2D led to significant increase in several serum variables, including uric acid (p = .04), creatinine (p < .001), urea (p = .001), and BUN (p = .001); and a decrease in albumin levels (p = .047) (). Again in serum, changes common to both types of diabetes were a decrease in Na+ (p = .007) due to diabetic hyperosmolar state, an increase in K+ (p < .001) due to lack of enough insulin and the resulting disturbances of internal potassium balance, and a decrease in serum α1-microglobulin levels (p = .002 for LT2D; p = .011 for ET2D).Citation19–21 Urine volume (p < .001 for LT2D; p = .01 for ET2D), α1-microgobulin (p = .001 for LT2D; p = .006 for ET2D), and total protein (p = .006 for ET2D; p = .018 for LT2D) increased after induction of both types of diabetes (). Urinary levels of glucose (p = .001), uric acid (p = .002), creatinine (p = .005), and urea (p < .001) increased in LT2D, and albumin levels increased in ET2D (p = .042). There was a strong correlation between 24 h urine urea and creatinine perhaps due to excessive loss of muscle mass (; Pearson correlation = .889, p < .001). Correlation between urine α1-microglobulin and serum uric acid was stronger (Pearson coefficient = .811, p = .001) than the correlation between urine albumin and serum uric acid (Pearson coefficient = .399, p = .112) ().
Figure 3. Correlation coefficients between 24 h urine urea and creatinine (A), urine albumin and serum uric acid (B), and urine α1-microglobulin and serum uric acid (C).
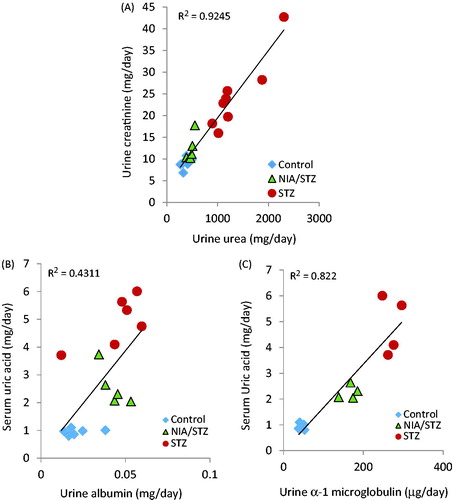
Table 1. Summary statistics of serum variables values after diabetes induction and 21 days of treatments.
Table 2. Summary statistics of 24 h urine variables values after diabetes induction and 21 days of treatments.
CSE-treated groups
CSE treatment decreased the level of urea (p = .005), BUN (p = .005), and K+ (p = .006), and increased Na+ (p = .037) in serum; it also significantly decreased urinary α1-microglobulin (p = .043) in CSE-STZ/NIA relative to the NIA/STZ group. In LT2D, uric acid levels in serum (p = .045), urine volume (p = .012), and urinary glucose (p = .021) decreased in the CSE-STZ group ( and ).
Metformin-treated groups
In ET2D, treatment with metformin did not affect blood or urine biochemistry. In LT2D, metformin lowered blood concentrations of uric acid (p = .021), urea (p = .012), and BUN (p = .012); it also decreased urine glucose (p = .002) and urea (p = .001) ( and ).
Aspirin-treated group
Urea (p = .001) and BUN (p = .001) decreased and creatinine (p < .001) increased in blood under aspirin. Aspirin significantly reduced the urine volume (p < .001), and urinary levels of glucose (p = .001), uric acid (p = .042), urea (p = .002), and total protein (p < .05) in Asp-STZ relative to the STZ group ( and ).
Histological observation
Kidney histology for normal rats (Control and CSE-control) and for those with ET2D and LT2D are shown in . The average values of glomerular diameters measured from three perspectives for 10 glomeruli in each group are given in . When compared to STZ-group, CSE caused a reduction in average glomerular diameter (p = .007). Aspirin, on the other hand, seemed to increase glomerular diameter (p = .83).
Figure 4. H & E stained optical micrographs of kidney tissue morphology of normal non-diabetic rats before (Control) and after (CSE-control) treatment with chicory (×400). G: glomerulus; US, urinary space; DCT: distal convoluted tubules; UP: urinary pole.
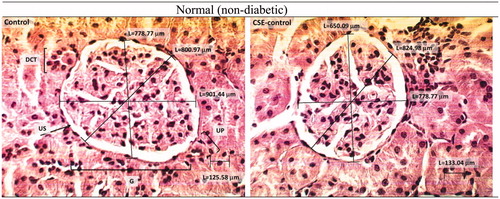
Figure 5. H & E stained kidney histopathology micrographs of NIA/STZ (ET2D) group of rats before and after treatment with CSE and metformin (×400). E-T2D caused extensive irregularity in the glomerular basement membrane (GBM) and mild scleronecrosis. Treatment with CSE and metformin seemed to improve the condition.
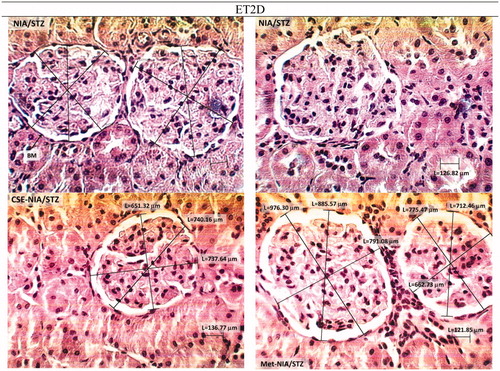
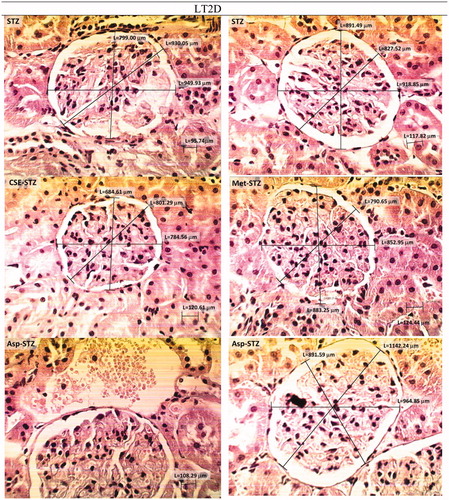
Figure 6. H & E stained kidney histopathology micrographs of STZ group of rats before and after treatment with CSE, metformin and aspirin (×400). LT2D led to a widening of urinary space, overlaying cellular crescent fibrinohyalinosis, dilatation, vascularization, and necrosis and leukocyte infiltration. Treatment of STZ group with chicory may have improving effects. Aspirin apparently did not improve the structural situation; more dilatation and vascularization was observed, urinary space was still large and hyalinization was present.
Western blot analysis
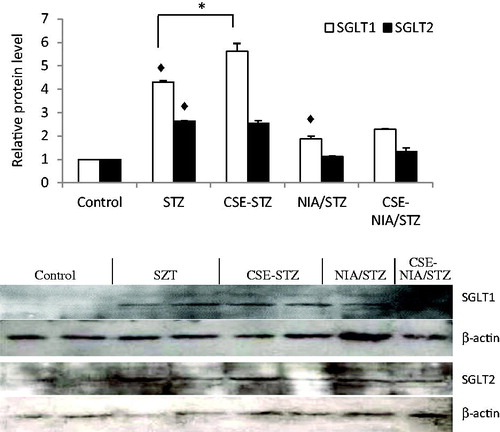
The expression levels of SGLT1 and SGLT2 proteins increased significantly in the kidney tissue after diabetes induction (p < .01). Treatment with CSE increased SGLT1 (p < .01), but did not change the SGLT2 levels ().
Figure 7. Western blotting for SGLT1 and SGLT2 proteins in ET2D and LT2D before and after treatment with CSE. ♦p < .01 versus Control; *p < .01. Data are expressed as mean ± SD of two experiments.
Discussion
In diabetes, flesh and limbs flow into urine to produce alterations in urine and blood variables.Citation22 To evaluate some of these variables, we created sets of diabetic animals with ET2D and LT2D (LT2D may be taken as equivalent to uncontrolled insulin-deficient diabetes). Increase in FBS and urine output, low insulin in ET2D and lack of insulin in LT2D rats, in addition to behavioral changes such as aggressiveness and fatigue, were a proof for diabetes induction. The significantly altered biochemical parameters are shown in bold and italic fonts in and .
In ET2D rats, CSE had ameliorating effects on FBS, urea, BUN, α-1-microglobulin, sodium, and potassium, in serum. In urine of ET2D rats, the most pronounced effect of CSE was on α-1-microglobulin levels. CSE and metformin were similar in causing a non-significant reduction in urine albumin levels, but only CSE was able to significantly lower urine α1-microglobulin. Although creatinine excretion increases in diabetes, the urinary protein levels are frequently normalized to urinary creatinine concentration.Citation13 No significant change was observed in urinary albumin/creatinine or α1-microglobulin/creatinine ratios across the groups. It seemed that early engagement of the kidneys could be anticipated from abnormal absolute values of albumin, α1-microglobulin or total protein in urine rather than their creatinine ratios; only CSE seemed able to reverse the kidney problem and only α1-microglobulin was sensitive enough to successfully show improvements that followed treatment. α1-Microglobulin is a low molecular weight glycoprotein. The free form completely filters through the glomeruli and then is reabsorbed completely by normal proximal tubules. Its urine levels provide information about the renal filtration and reabsorption capacity of low molecular weight proteins.Citation13
Elevated uric acid in serum (>8 mg/dl) and its low urinary excretion are associated with higher risk of T2D and increased chance of renal insufficiency by 3 fold in men and 10 fold in women.Citation23–26 In the present study, uric acid levels in serum had a tendency to significantly decrease under CSE and metformin in LT2D. In diabetic animals, a better correlation coefficient between urine α1-microglobulin and serum uric acid (Pearson coefficient = .811) compared to that between urine albumin and serum uric acid (Pearson coefficient = .399) may support the concept that high serum uric acid can cause damage to the kidneys and lead to proteinuria; it may also suggest that α1-microglobulin was a better and a more sensitive candidate for the evaluation of kidney alleviation in the early stages of diabetes although the stability of α1-microglobulin in acidified urine may also be a factor.Citation24,Citation27
Without affecting blood and urine markers in ET2D, metformin was able to lower urinary glucose and urea, as well as serum urea and BUN levels, in LT2D. Aspirin significantly lowered urea and BUN in sera of LT2D rats but there was an unfavorable significant increase of creatinine in blood, indicating poor clearance of creatinine by the kidneys; there was a decrease in urine volume, glucose, uric acid, urea, and total protein levels of Asp-STZ group compared to the STZ group.
With regard to histology, renal tissues from ET2D and LT2D were different from normal and from each other. High intracellular glucose (glucotoxicity), deranged glucose metabolism, inflammation, oxidative stress, fibrosis and increased glomerular capillary pressureCitation5,Citation28 can cause damage to renal structural components, the extent of which correlates with urinary albumin excretion.Citation29 Some researchers have found the histological damages to kidneys to be unimpressive in STZ-induced diabetes attributing them to STZ toxicity, but Danda et al. found that low-dose STZ caused greater kidney lesions than high-dose STZ and concluded that the structural damage was not due to STZ nephrotoxicity.Citation7,Citation30 Similarly, our results showed that urine albumin and total protein increased more significantly in ET2D than in LT2D. Among the common histological findings in diabetic kidney,Citation5 we observed a widening of urinary space, overlaying cellular crescent fibrinohyalinosis, dilatation, vascularization, necrosis, and leukocyte infiltration. CSE seemed to alleviate the morphology in both types of T2D. This effect of CSE may originate from its anti-inflammatory effects Citation16,Citation31 or its ability to reduce serum levels of uric acid or the size of glomerulus diameter that occurred in LT2D. Elevated uricemia has been linked to wall thickening, protein deposition, and smooth muscle cell proliferation in the kidney.Citation7
Despite the favorable effects on urine levels of glucose, uric acid, urea, and total proteins, aspirin seemed to increase the glomerular diameter. Glomerular enlargement is an important risk factor for various types of kidney diseases including chronic kidney disease (CKD).Citation32 Metformin appeared to decrease the structural lesions as it has been reported to ameliorate pathological renal injury in T2D and prevent kidney cancer.Citation33–35
Increased glycosuria in diabetes can be associated with increased levels of sodium-dependent glucose transporters, including SGLT1 and SGLT2 proteins.Citation36 Western blot analysis of these proteins suggested greater protein levels of both SGLT1 and SGLT2 in STZ- and NIA/STZ-induced diabetes in rats () in agreement with other studies.Citation37 Despite the reported diuretic properties, chicory did not decrease the expression levels of SGLT1 nor SGLT2 proteins.Citation38 As inhibition of both SGLT2 and SGLT1 inhibitors should lead to increased excretion of glucose in urine, the inability of CSE, metformin, and aspirin to inhibit SGLT2 and SGLT1protein expression could have been inferred from the observation that the amount of glucose in 24 h urine samples showed a continuous decrease (not an increase) during treatment.Citation39 Instead, CSE tended to increase the expression of SGLT1. The effect of metformin and aspirin on SGLT1 or SGLT2 proteins were not evaluated, but metformin has been shown to increase the SGLT1 levels in duodenum and jejunum.Citation40 Diuretic property of chicory may be related to its ability to slightly increase GRF (NIA/STZ vs. CSE-NIA/STZ, p = .057).
In summary, chicory benefited both types of diabetes with regard to histology, reduced serum uric acid and glomerular diameter in LT2D and lowered urinary α1-microglobulin in ET2D. The absolute values of albumin, α1-microglobulin or total protein in urine, not their creatinine ratios, were better markers for early renal damage. CSE was able to reverse kidney damage judging from its ability to significantly lower urine α1-microglobulin and improve histological appearance.
Acknowledgements
We thank Mr. Ali-Akbar Hasseli of the Institute of Biochemistry and Biophysics (IBB) of University of Tehran for help with ultracentrifugation. We thank Department of Anatomy, TUMS, for the technical help with tissue histology. Finally, we thank Aminsan Company for their help with kits and chemicals.
Disclosure statement
The authors declare that they have no conflict of interest.
Additional information
Funding
References
- Marsenic O. Glucose control by the kidney: An emerging target in diabetes. Am J Kidney Dis. 2009;53:875–883.
- Rebić D, Hadžović-Džuvo A, Valjevac A. Chronic kidney disease and endothelium. EMJ Nephrol. 2015;3:111–117.
- Heydari I, Radi V, Razmjou S, Amiri A. Chronic complications of diabetes mellitus in newly diagnosed patients. Int J Diabetes Mellit. 2010;2:61–63.
- Hong D, Zhang Y, Gao B, et al. Metabolic syndrome without diabetes or hypertension still necessitates early screening for chronic kidney disease: information from a Chinese National Cross-Sectional Study. Plos One. 2015;10:e0132220.
- Ahmad J. Management of diabetic nephropathy: Recent progress and future perspective. Diabetes Metab Syndr. 2015;9:343–358.
- Imai E, Ito S, Haneda M, et al. Effects of blood pressure on renal and cardiovascular outcomes in Asian patients with type 2 diabetes and overt nephropathy: A post hoc analysis (ORIENT-blood pressure). Nephrol Dial Transpl. 2016;31:447–454.
- Danda RS, Habiba NM, Rincon-Choles H, et al. Kidney involvement in a nongenetic rat model of type 2 diabetes. Kidney Int. 2005;68:2562–2571.
- Viberti GC, Hill RD, Jarrett RJ, et al. Microalbuminuria as a predictor of clinical nephropathy in insulin-dependent diabetes mellitus. Lancet. 1982;1:1430–1432.
- Dunkler D, Gao P, Lee SF, et al. Risk prediction for early CKD in type 2 diabetes. Clin J Am Soc Nephrol. 2015;10:1371–1379.
- Foon TS, Yook Chin C, Chinna K. Rate of decline of kidney function in patients with type 2 diabetes mellitus and the associated factors: A10-year retrospective cohort study. Asia Pac J Public Health. 2015;27:NP640–NP649.
- Hong J, Zhang JP, Xie LT, et al. Significance of normal range urinary albumin to creatinine ratio in Chinese subjects with metabolic syndrome. J Huazhong Univ Sci Technol Med Sci. 2015;35:862–867.
- Mandal AK, Hiebert L. Diagnosis and management of diabetes and the relationship of dglucose to kidney function. Curr Diabetes Rev. 2015;11:116–121.
- McMahon GM, Waikar SS. Biomarkers in nephrology: Core Curriculum 2013. Am J Kidney Dis. 2013;62:165–178.
- Ghamarian A, Abdollahi M, Su X, et al. Effect of chicory seed extract on glucose tolerance test (GTT) and metabolic profile in early and late stage diabetic rats. Daru. 2012;20:56.
- Ziamajidi N, Khaghani S, Hassanzadeh G, et al. Amelioration by chicory seed extract of diabetes- and oleic acid-induced non-alcoholic fatty liver disease (NAFLD)/non-alcoholic steatohepatitis (NASH) via modulation of PPARalpha and SREBP-1. Food Chem Toxicol. 2013;58:198–209.
- Rezagholizadeh L, Pourfarjam Y, Nowrouzi A, et al. Effect of Cichorium intybus L. on the expression of hepatic NF-κB and IKKβ and serum TNF-α in STZ- and STZ + niacinamide-induced diabetes in rats. Diabetol Metab Syndr. 2016;8:11.
- Bradford MM. A rapid and sensitive method for the quantitation of microgram quantities of protein utilizing the principle of protein-dye binding. Anal Biochem. 1976;72:248–254.
- Han HJ, Lim MJ, Lee YJ, et al. Effects of TCDD and estradiol-17beta on the proliferation and Na+/glucose cotransporter in renal proximal tubule cells. Toxicol in Vitro. 2005;19:21–30.
- Riphagen IJ, Logtenberg SJJ, Groenier KH, et al. Is the association of serum sodium with mortality in patients with type 2 diabetes explained by copeptin or NT-proBNP? (ZODIAC-46). Atherosclerosis. 2015;242:179–185.
- Liamis G, Liberopoulos E, Barkas F, Elisaf M. Diabetes mellitus and electrolyte disorders. World J Clin Cases. 2014;2:488–496.
- Sterns RH, Cox M, Feig PU, Singer I. Internal potassium balance and the control of the plasma potassium concentration. Medicine. 1981;60:339–354.
- Workeneh B, Bajaj M. The regulation of muscle protein turnover in diabetes. Int J Biochem Cell Biol. 2013;45:2239–2244.
- Li LX, Wang AP, Zhang R, et al. Decreased urine uric acid excretion is an independent risk factor for chronic kidney disease but not for carotid atherosclerosis in hospital-based patients with type 2 diabetes: A cross-sectional study. Cardiovasc Diabetol. 2015;14:36.
- Hovind P, Rossing P, Johnson RJ, Parving HH. Serum uric acid as a new player in the development of diabetic nephropathy. J Ren Nutr. 2011;21:124–127.
- Tseng CH. Correlation of uric acid and urinary albumin excretion rate in patients with type 2 diabetes mellitus in Taiwan. Kidney Int. 2005;68:796–801.
- Kang DH, Nakagawa T, Feng L, et al. A role for uric acid in the progression of renal disease. Clin J Am Soc Nephrol. 2002;13:2888–2897.
- Donaldson MD, Chambers RE, Woolridge MW, Whicher JT. Stability of alpha 1-microglobulin, beta 2-microglobulin and retinol binding protein in urine. Clin Chim Acta. 1989;179:73–77.
- Elsherbiny NM, Al-Gayyar MM. The role of IL-18 in type 1 diabetic nephropathy: the problem and future treatment. Cytokine. 2016;81:15–22.
- Polat SB, Ugurlu N, Aslan N, et al. Evaluation of biochemical and clinical markers of endothelial dysfunction and their correlation with urinary albumin excretion in patients with type 1 diabetes mellitus. Arch Endocrinol Metab. 2016;60:117–124.
- Gross ML, Ritz E, Schoof A, et al. Comparison of renal morphology in the Streptozotocin and the SHR/N-cp models of diabetes. Lab Invest. 2004;84:452–464.
- Zhang YW, Wu CY, Cheng JT. Merit of Astragalus polysaccharide in the improvement of early diabetic nephropathy with an effect on mRNA expressions of NF-kappaB and IkappaB in renal cortex of streptozotoxin-induced diabetic rats. J Ethnopharmacol. 2007;114:387–392.
- Samuel T, Hoy WE, Douglas-Denton R, et al. Applicability of the glomerular size distribution coefficient in assessing human glomerular volume: The Weibel and Gomez method revisited. J Anat. 2007;210:578–582.
- Alhaider AA, Korashy HM, Sayed-Ahmed MM, et al. Metformin attenuates streptozotocin-induced diabetic nephropathy in rats through modulation of oxidative stress genes expression. Chem Biol Interact. 2011;192:233–242.
- Kim J, Shon E, Kim CS, Kim JS. Renal podocyte injury in a rat model of type 2 diabetes is prevented by metformin. Exp Diabetes Res. 2012;2012:210821.
- Tseng CH. Use of metformin and risk of kidney cancer in patients with type 2 diabetes. Eur J Cancer. 2016;52:19–25.
- Gallo LA, Wright EM, Vallon V. Probing SGLT2 as a therapeutic target for diabetes: basic physiology and consequences. Diab Vasc Dis Res. 2015;12:78–89.
- Osorio H, Coronel I, Arellano A, et al. Ursodeoxycholic acid decreases sodium-glucose cotransporter (SGLT2) expression and oxidative stress in the kidney of diabetic rats. Diabetes Res Clin Pract. 2012;97:276–282.
- Petrovic J, Stanojkovic A, Comic L, Curcic S. Antibacterial activity of Cichorium intybus. Fitoterapia. 2004;75:737–739.
- Alvarez CA, Neeland IJ, McGuire DK. Sodium-glucose co-transporter inhibition in the treatment of diabetes: Sweetening the pot. Diab Vasc Dis Res. 2015;12:74–77.
- Lenzen S, Lortz S, Tiedge M. Effect of metformin on SGLT1, GLUT2, and GLUT5 hexose transporter gene expression in small intestine from rats. Biochem Pharmacol. 1996;51:893–896.