
Abstract
Background: Recent studies have reported that mesenchymal stem cells (MSCs) exert therapeutic effects on the treatment of diabetic nephropathy (DN), but the underlying mechanisms remain unclear.
Methods: A dataset GSE65561 was obtained from Gene Expression Omnibus (GEO) database, which contained four healthy control samples (group 1), four healthy controls samples co-cultured with MSCs (group 2), five DN samples (group 3) and five DN samples co-cultured with MSCs (group 4). The differentially expressed genes (DEGs) between group 3 vs. group 1 and group 4 vs. group 2 were constructed using Linear Models for Microarray (LIMMA) package package. Then, DAVID was used to analyze the functional enrichment of DEGs. Based on STRING database the protein-protein interaction (PPI) network was visualized by the Cytoscape plug-in CytoNCA. Besides, the hub miRNAs and transcription factors (TFs) regulating DEGs were predicted using Webgestalt.
Results: Totally, 303 up-regulated and 88 down-regulated DEGs were shared in group 3 vs. group 1 and group 4 vs. group 2. Besides, the up-regulated DEGs were mainly enriched in ‘translation’ and ‘translational elongation’, while the down-regulated genes were only enriched in ‘protein kinase activity’. RPS27A and RPLP0 had a higher degree in the PPI network and they were regulated by EIF3M. In addition, ETF1 was predicted to be an important gene, which was regulated by miR-150, miR-134 and EIF2S1.
Conclusions: RPS27A, RPLP0 and ETF1 may be potential targets for MSCs on the treatment of DN.
RPS27A and RPLP0 may be important genes in the treatment of MSCs for DN.
TF EIF3M may play a key role in the treatment of MSCs for DN.
MiR-150 and miR-134 may be essential microRNAs in the treatment of MSCs for DN.
Highlights
Introduction
Diabetic nephropathy (DN) is a progressive nephropathy caused by diabetes mellitus (DM) [Citation1] and about one-third of type 1 DM patients and 25% of type 2 DM develop DN [Citation2,Citation3]. DN is characterized by glomerular hypertrophy, increased renal tubular membrane and glomerular membrane thickness and extracellular matrix accumulation in these membranes, which cause glomerular fibrosis and ultimately lead to damage renal function [Citation4,Citation5]. DN is the main reason for the world’s end-stage renal failure and cardiovascular death [Citation6]. Thus, it has important significance to study the novel treatment strategy for DN.
Infiltration of monocytes and monocyte-derived macrophages is the hallmark of DN [Citation7]. Monocytes play an important role on the defense mechanism of the organism, nevertheless the function of monocytes separated from DN patients have been impaired [Citation8]. CD14 + CD16 + monocytes are related to microinflammation in patients with DN, whose immunological dysfunction are reported to be associated with activation in NF-kappa; B/TLR4 rather than Notch1 signaling pathway [Citation9,Citation10]. Changes in mononuclear cells can reduce inflammation and may contribute to the treatment of patients with type 2 diabetes [Citation9]. Therefore, controlling the numbers of monocytes and macrophages are critical for the treatment of DN.
Mesenchymal stem cells (MSCs) promote the proliferation and maturation of monocytes [Citation11]. Reportedly, human MSCs can modulate the down-regulation of CD8 expression on CD8 + T cells mediated by CD14 + monocytes [Citation12]. MSCs enhance the phagocytic activity of circulating monocytes in a mouse model of gram negative sepsis [Citation13]. In addition, MSCs have been shown to inhibit the initial differentiation of monocyte-derived dendritic cells, thereby ameliorate DN [Citation14]. Moreover, Lv et al. have suggested that MSCs may ameliorate DN through inhibition of MCP-1 expression, reducing macrophages infiltration and down-regulating several proinflammatory factors expression such as IL-6 and TNFα in renal tissue of diabetic rats [Citation15]. However, the mechanisms of MSCs in the treatment for DN have still been partially investigated.
In a recent study, Wise et al. used a microarray analysis to screen differentially expression genes (DEGs) of monocytes before and after MSCs co-culture and the result indicated MSC treatment significantly upregulated genes associated with a reparative macrophage such as cytokines IL-10, IGF1, CCL2 and VEGF-A [Citation11]. However, the regulatory mechanisms of DEGs have not been discussed. The goal of this study was to further screen crucial genes associated with MSCs for treatment of DN by construction of a miRNA-TF-mRNA network using the same dataset of Wise et al. [Citation11]. This study may provide a theoretical basis for the study of MSCs in the treatment of DN.
Methods
Microarray data acquisition
The microarray expression data and platform annotation files of GSE65561 [Citation11] uploaded in Gene Expression Omnibus (GEO) database (http://www.ncbi.nlm.nih.gov/geo/query/acc.cgi?acc=GSE65561) were obtained and it was sequenced from the chip platform GPL16686 [HuGene-2_0-st] Affymetrix Human Gene 2.0 ST Array [transcript (gene) version]. A total of 18 cell samples were included in this dataset, four healthy control samples (group 1), four healthy controls samples co-cultured with MSCs for 48 h (group 2), five samples from type 2 diabetic patients with end-stage renal disease groups (group 3) and five samples of diabetic patients with end-stage renal disease groups co-cultured with MSCs for 48 h (group 4). Among them, four healthy control blood samples were obtained from the Australian Red Cross Blood Service and five disease blood samples were obtained from five diabetic patients with end-stage renal disease receiving hemodialysis at the Monash Medical Centre. This study was ethically approved by the Monash Health Human Research Ethics Committee (Monash 10179B) and the Monash University Human Research Ethics Committee (CF07/3495–2007001798). Additionally, informed consent was obtained from participants.
Identification of DEGs shared in group 3 vs. group 1 and group 4 vs. group 2
The GSE65561 chip data was normalized using the robust multi-array average (RMA) method [Citation16] in the Affy package (Version: 1.52.0) of the R software (Version: 3.3.2). The DEGs in the comparison groups of group 3 vs. group 1 and group 4 vs. group 2 were identified by Linear Models for Microarray (LIMMA) package (Version: 3.30.3) [Citation17] in R software and the t-test was used to calculate p values of each DEG. p values < .05 was used as the threshold. Additionally, the R package gplots (Version: 3.0.1) was used to draw the DEGs expression heat map, which displayed the clustering of the DEGs in different samples.
Functional enrichment analysis of DEGs
The Gene Ontology (GO) database stores extensive information of gene sets including GO terms as well as the annotations of genes [Citation18] and the Kyoto Encyclopedia of Genes and Genomes (KEGG) [Citation19] database provides informative pathways for substantial genes. The GO function and KEGG pathway involved in DEGs were analyzed by the online tool DAVID (version: 6.7, https://david-d.ncifcrf.gov/summary.jsp) [Citation20]. The terms with the number of enriched genes count ≥ 2 and the hypergeometric significance p values < .05 were considered significant.
PPI network
Based on the search tool for the retrieval of interacting genes/proteins (STRING) database (Version: 10.0, http://www.string-db.org/) [Citation21], the PPI network of the DEGs was analyzed. The combined score was set to >0.4. Using the Cytoscape plug-in CytoNCA (Version: 2.1.6) [Citation22], the degrees of the three network topological scores were visualized: Degree Centrality (DC), Betweenness centrality (BC) and Closeness centrality (CC) in the network. The parameter was set to ‘network without weight’. Among the CytoNCA output results, the node, edge and degree represent the protein, the relationship pair of proteins and the number of relationship pairs interacted with this protein, respectively. Besides, the nodes with higher degree were considered as the hub proteins [Citation23].
Sub-module analysis
By using the MCODE plugin of cytoscape (Version: 1.4.2) [Citation24], the sub-module of PPI network was analyzed with the default thresholds: Degree Cutoff: 2; Node Score Cutoff: 0.2; K-Core: 2 and Max; Depth: 100. Besides, the correlation of GO terms for the sub-network module with the highest score were analyzed by using Golorize (Version: 1.0.0.beta1) [Citation25].
Prediction of regulation relationship between miRNAs and target genes
The miRNAs that targeted the DEGs were predicted using Webgestalt (http://www.webgestalt.org/) [Citation26]. The number of enriched genes ≥2 and adjusted p < .05 were chosen as the threshold. Moreover, the hypergeometric test and Benjamini-Hochberg (BH) [Citation27] adjustment were conducted.
Prediction of TFs
Based on the transcriptional regulatory network data in the ITFP (http://itfp.biosino.org/itfp) and TRANSFAC (http://www.gene-regulation.com/pub/databases.html) databases, the TFs in DEGs were predicted and then the DEGs regulated by these TFs were identified.
Results
Screening of DEGs
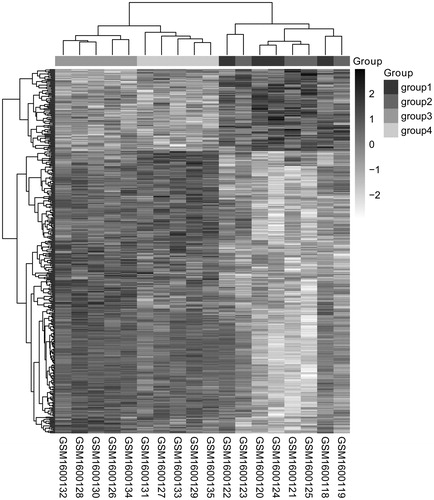
A total of 1622 DEGs including 916 up-regulated genes and 706 down-regulated genes were screened from comparison groups of group 3 vs. group 1. And there were 1289 up-regulated DEGs and 1112 down-regulated DEGs in comparison groups of group 4 vs. group 2. Additionally, the overlapped genes between these two comparison groups were obtained, 303 genes were finally found to be up-regulated and 88 genes were down-regulated in group 3 and 4 compared to group 1 and 2, respectively. These DEGs could well distinguish from the four kinds of samples based on the DEGs expression heat map ().
Figure 1. Two-way hierarchical clustering heat map of DEGs. The horizontal axis represents the different samples, the vertical axis represents the genes and the white to black represents the genes expression changed; the deeper the color, the high the expression levels. DEGs: differentially expressed genes.
Functional enrichment analysis of the DEGs
To explore potential function and pathways for these DEGs, GO functional and KEGG pathway enrichment of both up- and down-regulated DEGs were analyzed. The up-regulated DEGs were mainly enriched in functional or pathway categories such as “translation (e.g., RPS27A and RPLP0)”, “translational elongation (e.g., RPS27A and RPLP0)”, ‘ribosome (e.g., RPS27A)’, ‘ribonucleoprotein complex (e.g., RPS27A)’, ‘structural constituent of ribosome (e.g., RPS27A)’, ‘Parkinson’s disease (e.g., NDUFB3)’ and ‘oxidative phosphorylation (e.g., ATP5G3)’. The down-regulated genes were mainly enriched in ‘protein kinase activity (e.g., MAP3K12)’ ().
Table 1. Results of enrichment analysis of DEGs.
Analysis of PPI network
To determine the interaction relationship between the proteins expressed by these DEGs, a PPI network was constructed. A total of 216 nodes (20 down-regulated and 196 up-regulated) and 790 PPI pairs composed the PPI network (). Among them, there were 18 nodes with node degree greater than 20 and all of them (such as RPS27A and RPLP0) were up-regulated genes ().
Figure 2. The PPI network of DEGs. Round represents the upregulated DEG; quadrilateral represents down-regulated DEG and the line represents the interaction. DEG: differentially expressed gene.
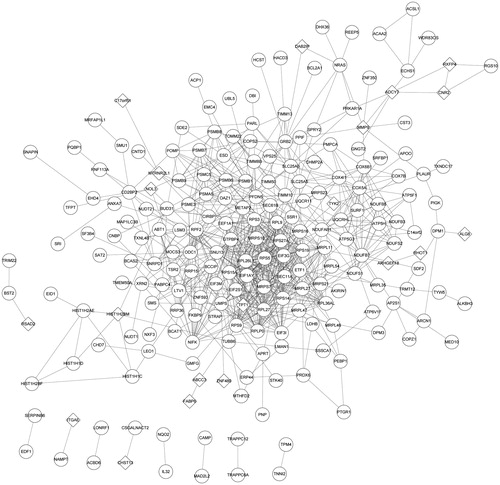
Table 2. Genes with node degree greater than 20 in PPI network.
Sub-network module mining
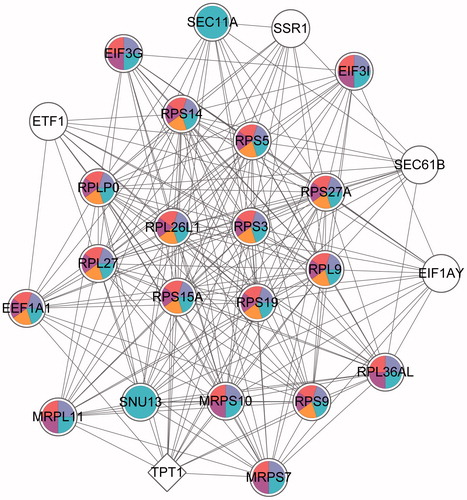
The sub-network of PPI network was discovered. According to the predefined criterion, 13 sub-network modules were obtained. Among them, the module with the highest score (19.167) contained 25 nodes and 230 edges (regulatory relationship). To understand the potential function of these sub-module DEGs, the GOlorize plug-in was used to analyze the correlation of GO terms with the highest-scoring module. The genes in the highest-scoring module were mainly enriched in the pathways associated with ‘translation and translational elongation’ (). Besides, the ‘translation’ was related to ‘translational elongation’. In order to understand the enrichment of genes in the highest-scoring module, we analyzed the enrichment of highest-scoring module genes in the top five GO terms (). It was found that 20 nodes enriched in ‘gene expression’ (e.g., RPS27A and RPLP0), 18 nodes enriched in ‘cellular macromolecule bio synthetic process genes’, ‘macromolecule biosynthetic process’ and ‘translation’ (e.g., RPS27A and RPLP0) and 12 nodes were enriched in ‘translational elongation’ (e.g., RPS27A and RPLP0), while only five of them were not enriched in any of them.
Figure 3. The GO correlation of highest score sub-modules. Gray nodes represent the significant GO terms and white nodes represent the non-significant GO terms. Node in a larger node size and a darker color represents a more significant GO term; arrows indicate relevancy of the two GO terms. GO: gene ontology.
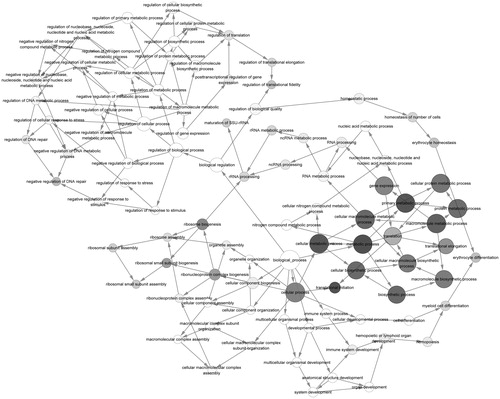
Figure 4. GO enrichment of the highest score sub-modules. Round nodes represent the upregulated genes; quadrilateral nodes represent down-regulated genes and the lines represent the interactions between the two nodes. White nodes represent these genes that are not significantly enriched in the pathway; the different colors are marked as specific GO classifications, blue: gene expression; purple: cellular macromolecule bio synthetic process; red: macromolecule biosynthetic process; rose red: translation and orange: translational elongation. GO: gene ontology (refer online version for color figure).
Prediction of miRNA regulated target genes relationship
Prediction of miRNAs was aimed to further understand which miRNAs regulate these DEGs. According to the preset conditions, two miRNAs were selected: hsa-miR-150 (p = .0073) and hsa-miR-134 (p = .0280). Hsa-miR-150 and hsa-miR-134 were predicted to regulate five genes (ERP44, ETF1, DHX36, ZMYM5 and PRKAR1A) and three DEGs (ETF1, ACSL1 and SLC25A5), respectively ().
Figure 5. MiRNA-TF-DEGs regulatory network. The triangle nodes represent the up-regulated TFs; the quadrilateral nodes represent the down-regulated TFs; the arrow is the regulation relation; the circle nodes represent the target genesand diamond is the miRNA. DEG: differentially expressed gene; TF: transcription factor.
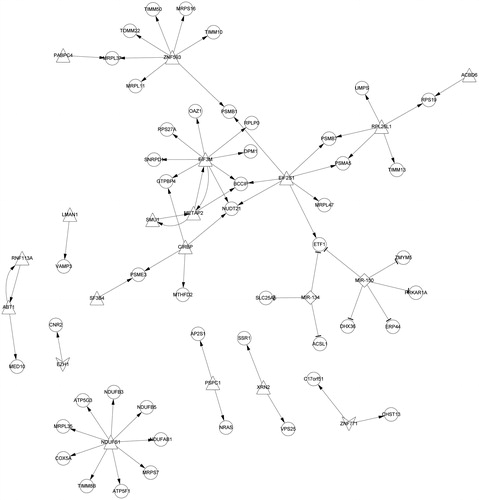
Prediction of TFs
TFs play an important role in the regulation of gene expression, so the TFs that regulated DEGs were also predicted. A total of 16 (e.g., EIF3M, METAP2 and SMU1) and two (EZH1 and ZNF771) TFs were predicted to regulate the up-regulated genes and down-regulated DEGs, respectively. For example, NDUFS1 regulated nine DEGs (e.g., ATP5G3); EIF3M regulated eight DEGs (e.g., BCCIP and NUDT21); seven DEGs (e.g., PSMB1) regulated by ZNF593 ().
Discussion
Our study explored the DEGs of monocytes isolated from control and DN which were co-cultured with and without MSCs and predicted the miRNAs and TFs which targeted these DEGs. Totally, 303 up-regulated and 88 down-regulated DEGs shared in group 3 vs. group 1 and group 4 vs. group 2. Beside, RPS27A (ribosomal protein S27a) and RPLP0 (ribosomal protein lateral stalk subunit P0) had a higher degree in the PPI network and they were regulated by EIF3M (eukaryotic translation initiation factor 3 subunit M). In addition, ETF1 (eukaryotic translation termination factor 1) was predicted to be an important gene, which was regulated by miR-150, miR-134 and EIF2S1 (eukaryotic translation initiation factor 2 subunit alpha).
MSCs promote the proliferation of monocytes, which contribute to the repair of macrophages on renal fibrosis [Citation11]. DN causes renal fibrosis and ultimately lead to decreased renal function [Citation5]. The increased numbers of circulating monocytes in type 2 diabetes mellitus display pro-inflammatory properties and promote the secretion of pro-inflammatory cytokines [Citation9]. It has been reported that MSCs display a more pronounced immunomodulatory effects in an inflammatory environment than steady-state, whereby the immunosuppressive properties of MSCs are caused by inflammatory stimuli [Citation28,Citation29]. Furthermore, RPS27A regulates cells cycle arrest through p53, Raf/MEK/ERK, P21 and BCL-2 signaling pathways, promotes cell proliferation and inhibits cell apoptosis [Citation30]. This was consistent with our results that the expression of RPS27A which was targeted by EIF3M in monocytes was up-regulated after MSCs co-cultured. EIF3M binds to tumor-associated genes in human colon cancer cell lines, which in turn affects cell proliferation, cell cycleand cell apoptosis [Citation31]. RPLP0 which is an integral part of the ribosomal 60 S subunit was also regulated by EIF3M. In gastric cancer, RPLP0 deficiency can suppress cells growth and cells cycle by down-regulating CDK2 [Citation32]. RPLP0 also affects the expression of p21 and has anti-apoptotic effect on gastric cancer [Citation32]. However, the role of EIF3M and RPLP0 in DN remains unclear. The cell numbers of monocytes isolated from control and DN subjects were less than that of cultured with MSCs [Citation11]. Taken together, we suggested that RPS27A and RPLP0 may be the key genes in MSCs treatment for DN mononuclear cells. During this process, EIF3M may interact with RPS27A and RPLP0 to regulate their expression and promote cell proliferation.
MiRNAs, a small non-coding RNA of about 19–26 nt, play an important role in cell proliferation, apoptosis, cell differentiation and tumorigenesis [Citation33]. MiRNAs affect renal fibrosis in kidney disease, among which miR-150 promotes renal fibrosis through down-regulating SOCS1 [Citation34]. MiR-150 is a biomarker of renal injury in lupus nephritis [Citation34]. In this study, hsa-miR-150 was predicted to target DEGs, such as ETF1, which interacted with RPS27A and RPLP0. Additionally, hsa-miR-134 was also predicted to regulate ETF1. MiR-134 affects the cell adhesion of MSCs by mediating the expression of β1 integrin [Citation35] and inhibits cell proliferation via targeting KRAS in human renal cell carcinoma cells [Citation36]. In conclusion, miR-150 and miR-134 were predicted to be the important miRNAs in the treatment of MSCs for DN. They may regulate the expression of RPS27A and RPLP0 by interacting with ETF1 and thereby promote the proliferation of monocytes in the process.
Andrea et al. [Citation11] have found that, the numbers of up-regulated and down-regulated DEGs shared by group 3 vs. group 1 and group 4 vs. group 2 were 212 and 112 , respectively which was different from our results. The difference may be caused by that in their study, the normalization of data are conducted by bio-conductor packages in R, while we used Affy package of R software to normalize the chip data in the present study. In addition, in order to screen more DEGs, the threshold value of p values < .05 was applied, whereas the thresholds for screening DEGs in their study were set as |log2 fold change| ≥ 0.75 and the false discovery rate of revised p values ≤ .05.
In short, RPS27A, RPLP0 and ETF1 may be the potential target gene for the treatment of MSCs in DN, which provide a theoretical basis for the investigation of MSCs in the treatment of DN. However, these results were not validated via experiment and their specific pathways of regulation were not been studied, so future studies can focus on the research of specific pathways via experiment.
Disclosure statement
The authors declare that they have no conflict of interest.
References
- Atkins RC, Zimmet P. Diabetic kidney disease: act now or pay later. Nephrol. Dial. Transplant. 2009;12:2–5.
- Sanchez AP, Sharma K. Transcription factors in the pathogenesis of diabetic nephropathy. Expert Rev Mol Med. 2009;11:e13.
- Lei L, Mao Y, Meng D, et al. Percentage of circulating CD8+ T lymphocytes is associated with albuminuria in type 2 diabetes mellitus. Exp Clin Endocrinol Diabetes. 2014;122:27–30.
- Lane PH, Steffes MW, Fioretto P, et al. Renal interstitial expansion in insulin-dependent diabetes mellitus. Kidney Int. 1993;43:661–667.
- Ritz E, Wolf G. Comprehensive clinical nephrology: pathogenesis, clinical manifestations, and natural history of diabetic nephropathy. Netherlands: Elsevier Medicine; 2010.
- Duran-Salgado MB, Rubio-Guerra AF. Diabetic nephropathy and inflammation. World J Diabetes. 2014;5:393–398.
- Nguyen D, Ping F, Mu W, et al. Macrophage accumulation in human progressive diabetic nephropathy. Nephrology. 2006;11:226–231.
- Katz S, Klein B, Elian I, et al. Phagocytotic activity of monocytes from diabetic patients. Diabetes Care. 1983;6:479–482.
- Yang M, Gan H, Shen Q, et al. Proinflammatory CD14 + CD16+ monocytes are associated with microinflammation in patients with type 2 diabetes mellitus and diabetic nephropathy uremia. Inflammation. 2012;35:388–396.
- Yang M, Gan H, Shen Q. [Effect of LPS on the level of TLR4 and on the expression of NF-kappaB and Notch1 in monocytes from patients with type 2 diabetic nephropathy]. Zhong Nan Da Xue Xue Bao Yi Xue Ban. 2012;37:578–585.
- Wise AF, Williams TM, Rudd S, et al. Human mesenchymal stem cells alter the gene profile of monocytes from patients with Type 2 diabetes and end-stage renal disease. Regen Med. 2016;11:145–158.
- Hof-Nahor I, Leshansky L, Shivtiel S, et al. Human mesenchymal stem cells shift CD8+ T cells towards a suppressive phenotype by inducing tolerogenic monocytes. J Cell Sci. 2012;125:4640–4650.
- Samarani G, Song Y, Krasnodembskaya A, et al. Mesenchymal stem cells therapy reduces bacteremia and enhances the phagocytic activity of circulating monocytes in a mouse model of gram negative sepsis. Paper presented at: American Thoracic Society 2011 International Conference; 2011 May 13–18; Denver, Colorado.
- Jiang XX, Zhang Y, Liu B, et al. Human mesenchymal stem cells inhibit differentiation and function of monocyte-derived dendritic cells. Blood. 2005; 105:4120–4126.
- Lv SS, Liu G, Wang JP, et al. Mesenchymal stem cells transplantation ameliorates glomerular injury in streptozotocin-induced diabetic nephropathy in rats via inhibiting macrophage infiltration. Int Immunopharmacol. 2013;17:275.
- Irizarry RA, Hobbs B, Collin F, et al. Exploration, normalization, and summaries of high density oligonucleotide array probe level data. Biostatistics. 2003;4:249–264.
- Diboun I, Wernisch L, Orengo CA, et al. Microarray analysis after RNA amplification can detect pronounced differences in gene expression using limma. BMC Genomics. 2006;7:1–14.
- Ashburner M, Ball CA, Blake JA, et al. Gene ontology: tool for the unification of biology. The Gene Ontology Consortium. Nat Genet. 2000;25:25–29.
- Kanehisa M, Goto S. KEGG: Kyoto encyclopedia of genes and genomes. Nucleic Acids Res. 2000;28:27–30.
- Huang DW, Sherman BT, Lempicki RA. Systematic and integrative analysis of large gene lists using DAVID bioinformatics resources. Nat Protoc. 2008;4:44–57.
- Mering CV, Huynen M, Jaeggi D, et al. STRING: a database of predicted functional associations between proteins. Nucleic Acids Res. 2003;31:258–261.
- Tang Y, Li M, Wang J, et al. CytoNCA: a cytoscape plugin for centrality analysis and evaluation of protein interaction networks. Biosystems. 2015;127:67–72.
- He X, Zhang J. Why do hubs tend to be essential in protein networks? Plos Genet. 2006;2:826–834.
- Bader GD, Hogue CW. An automated method for finding molecular complexes in large protein interaction networks. BMC Bioinformatics. 2003;4:2.
- Garcia O, Saveanu C, Cline M, et al. GOlorize: a Cytoscape plug-in for network visualization with Gene Ontology-based layout and coloring. Bioinformatics. 2007;23:394–396.
- Zhang B, Kirov S, Snoddy J. WebGestalt: an integrated system for exploring gene sets in various biological contexts. Nucleic Acids Res. 2005;33:741–748.
- Benjamini Y, Hochberg Y. Controlling the false discovery rate: a practical and powerful approach to multiple testing. J R Stat Soc Series B Stat Methodol. 1995;57:289–300.
- Sheng H, Wang Y, Jin Y, et al. A critical role of IFNgamma in priming MSC-mediated suppression of T cell proliferation through up-regulation of B7-H1. Cell Res. 2008;18:846–857.
- Ryan JM, Barry F, Murphy JM, et al. Interferon-gamma does not break, but promotes the immunosuppressive capacity of adult human mesenchymal stem cells. Clin Exp Immunol. 2007;149:353–363.
- Wang H, Yu J, Zhang L, et al. RPS27a promotes proliferation, regulates cell cycle progression and inhibits apoptosis of leukemia cells. Biochem Biophys Res Commun. 2014;446:1204–1210.
- Goh SH, Hong SH, Hong SH, et al. eIF3m expression influences the regulation of tumorigenesis-related genes in human colon cancer. Oncogene. 2011;30:398–409.
- Teller A, Jechorek D, Hartig R, et al. Dysregulation of apoptotic signaling pathways by interaction of RPLP0 and cathepsin X/Z in gastric cancer. Pathol Res Pract. 2015;211:62–70.
- Meng F, Henson R, Lang M, et al. Involvement of human micro-RNA in growth and response to chemotherapy in human cholangiocarcinoma cell lines. Gastroenterology. 2006;130:2113–2129.
- Zhou H, Hasni SA, Perez P, et al. miR-150 promotes renal fibrosis in lupus nephritis by downregulating SOCS1. J Am Soc Nephrol. 2013;24:1073–1087.
- Poitz DM, Stolzel F, Arabanian L, et al. MiR-134-mediated beta1 integrin expression and function in mesenchymal stem cells. Biochim Biophys Acta. 2013;1833:3396–3404.
- Liu Y, Zhang M, Qian J, et al. miR-134 functions as a tumor suppressor in cell proliferation and epithelial-to-mesenchymal transition by targeting kras in renal cell carcinoma cells. DNA Cell Biol. 2015;34:429–436.