
 ?Mathematical formulae have been encoded as MathML and are displayed in this HTML version using MathJax in order to improve their display. Uncheck the box to turn MathJax off. This feature requires Javascript. Click on a formula to zoom.
Abstract
Introduction: To investigate the validity of the full age spectrum (FAS) equation in determining the glomerular filtration rate (GFR) in Chinese patients with chronic kidney disease (CKD) and to compare the performance of FAS equation and the technetium-99m-diethylene triamine pentaacetic acid (Tc-99m-DTPA) renal dynamic imaging method.
Methods: The GFR was determined by three methods in the same day: (a) Tc-99m-DTPA dual plasma sample clearance method (mGFR); (b) FAS equation (eGFR1); (c) Tc-99m-DTPA renal dynamic imaging method (eGFR2). The mGFR was used as the reference standard. The Bland–Altman method, concordance correlation coefficient and regression equation were applied to evaluate the validity of the estimated glomerular filtration rate (eGFR). The bias, precision and accuracy were analyzed to compare the performances of eGFR1 and eGFR2.
Results: A total of 162 subjects were enrolled in this study. The eGFR1 was correlated well with mGFR (concordance correlation coefficient was 0.896, p < 0.0001) and the regression equation was mGFR = –0.374 + 1.029eGFR1 (p < 0001). The Bland–Altman analysis proved good agreement between the eGFR1 and mGFR. In comparison with eGFR2, the eGFR1 showed better performance on bias (–1.22 vs. 8.92, p < 0001), precision (15.69 vs. 18.36, p = 0.047) and 30% accuracy (75.31% vs. 59.26%, p = 0.0009) in all participants.
Conclusions: The FAS equation is valid in determining the glomerular filtration rate in Chinese patients with chronic kidney disease. The Tc-99m-DTPA renal dynamic imaging method is less accurate than the FAS equation and cannot be employed as the reference method in assessing the performance of FAS equation.
Introduction
Chronic kidney disease (CKD) is a worldwide problem, and the overall prevalence of CKD in China is 10.8% [Citation1]. It severely impairs patients’ quality of life and leads to significant CKD-related mortality rate [Citation2–4]. Glomerular filtration rate (GFR) is the most important and accurate parameter of kidney function in the course of CKD [Citation5–6]. Accurate measure of GFR quantitates the degree of renal dysfunction. Inulin is not protein-bound, not metabolizable, freely filtered, not reabsorbed, not secreted, so the inulin clearance rate is the gold standard for determining GFR. However, this method cannot be applied routinely because of the inconvenience. Several available methods have been developed to estimate GFR in a simpler manner and at low costs [Citation7–16].
The Chronic Kidney Disease Epidemiology Collaboration (CKD-EPI) equation is widely used to evaluate the GFR with higher accuracy and simpler operating procedure [Citation17–21]. However, this equation is not accurate for the full age spectrum. In 2016, the new equation, full age spectrum (FAS) equation, based on the serum creatinine, was developed and can be applicable to all ages [Citation10]. Chai assessed the performance of FAS equation in the subjects with CKD and indicated that the FAS equation was more accurate and less bias and improved precision than others equations [Citation22]. However, in that study the reference method to determine GFR was 99mTc-diethylene triamine pentaacetic acid (Tc-99m-DTPA) renal dynamic imaging method which was not accurate and could be affected by various factors [Citation23–26]. In this study, we described the implementation of a paired cohort study to validate the applicability of the new FAS equation in determining GFR in Chinese patients with CKD and compare its performance with the Tc-99m-DTPA renal dynamic imaging method and the Tc-99m-DTPA dual plasma sample clearance method [Citation27]. We hypothesize that the FAS equation could be applied to approximate the GFR in Chinese patients with CKD.
Methods
Ethics statement
The study protocol was approved by Hebei Medical University ethical committee (No. 2017-027-1), and the written informed consent was obtained from each participant.
Patients
All the enrolled participants met the diagnostic standard for CKD [Citation28]. The inclusion and exclusion criteria were described elsewhere [Citation23].
The GFR measurement by dual plasma sample clearance method (mGFR)
The GFR (mGFR) determined by Tc-99m-DTPA dual plasma sample clearance method was described previously [Citation23], which was calculated from a single exponential formula derived from the blood samples between 2 and 4 h after injection. The mGFR was used as the reference method.
GFR measurement by FAS equation (eGFR1)
The serum creatinine (Scr) was automatically measured by the enzymatic IDMS-traceable method using a biochemical analyzer (VITROS 5.1, Johnson Company, USA; reagents from the same company).
The FAS equation was as follows [Citation10]:
For 2 ≦ age ≦ 40 years
For age >40 years
Q values are the mean or median SCr value for age-/sex-specific healthy populations, listed in the publication [Citation10]. The units of Scr and age are mg/dL and year, respectively.
GFR measurement by the renal dynamic imaging method (eGFR2)
GFR determination by the Tc-99m-DTPA renal dynamic imaging method (eGFR2) was described in our previous study [Citation23], which was estimated automatically with the program of the Single Photon Emission Computed Tomography after sketching the region of interesting. The radiotracer and the Single Photon Emission Computed Tomography used were both the same as those in that study.
The normalization of mGFR and eGFR2
The mGFR and eGFR2 were normalized for a body surface area of 1.73 m2 according to Haycock’s equation [Citation29].
Statistical analysis
All the statistical analysis was performed with SPSS, version 19.0 (SPSS Inc., Chicago, IL, USA) and Medcale (version 15.2.2 Medcale software, Mariekerke, Belgium). Significance level was set at p < 05.
Based on the skewed distribution by the scatter plot, the relationship between eGFR1 and mGFR was assessed with the Spearman correlation and linear regression method. The Bland–Altman method was applied to evaluate the degree of agreement between eGFR1 and mGFR.
The parameters of bias, precision, and accuracy were employed to compare the performance of the eGFR1 and eGFR2. Bias was defined as eGFR minus mGFR. Precision was defined as the standard deviation of the bias. Accuracy was defined as P30, the percentage of GFR (eGFR) values within 30% deviation of the mGFR. Paired T test, F test and McNemar’s test were used to compare the bias, precision and accuracy respectively.
Results
The characteristics of the participants
The demographic and biochemical characteristics of all the 162 participants were shown in .
Table 1. The characteristics of all the patients.
There were 84 females and 78 males with a mean age of 56.04 ± 15.39 years in this study. The main etiologies of CKD were chronic glomerulonephritis (52 cases, 32.1%), diabetic kidney disease (36 cases, 22.22%), chronic pyelonephritis (30 cases, 18.51%) and hypertensive nephropathy (21 cases, 12.96%). The average mGFR was 55.81 ± 35.31 (ranging from 3.54 to 176.29) mL min−1 1.73 m−2. According to the mGFR values, the patients were divided into five CKD stages in accordance with the K/DOQI guidelines: 33 cases (20.37%) in stage 1, 36 cases (22.22%) in stage 2, 44 cases (27.16%) in stage 3, 30 cases (18.52%) in stage 4, and 19 cases (11.73%) in stage 5.
The validation of FSA equation
The average eGFR1 was 54.59 ± 30.74 (ranging from 4.69 to 141.54) mL min−1 1.73 m−2. There was no significant difference between eGFR1 and mGFR (t = –0.987, p = 0.325). The FAS equation was correlated well with mGFR, and the correlation coefficient of eGFR1 was 0.8962. The scatter plot showed linear correlation relationship between eGFR1 and mGFR (. The linear regression was therefore constructed and the regression equation was mGFR = –0.374 + 1.029eGFR1 (p < 0.0001). The Bland–Altman plots of eGFR1 against mGFR were shown in . The 95% limit of agreement for the formulas was –32 to 29.5 mL min−1 1.73 m−2. The characteristics of the 10 patients that lie outside of the 95% confidence intervals were listed in . The patients with obesity (higher BMI) were more likely to lie outside of the 95% confidence intervals. The BMI of the 10 patients was higer than of the other 152 patients (26.72 ± 6.73 kg/m2 vs. 23.67 ± 17.23 kg/m2, t = 2.024, p = 0.045).
Figure 1. Scatter plots of eGFR1 versus mGFR. Abbreviations: mGFR: the GFR measured by the 99mTc-diethylene triamine pentaacetic acid dual plasma sample clearance method; eGFR1: the GFR estimated by the FAS equation.
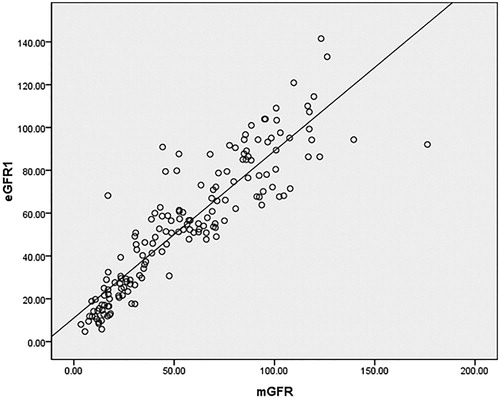
Figure 2. (A) Bland–Altman plot showing the disagreement between eGFR1 and mGFR. The blue line indicates the mean of difference and the red lines represent the 95% limits of agreement. (B) Bland–Altman plot showing the disagreement between eGFR2 and mGFR. The blue line indicates the mean of difference and the red lines represent the 95% limits of agreement. Abbreviations: mGFR: the GFR measured by the 99mTc-diethylene triamine pentaacetic acid dual plasma sample clearance method; eGFR1: the GFR estimated by the FAS equation; eGFR2: the GFR estimated by the Tc-99m-DTPA renal dynamic imaging method.
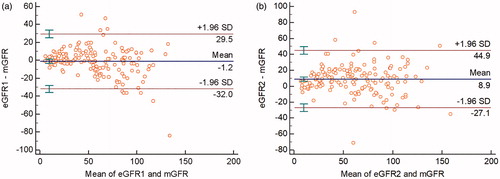
Table 2. The characteristics of the 10 patients that lie outside of the 95% confidence intervals.
The comparison between eGFR1 and eGFR2
The performance of the FAS equation compared with Tc-99m-DTPA renal dynamic imaging method is summarized in . The bias of eGFR1 and eGFR2 was –1.22 and 8.92 mL min−1 1.73 m−2, respectively, and the difference was significant (t = 6.352, p < 0001). The precision of eGFR1 was 15.69 mL min−1 1.73 m−2, which was superior to 18.36 mL min−1 1.73 m−2 of eGFR2 (F = 1.3693, p = 0.047). The percentage of P30 of the FAS equation was significantly higher than that of Tc-99m-DTPA renal dynamic imaging method (75.31 vs. 59.26%, p = 0.0009). Bland–Altman demonstrated that eGFR1 agreed with mGFR more than eGFR2 agreed with mGFR: 95% confidence intervals for eGFR1–mGFR (61.5) is “tighter” than the 95% confidence intervals for eGFR2–mGFR (72.0) (.
Table 3. The comparison between eGFR1 and eGFR2.
Discussion
Several methods have been developed to estimate the glomerular filtration rate because it cannot be directly determined. In 2016 a new equation based on the level of SCr was developed, named FAS equation, which was applicable to the full age-spectrum [Citation10]. In the study, 14 different datasets, covering 735 children adolescents, 4371 adults and 1764 older adults, were obtained to validate the FAS equation. The validation study revealed that the FAS equation improved validity and continuity across the full age-spectrum and that it could be a reliable alternative [Citation10]. However, it requires more studies to verify whether the new equation is suitable in Chinese patients with CKD because all the datasets were from Europe and the USA. In the present study, the GFR calculated by FAS equation was correlated well to the GFR determined by the dual plasma sample clearance method. We showed that the FAS equation was suitable to determine the GFR in Chinese patients with CKD.
Tc-99m DTPA renal dynamic scintigraphy is widely used to evaluate the renal function because of its simplicity and accuracy. In practice, when impaired renal function is suspected due to various reasons, particularly for the patients with asymmetrical renal dysfunction, renal dynamic imaging is required to assess the split renal function and estimate the single-kidney glomerular filtration rate (GFR). However, the GFR calculated with the Tc-99m-DTPA renal dynamic imaging method might be inaccurate because of the depth and position of the kidney, the selection of region of interest of the background, the presence of tumor of the kidney, the dosage of radiopharmaceutical and the motion artifacts [Citation30–32]. Therefore, the Tc-99m-DTPA renal dynamic imaging method is not suitable to be employed as the reference standard because of its unsatisfactory performance [Citation23,Citation33]. Chai et al. assessed the performance of FAS equation in Chinese subjects with CKD [Citation22]. However, in the study the reference method was the Tc-99m-DTPA renal dynamic imaging method, which might compromise the reliability of the conclusions. In the present study, the Tc-99m-DTPA dual plasma sample clearance method was employed as the reference method, which was more accurate and had been used as the gold standard in several studies [Citation17,Citation23,Citation33,Citation34]. In our study, by comparing the FAS equation with the Tc-99m-DTPA renal dynamic imaging method, we showed that the latter one had worse performance than the former one. The present study revealed that the renal dynamic imaging method could not be employed as the reference method in assessing the performance of FAS equation.
Our future studies will be focused on the following aspects to bring the applicability of our findings to an even higher level. First, we will increase the sample size and take into account different disease stages and patients’ age span in our data analysis. Furthermore, in addition to CKD patients, our future work will also target the validation of the FAS equation in general Chinese population.
In conclusion, the FAS equation is an effective method to determine the GFR of Chinese patients with CKD. The Tc-99m-DTPA renal dynamic imaging method is less accurate than the FAS equation and cannot be employed as the reference method in assessing the performance of FAS equation.
Disclosure statement
No potential conflict of interest was reported by the authors.
Additional information
Funding
References
- Kim NH, Hyun YY, Lee KB, et al. Environmental heavy metal exposure and chronic kidney disease in the general population. J Korean Med Sci. 2015;30:272–277.
- Kaze FF, Meto DT, Halle MP, et al. Prevalence and determinants of chronic kidney disease in rural and urban Cameroonians: a cross-sectional study. BMC Nephrol. 2015;16:117.
- Jessani S, Bux R, Jafar TH. Prevalence, determinants, and management of chronic kidney disease in Karachi, Pakistan: a community based cross-sectional study. BMC Nephrol. 2014;15:90.
- Zhang L, Wang F, Wang L, et al. Prevalence of chronic kidney disease in China: a cross-sectional survey. Lancet. 2012;379:815–822.
- Lopez-Giacoman S, Madero M. Biomarkers in chronic kidney disease, from kidney function to kidney damage. World J Nephrol. 2015;4:57–73.
- Lujambio I, Sottolano M, Luzardo L, et al. Estimation of glomerular filtration rate based on serum cystatin C versus creatinine in a Uruguayan population. Int J Nephrol. 2014;837106.
- Funakoshi Y, Fujiwara Y, Kiyota N, et al. Prediction of glomerular filtration rate in cancer patients by an equation for Japanese estimated glomerular filtration rate. Jpn J Clin Oncol. 2013;43:271–277.
- Cockcroft DW, Gault MH. Prediction of creatinine clearance from serum creatinine. Nephron. 1976;16:31–41.
- Gates GF. Glomerular filtration rate: estimation from fractional renal accumulation of 99mTc-DTPA (stannous). Am J Roentgenol. 1982;138:565–570.
- Pottel H, Hoste L, Dubourg L, et al. An estimated glomerular filtration rate equation for the full age spectrum. Nephrol Dial Transplant. 2016;31:798–806.
- Levey AS, Bosch JP, Lewis JB, Modification of Diet in Renal Disease Study Group, et al. A more accurate method to estimate glomerular filtration rate from serum creatinine: a new prediction equation. Ann Intern Med. 1999;130:461–470.
- Liu X, Gan X, Chen J, et al. A new modified CKD-EPI equation for Chinese patients with type 2 diabetes. PLoS One. 2014;9:e109743.
- Levey AS, Stevens LA, Schmid CH, CKD-EPI (Chronic Kidney Disease Epidemiology Collaboration), et al. A new equation to estimate glomerular filtration rate. Ann Intern Med. 2009;150:604–612.
- Larsson A, Malm J, Grubb A, et al. Calculation of glomerular filtration rate expressed in mL/min from plasma cystatin C values in mg/L. Scand J Clin Lab Invest. 2004;64:25–30.
- Grubb A, Nyman U, Björk J, et al. Simple cystatin C-based prediction equations for glomerular filtration rate compared with the modification of diet in renal disease prediction equation for adults and the Schwartz and the Counahan–Barratt prediction equations for children. Clin Chem. 2005;51:1420–1431.
- Hari P, Ramakrishnan L, Gupta R, et al. Cystatin C-based glomerular filtration rate estimating equations in early chronic kidney disease. Indian Pediatr. 2014;51:273–277.
- Xie P, Huang JM, Lin HY, et al. CKD-EPI equation may be the most proper formula based on creatinine in determining glomerular filtration rate in Chinese patients with chronic kidney disease. Int Urol Nephrol. 2013;45:1057–1064.
- Pei XH, He J, Liu Q, et al. Evaluation of serum creatinine- and cystatin C-based equations for the estimation of glomerular filtration rate in a Chinese population. Scand J Urol Nephrol. 2012;46:223–231.
- Kilbride HS, Stevens PE, Eaglestone G, et al. Accuracy of the MDRD (Modification of Diet in Renal Disease) study and CKD-EPI (CKD Epidemiology Collaboration) equations for estimation of GFR in the elderly. Am J Kidney Dis. 2013;61:57–66.
- Tarantini L, Barbati G, Cioffi G, et al. Clinical implications of the CKD epidemiology collaboration (CKD-EPI) equation compared with the modification of diet in renal disease (MDRD) study equation for the estimation of renal dysfunction in patients with cardiovascular disease. Intern Emerg Med. 2015;10:955–963.
- Hebert SA, Molony DA. ACP Journal Club: the CKD-EPI equation for eGFR predicted adverse outcomes after PCI better than other equations. Ann Intern Med. 2015;163:JC12.
- Chai L, Wang M, Cai K, et al. Full age spectrum equation may be an alternative method to estimate the glomerular filtrationrate in Chinese patients with chronic kidney disease. Clin Nephrol. 2018; 89:413–421.
- Xie P, Huang J-M, Liu X-M, et al. 99mTc-DTPA renal dynamic imaging method may be unsuitable to be used as the reference method in investigating the validity of CKD-EPI equation for determining glomerular filtration rate. PLoS One. 2013;8:e62328.
- Dopuda M, Ajdinović B, Jauković L, et al. [Influence of the background activity region selection on the measurement of glomerular filtration rate using the Gates method]. Vojnosanit Pregl. 2008;65:729–732.
- Assadi M, Eftekhari M, Hozhabrosadati M, et al. Comparison of methods for determination of glomerular filtration rate: low and high-dose Tc-99m-DTPA renography, predicted creatinine clearance method, and plasma sample method. Int Urol Nephrol. 2008;40:1059–1065.
- Ma YC, Zuo L, Zhang CL, et al. Comparison of 99mTc-DTPA renal dynamic imaging with modified MDRD equation for glomerular filtration rate estimation in Chinese patients in different stages of chronic kidney disease. Nephrol Dial Transplant. 2007;22:417–423.
- Blaufox MD, Aurell M, Bubeck B, et al. Report of the radionuclides in nephrourology committee on renal clearance. J Nucl Med. 1996;37:1883–1890.
- Eknoyan G, Levin N. NKF-K/DOQI clinical practice guidelines: update 2000. Foreword. Am J Kidney Dis. 2001;37:S5–S6.
- Haycock GB, Schwartz GJ, Wisotsky DH. Geometric method for measuring body surface area: a height-weight formula validated in infants, children and adults. J Pediatrics. 1978;93:62–66.
- Inoue Y, Yoshikawa K, Suzuki T, et al. Attenuation correction in evaluating renal function in children and adults by a camera-based method. J Nucl Med. 2000;41:823–829.
- Takaki Y, Kojima A, Tsuji A, et al. Quantification of renal uptake of technetium-99m-DTPA using planar scintigraphy: a technique that considers organ volume. J Nucl Med. 1993;34:1184–1189.
- Peters AM, Gordon I, Evans K, et al. Background in the 99mTc DTPA renogram: analysis of intravascular and extravascular components. Am J Physiol Imaging. 1987;2:67–71.
- Huang Q, Chen Y, Zhang M, et al. Comparative evaluation of technetium-99m-diethylenetriaminepentaacetic acid renal dynamic imaging versus the Modification of Diet in Renal Disease equation and the Chronic Kidney Disease Epidemiology Collaboration equation for the estimation of GFR. Int Urol Nephrol. 2018;50:733–743.
- Yuan X, Zhang J, Tang K, et al. Determination of glomerular filtration rate with ct measurement of renal clearance of iodinated contrast material versus 99mTc-DTPA dynamic imaging "gates" method: a validation study in asymmetrical renal disease. Radiology. 2017;282:552–560.