
Abstract
Background
Cardiovascular events are the primary cause of death for chronic kidney disease patients, which occurred via vascular calcification evolving pathogenically. Although a high level of phosphorus contributes to the induction of osteogenic differentiation of vascular smooth muscle cells (VSMCs), the role of lncRNA in this process awaits further study.
Methods
In this study, we systematically investigated the variation of gene expression in human VSMCs induced by high phosphorus. LncRNAs and mRNAs expression were revealed by microarray analyses of the control group and high-phosphorus (HP) group. LncRNA-mRNA co-expression network was established based on the specific lncRNA-mRNA relationships. Hierarchical clustering was used to identify a common set of regulated genes. In addition, Gene Ontology enrichment, Kyoto Gene-Encyclopedia and genomic analyses were conducted for the mRNAs differentially expressed under high phosphorus.
Result
RT-qPCR results confirmed that the expression of RUNX2, BMP2 and osteocalcin in HP group exhibited significant increases than in control group (p < .05). VSMC in HP group also showed higher intracellular calcium content. Volcano plots results show that 379 mRNAs and 728 lncRNAs different expressed in HP group. LncRNA-mRNA co-expression networks analysis revealed that 8 lncRNAs were the most highly connected lncRNAs. Quantitative analysis indicated that two lncRNAs were confirmed to increase significantly in the HP group. The mRNA expression of NT5E and ICAM1 were higher in group HP, while MAP3K7CL was lower than CON group (p < .05).
Conclusion
This study provided a working list of lncRNAs that may be relevant to osteogenic differentiation, which presents a new insights into the mechanism of vascular calcification induced by high phosphorus in VSMCs.
Introduction
Cardiovascular mortality increases in parallel with the progression of chronic kidney disease (CKD) and ensuing renal loss, which has been identified as the pivotal cause of death for patients with end-stage renal disease [Citation1]. Vascular calcification, a factor independently associated with cardiovascular death in patients with CKD, is also common in such patients. Vascular calcification is a biological process that involves multiple factors, such as apoptosis, oxidative stress and extracellular vesicles, which can be regulated via various mechanisms [Citation2–4]. Commonly witnessed in patients with impaired renal function, hyperphosphatemia is believed to be associated with vascular calcification [Citation2,Citation5], which increases risks of cardiovascular events and death [Citation6]. Other studies have suggested that hyperphosphatemia is the key determinant of vascular calcification in CKD [Citation7,Citation8].
Vascular smooth muscle cells (VSMCs) play a key role in the pathogenesis of vascular calcification; they markedly promote mineralization via bone and cartilage phenotypic heterotopic pathways. Complex interactions between different intracellular signaling cascades control the phosphate-induced osteochondrogenic transdifferentiation of VSMCs [Citation9]. However, the specific molecular mechanism behind this is yet to be clarified.
Long noncoding RNAs (lncRNAs) are transcription products of more than 200 nucleotides in length confining potential coding functions. In recent years, it has been gradually recognized that lncRNAs are novel regulatory factors active in many biological and pathological processes. Accumulating studies have also indicated that lncRNAs are involved in the process of osteogenic differentiation. A growing number of lncRNAs, including imprinted maternally expressed transcript (H19) [Citation10], differentiation antagonizing non-protein-coding RNA (DANCR) [Citation11], metastasis-associated lung adenocarcinoma transcript 1 (MAlAT1) [Citation12], maternally expressed 3 (MEG3) [Citation13] and HOX transcript antisense RNA (HOTAIR) [Citation14], have been identified as key factors during the regulation of osteogenic markers, thus activating pathways in osteogenic differentiation, such as the Wnt/β-catenin signaling pathway [Citation15].
Most lncRNA-related studies we have mentioned above focused on mesenchymal stem cells. There has been limited research concerning whether lncRNAs are involved in the osteogenic transdifferentiation of VSMCs induced by high phosphorus (HP). This study was thus established to screen differentially expressed lncRNAs associated with normal VSMCs and HP-stimulated VSMCs.
Materials and methods
Cell culture and induction of calcification
Human aortic smooth muscle cells (HA-VSMCs) was purchased from ScienCell (USA). An VSMC culture medium containing 10% fetal bovine serum, 1% penicillin-streptomycin and 1% growth supplement (ScienCell, USA) was cultured in incubators with 5% CO2 at 37 °C. Once cells had grown to 90% confluence in the Petri dish, 0.25% trypsin (Sigma, USA) was added for harvesting. The passage ratio was 1:3. HA-VSMCs from the fourth to sixth passage were used in subsequent experiments. The cells were cultured in Dulbecco’s Modified Eagle’s Medium (contained 2.5 mM Na2HPO4) for 7 days to induce calcification. The medium was replaced every other day.
Alizarin red S staining
HA-VSMCs were inoculated in a six-well plate and treated as described above. After the medium had been removed, the cells were washed twice with phosphate-buffered saline (PBS); then, 4% paraformaldehyde was added to each well and fixed at 4 °C for 30 min. After removing the paraformaldehyde, the cells were washed with 1× PBS three times. Each well was stained with 1% alizarin red S (pH = 4.2) for 10 min. After the alizarin red S dye had been absorbed, the cells were washed with PBS three to five times to remove excess dye. Photographs of the samples were taken under a digital microscope.
Quantification of intracellular calcium content
To measure intracellular calcium content, the methoxyphenolphthalein complexation ketone method (Sigma, USA) was used, following the manufacturer’s protocol. Briefly, two groups of cells were inoculated in a six-well plate. After culturing for 7 days, the cells were digested with trypsin, washed with PBS and disrupted by ultrasound. After centrifugation at 12,000 rpm for 15 min at 4 °C, the supernatant was used to determine the calcium concentration.
RNA isolation
Total RNA was extracted from HA-VSMCs using TRIzol reagent (Sigma, USA), under the manufacturer’s instructions. The yield of RNA was determined using a NanoDrop 2000 spectrophotometer (Thermo Scientific, USA) and its integrity was evaluated via agarose gel electrophoresis using staining with ethidium bromide. The OD260/OD280 ratio was qualified between 1.8 and 2.0.
Real-time quantitative RT-qPCR
Quantification was performed by quantitative reverse-transcription (RT) polymerase chain reaction (RT-qPCR). The isolated RNA was reverse-transcribed to cDNA using HiScript II Q RT SuperMix for qPCR (Vazyme, R223-01), following the manufacturer’s instructions. RT-qPCR was performed using the LightCycler® 480 II Real-time PCR Instrument (Roche, Switzerland). All PCR procedures involved initial denaturation at 95 °C for 10 min, followed by 40 cycles of 95 °C for 10 s and 60 °C for 30 s. Each sample was processed in triplicate for analysis. The primers used were as follows in .
Table 1. The reference gene for qPCR analysis of BMP2, RUNX2 and osteocalcin.
Microarray analysis of lncRNA and mRNA expression
The Agilent Human lncRNA Microarray V6 (4*180 K, Design ID: 084410) was adopted to analyze lncRNA expression. The procedure was performed based on the manufacturer’s standard protocols. Briefly, total RNA was transcribed to double-stranded cDNA, from which cRNA was then synthesized, followed by labeling with cyanine-3-cytidine triphosphate. The labeled cRNAs were hybridized onto the microarray. After washing, the arrays were scanned by Agilent Scanner G2505C (Agilent Technologies). The microarray analysis was carried out by OE Biotech (Shanghai, China).
Data analysis
Feature Extraction software (version 10.7.1.1, Agilent Technologies) was selected to analyze array images. GeneSpring (version 13.1, Agilent Technologies) was employed for basic analysis. Differentially expressed genes or lncRNAs were identified through fold change (FC) as well as the p-value calculated using the t-test. The thresholds for up- and downregulated genes were set at FC ≥ 2.0 and p-value ≤ .05. Gene Ontology (GO) enrichment and Kyoto Encyclopedia of Genes and Genomes (KEGG) pathway analyses were applied to determine the roles of the differentially expressed mRNAs. Hierarchical clustering was performed to display distinguishable genetic expression patterns among the samples.
Analysis of co-expression of lncRNAs and mRNAs
Pearson correlation coefficient (r) analysis was employed to evaluate the co-expression of differentially expressed lncRNAs and mRNAs. lncRNA expression was statistically correlated with mRNA (p-value ≤ .05 and r > 0.7). The overlap between the co-expressed mRNA group and their targeted transcription factors (TFs) was calculated based on a hypergeometric distribution. Cape network was created by lncRNA-TF-mRNA interactions (version 3.11; Cytoscape.org). GO enrichment and KEGG pathway analyses, based on a hypergeometric distribution, were employed in the analysis of the co-expression of lncRNAs and mRNAs.
Statistical analysis
All experimental data were presented as mean ± standard deviation and analyzed via GraphPad Prism 8.0 software (GraphPad Software, Inc., La Jolla, CA, USA). Significance was analyzed by unpaired Student’s t-test. The significance level was set at p < .05.
Results
High phosphate induced osteoblast differentiation and calcification in VSMCs
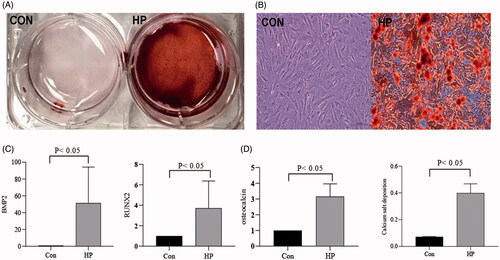
HA-VSMCs were divided into two groups: a normal control group (CON) and a high-phosphorus group (HP). In the HP group, the cells were cultured in medium containing 2.5 mM Na2HPO4 for 7 days. Alizarin red staining showed that high phosphorus induced calcium deposition of VSMCs (Figure 1(A-B)). RT-qPCR was used to assess the expression of osteogenic differentiated VSMC markers. In the HP group, it was confirmed that the expression of RUNX2, BMP2 and osteocalcin exhibited significant increases than the control group (p < .05) (). Furthermore, the intracellular calcium content was significantly higher in HP group than control group (p < .05). The calcium salt deposition was confirmed by alizarin red staining in the HP group ().
Figure 1. High phosphate induced osteoblast differentiation and calcification in VSMCs. (A) Alizarin red staining in general; (B) Alizarin red staining under microscope; (C) Compared the expression of Bone Morphogenetic Protein 2 (BMP2), Run-related transcription factor 2(RUNX2) and osteocalcin in RT-qPCR; (D) Compared the intracellular calcium concentration of the two groups.
The differentially expressed mRNAs and lncRNAs
The mRNAs and lncRNAs were differentially expressed between the two groups (using the thresholds of FC ≥ 2.0 and p ≤ .05), which were illustrated by volcano plots (). There were 379 differentially expressed mRNAs (220 upregulated and 159 downregulated) and 728 differentially expressed lncRNAs (332 upregulated and 396 downregulated) in the HP group compared with the CON group (, supplement data 1, supplement data 2).
Figure 2. Cluster analyses the different expression of mRNAs and lncRNAs. (A) Volcano plot analysis of group CON vs. HP. The Volcano plots contain differentially expressed mRNAs and lncRNAs and illustrate the complete of mRNAs and lncRNAs. The abscissa represents the difference between the two data sets following log 2 conversion and the ordinate represents the -log10 (p-value); (B) Hierarchical clustering analyses of differentially expressed lncRNAs and mRNAs.
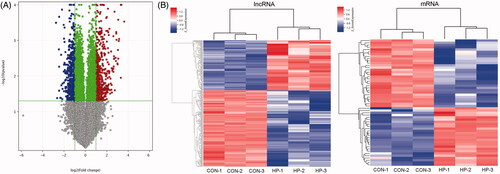
Table 2. The number of differentially expressed of mRNAs and lncRNAs.
Cluster analysis of differentially expressed mRNAs and lncRNAs
The hierarchical clustering was used to identify distinguishable genetic expression patterns among the samples (). The Pearson correlation coefficient of lncRNA expression with the expression of mRNA was calculated. Between the two groups (CON vs. HP), a common set of downregulated and upregulated genes was identified.
lncRNA functional prediction
The GO enrichment and KEGG pathway were adopted to analyze the predicted functions of the differentially expressed mRNAs. GO enrichment analysis predicts gene function in three main categories: molecular function, cell component and biological process. More functions were present in .
Figure 3. LncRNA function prediction. KEGG pathway analysis and GO enrichment analysis. GO enrichment analysis. (A) Molecular function analysis; (B) Cellular analysis component; (C) Biological process; (D) KEGG pathway analysis of the differentially expressed lncRNAs between CON and HP. GO, Gene Ontology; KEGG, Kyoto Encyclopedia of Genes and Genomes; lncRNA, long non-coding RNA.
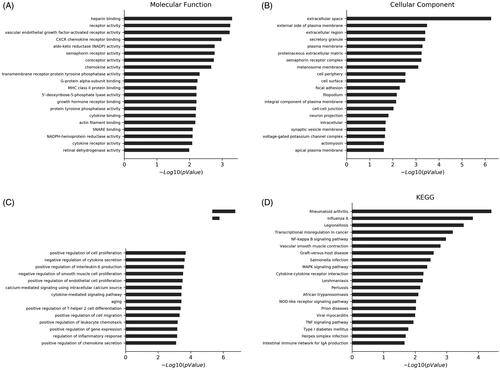
The mRNAs were differentially expressed in the HP group compared with the CON group and particularly associated with rheumatoid arthritis, nuclear factor kappa B (NF-κB) signaling, mitogen-activated protein kinase (MAPK) signaling, transcriptional dysregulation in cancer, VSMC contraction, cytokine-cytokine receptor interaction, NOD-like receptor signaling pathway and TNF signaling pathway were confirmed by KEGG pathway analysis. Activation of these signaling pathways through mRNAs may be associated with osteoclastic differentiation ().
lncRNA TF mRNA network analysis
In this study, we focused on eight lncRNAs to explore their potential functions and constructed the lncRNA-mRNA co-expression network. Overall, 1356 interacting pairs, 4 TFs, 8 lncRNAs and 147 mRNAs were included in the network. By calculating the hypergeometric distribution, multiple lncRNA-TF associations for each differentially expressed lncRNA (DEL) were determined. Each lncRNA-TF association was the result of multiple genetic enrichments. A double-association network was formulated from the top 100 lncRNA-TF associations of differentially expressed lncRNAs. In addition, a triple-association network was formulated using the top 8 DELs ().
Figure 4. LncRNA TF mRNA network analysis. (A) LncRNA-TF-mRNA network analysis of CON vs HP. There are 1,356 interactions pairs, 4 TFs, 8 lncRNAs and 147 mRNAs in the network. Blue nodes represent TFs, red nodes represent lncRNAs, green nodes represent target genes and the node size is proportional to its outward connection; (B) LncRNA-TF network analysis of CON vs HP. There are 100 lncRNA‐TF interactions pairs, 11 TFs and 84 lncRNAs in the network. Blue nodes represent TFs, red nodes represent lncRNAs and the node size is proportional to its outward connection. lncRNA, long non-coding RNA; TF, transcription factor.
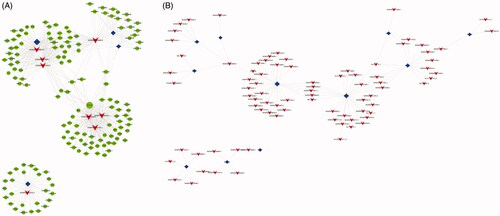
In comparison with the CON group, multiple factors including lysine acetyltransferase 2 A (KAT2A), TATA-box binding protein associated factor 7 (TAF7), signal transducer and activator of transcription 1 and 3 (STAT3 and STAT1), GATA binding protein 2 (GATA2), E1A binding protein p300 (EP300), forkhead box A1 (FOXA1), forkhead box A2 (FOXA2), RE1 silencing transcription factor (REST), BAF chromatin remodeling complex subunit BCL11A (BCL11A) and nuclear factor-kappa B subunit 1 (NFKB1) were confirmed to be the most connective TFs in the HP group, suggesting that these TFs may be related to the osteoclastic differentiation of HP-induced VSMCs ().
Furthermore, in the HP group, it was revealed that NONHSAT058810.2, NONHSAT179247.1, NONHSAT033640.2, NONHSAT061050.2, NONHSAT006046.2, NONHSAT036152.2, NONHSAT197162.1 and NONHSAT162315.1 were the most highly connected with lncRNAs comparing with the CON group (). This suggests that lncRNAs may be associated with osteoblastic differentiation.
Quantitative analysis
The RT-qPCR results indicated that all genetic validation experiments were successful in the study. These data analyzed by the 2−ΔΔCq method, as well as the expression of two differentially expressed lncRNAs and three differentially expressed mRNAs that were randomly selected. Most of the RT-qPCR results were consistent with the microarray results (). Expression of the lncRNAs NONHSAT084969.2 and NONHSAT193411.1 were confirmed to increase significantly in the HP group in comparison with than that in the CON group. The mRNA expression of 5′-nucleotidase ecto (NT5E) and intracellular adhesion molecule 1 (ICAM1) were also higher in the HP group than in the CON group, while the mRNA of MAP3K7 C-terminal-like (MAP3K7CL) was lower than CON group (). Only the RT-qPCR result for NONHSAT193411.1 was inconsistent with the microarray results. The primer sequences of these mRNAs and lncRNAs are listed in .
Figure 5. Quantitative analysis. Differential expression of lncRNA and mRNA was verified using RT-qPCR. The expression levels of individual lncRNAs and mRNAs were compared between the CON group and the HP group (A, NT5E; B, ICAM1; C, MAP3K7CL; D, NONHSAT084969.2; and E, NONHSAT193411.1). The changes in the expression level of each lncRNA and mRNA are illustrated as a vertical bar. The vertical axis represents fold change in expression on a log 2 scale.
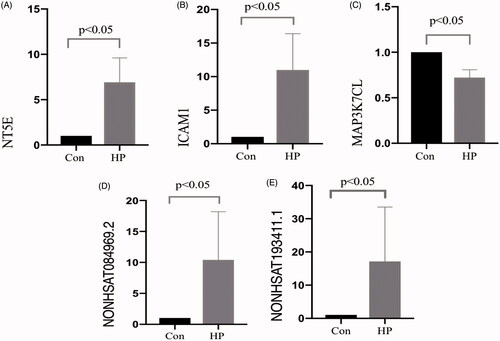
Table 3. Primer sequences used for reverse transcription quantitative polymerase chain reaction.
Discussion
Chronic kidney disease (CKD) is a serious public health problem, rank only second to hypertension and diabetes in terms of prevalence [Citation16]. Cardiovascular disease (CVD) is the leading cause of death in CKD patients. The incidence of CVD in CKD patients is 20–30 times higher than those in without CKD patients [Citation17]. The Morbidity rates and the mortality rates of CKD are also increasing in worldwide. As the main reason for CKD mortality, CVD is the pivotal factor for all complications witnessed in patients with CKD [Citation18]. The serum phosphorus gradually increases, as renal function decreases during the pathogenesis of CKD. One of the most serious consequences of a high serum level of phosphorus is the induction of vascular calcification [Citation9]. It is becoming increasingly clear that phosphate is the driving force behind overall bone metabolism, thus evolving as a central issue in chronic kidney disease mineral bone disease (CKD-MBD) [Citation1].
In this study, the expression of calcium nodules, intracellular calcium concentration and osteocalcin markers, such as RUNX2, BMP2 and osteocalcin were significantly increased in the high-phosphorus group compared with the normal group. RUNX2 belongs to the RUNX family and which have a DNA binding domain. It is expressed in undifferentiated mesenchymal cells, upregulated in preosteoblasts, downregulated in mature osteoblasts and regulates the proliferation of osteoblast progenitor cells and the expression of bone matrix proteins [Citation19]. BMP2 is one of the multifunctional growth factors in the transforming growth factor β superfamily. BMP2 is one of the main participant in the stabilization of the internal environment of the skeleton after birth and it is provided the osteogenic signal for bone repair [Citation20]. Osteocalcin is the secreted in the extracellular matrix of bone and which is the most abundant non-collagen protein in the matrix. Osteocalcin is abundant in the systemic circulation and its circulation level is closely related to bone formation [Citation21]. This study suggests that high phosphorus can induce osteogenesis and transdifferentiation of vascular smooth muscle cells.
The lncRNAs are a group of noncoding RNA molecules of over 200 bp in length. The lncRNAs have a conservative secondary structure, enabling their interaction with proteins, DNA and RNA, which regulate various biological processes [Citation22]. Although the roles of most lncRNAs are yet to be precisely clarified, accumulating evidence suggests that they have major effects during the osteogenic differentiation of various cells, including induced pluripotent, embryonic, bone marrow, adipose tissue and periodontal ligament stem cells. lncRNAs are also to regulate osteogenic markers and which is the key factors in pathways of osteogenic differentiation and osteogenesis. Wang et al. reported the LncRNA TUG1 sponges miR-204-5p to promote osteoblast differentiation through upregulating Runx2 expression in aortic valve calcification [Citation23]. Moreover, Merryman et al. found that the lncRNA notch receptor 1 (NOTCH1) is involved in the development of idiopathic calcified aortic valve disease (CAVD) [Citation24]. Zhu et al. also reported that downregulation of the lncRNA Angelman syndrome chromosome region (ANCR) promoted osteoblast differentiation by targeting enhancer of zeste 2 polycomb repressive complex 2 subunits (EZH2) and regulating RUNX2 expression [Citation25].
Accordingly, we report the identification of lncRNAs differentially expressed in the HP group in comparison with the CON group (fold change ≥ 2.0, p < .05; ; ). The differentially expressed genes included 332 upregulated lncRNAs, 396 downregulated lncRNAs, 220 upregulated mRNAs and 159 downregulated mRNAs. Our subsequent RT-qPCR analyses, using an expanded number of samples, supported the reliability of such identifications to a further step, suggesting that lncRNAs may be involved in the HP-induced osteoblast differentiation of VSMCs.
After differentially expressed lncRNAs had been identified, the GO enrichment and KEGG pathway analyses were performed to evaluate their potential functions and mechanisms of action. These analyses of the lncRNAs differentially expressed between the HP and CON groups indicated significant associations with NF-κB signaling and MARK signaling. The transcription factor, nuclear factor-kappa B (NF-κB) regulates the expression of inflammatory cytokines as well as many other genes related to cell survival, proliferation and differentiation [Citation26]. Previous studies indicated that vascular calcification was directly induced by HP conditions via the activation of NF-κB signaling in VSMCs [Citation27]. A high level of phosphorus induces the osteogenic differentiation of vascular smooth muscle cells by various signaling pathways. As one of the most important signaling pathways, NF-κB is closely related to inflammation, ERK1/2, RANKL/RANK, P13K/SGK1 and other pathways [Citation9]. In contrast, the MAPK signal includes extracellular signal-regulated kinase (ERK), p38 and c-Jun NH2-terminal kinase (JNK), which activated by diverse extracellular and intracellular stimuli including peptide growth factors, cytokines, hormones and various cellular stressors, such as oxidative stress and endoplasmic reticulum stress. These, in turn, regulate a variety of cellular activities including proliferation, differentiation, survival and death [Citation28]. Multiple studies have suggested that the MARK pathway is involved in the occurrence and development of osteogenic transdifferentiation in different cells [Citation29–32].
The establishment of co-expression relationships between specific lncRNAs and specific mRNAs provides specific experimental and verifiable hypotheses concerning the functions of lncRNAs, given that many functions of RNAs are known. Therefore, we formulated a lncRNA-mRNA co-expression network focusing on eight specific lncRNAs ().
In the lncRNA-TF-mRNA network analysis, the NONHSAT058810.2, NONHSAT197162.1, NONHSAT033640.2, NONHSAT036152.2, NONHSAT179247.1, NONHSAT162315.1, NONHSAT061050.2 and NONHSAT006046.2 were the most highly connected lncRNAs. NONHSAT058810.2 is located on chromosome 18 and which is 450 bp in length; it is expressed in mammalian cardiac and brain tissues, as reported on the NONCODE website. NONHSAT197162.1, located on chromosome 3 and 774 bp long, NONHSAT179247.1 on chromosome 18 and 2694 bp long and NONHSAT162315.1 on chromosome 12 and 2574 bp have been reported to be expressed in lung cancer [Citation33]. Meanwhile, NONHSAT033640.2 on chromosome 13 and 240 bp long, NONHSAT036152.2 on chromosome 14 and 2141 bp long and NONHSAT006046.2 on chromosome 1 and 535 bp are expressed specifically in mammals [Citation34]. Finally, NONHSAT061050.2 is on chromosome 19 and 214 bp long.
These relational networks can be applied to provide insights to predict the functions of lncRNAs. For example, NONHSAT006046.2 is the most significantly upregulated among these eight lncRNAs (group HP Up >7-fold); it is in turn associated with 48 mRNAs. STC1 is a mammalian tin-calcium (STC) homolog, which plays a major role in the calcium/phosphorus homeostasis of fish. Research showed that STC1 is expressed in a time- and cell-specific manner and may play an autocrine/paracrine role in osteoblast development and bone formation [Citation35]. SMAD7 is involved in bone formation by interacting with RUNX2 and participates in the regulation of osteogenesis [Citation36]. In addition, EphB4, a member of the erythropoietin-producing hepatocyte receptors, the largest family of receptor tyrosine kinases (RTKs), has a crucial role in regulating bone coupling [Citation37]. Moreover, as a Toll-like receptor, TLR4 plays a critical role in angiogenesis [Citation38]. Therefore, in terms of the functions of these genes, we speculate that the lncRNAs related to the above mRNAs are also involved in the development of osteogenic differentiation.
According to the network diagram, these lncRNAs may regulate the expression of TFs, including STAT1, KAT2A, GATA2, TAF7 and REST. Cellular homeostasis is regulated by various signaling proteins which contribute to the activation of intracellular and extracellular cascade reactions. This, in turn, leads to the regulation of gene activity. One of the most important signal systems is the STAT family, consisting of seven members and serving as effective transcription factors to transmit cytokine and growth factor signals to the nucleus. The first member of this family to be identified and studied is STAT1, a 91 kDa protein of great importance to immune cells and other cell types [Citation39]. STAT1 was found to exert unique, noncanonical functions such as acting as a cytoplasmic attenuator of Runx2. In this way, STAT1 is related to Runx2 and thus to osteoblast differentiation [Citation40]. TAF7 is a component of the TFIID complex in charge of controlling the first steps of transcription, which is consistent with its essential role in cell proliferation [Citation41]. Our study suggested that many of the lncRNAs are related to TFs, as mentioned above and these TFs may be associated with the occurrence of osteogenic differentiation induced by high phosphorus.
Conclusions
In conclusion, in comparison with the CON group, HP-induced VSMCs was associated with remarkable osteogenic differentiation, which may be partially regulated by lncRNAs. However, the exact mechanism by lncRNAs play a role in the process needs to be clarified by further studies.
Supplemental Material
Download MS Excel (141.3 KB)Supplemental Material
Download MS Excel (196.4 KB)Acknowledgments
The authors thank Liwen Bianji, Edanz Editing China (www.liwenbianji.cn/ac), for editing a draft of the English text of this manuscript.
Disclosure statement
The authors declare there are no conflicts of interest regarding the publication of this paper.
Additional information
Funding
References
- Schlieper G, Schurgers L, Brandenburg V, et al. Vascular calcification in chronic kidney disease: an update. Nephrol Dial Transplant. 2016;31(1):31–39.
- Shanahan CM, Crouthamel MH, Kapustin A, et al. Arterial calcification in chronic kidney disease: key roles for calcium and phosphate. Circ Res. 2011;109(6):697–711.
- Lang F, Ritz E, Voelkl J, et al. Vascular calcification–is aldosterone a culprit? Nephrol Dial Transplant. 2013;28(5):1080–1084.
- Alesutan I, Feger M, Tuffaha R, et al. Augmentation of phosphate-induced osteo-/chondrogenic transformation of vascular smooth muscle cells by homoarginine. Cardiovasc Res. 2016;110(3):408–418.
- Lanzer P, Boehm M, Sorribas V, et al. Medial vascular calcification revisited: review and perspectives. Eur Heart J. 2014;35(23):1515–1525.
- Abramowitz M, Muntner P, Coco M, et al. Serum alkaline phosphatase and phosphate and risk of mortality and hospitalization. CJASN. 2010;5(6):1064–1071.
- Paloian NJ, Giachelli CM. A current understanding of vascular calcification in CKD. Am J Physiol Renal Physiol. 2014;307(8):F891–900.
- Giachelli CM. Vascular calcification: in vitro evidence for the role of inorganic phosphate. J Am Soc Nephrol. 2003;14(9 Suppl 4):S300–S304.
- Voelkl J, Lang F, Eckardt KU, et al. Signaling pathways involved in vascular smooth muscle cell calcification during hyperphosphatemia. Cell Mol Life Sci. 2019;76(11):2077–2091.
- Wu J, Zhao J, Sun L, et al. Long non-coding RNA H19 mediates mechanical tension-induced osteogenesis of bone marrow mesenchymal stem cells via FAK by sponging miR-138. Bone. 2018; 108:62–70.
- Tang Z, Gong Z, Sun X. LncRNA DANCR involved osteolysis after total hip arthroplasty by regulating FOXO1 expression to inhibit osteoblast differentiation. J Biomed Sci. 2018;25(1):4–13.
- Xiao X, Zhou T, Guo S, et al. LncRNA MALAT1 sponges miR-204 to promote osteoblast differentiation of human aortic valve interstitial cells through up-regulating Smad4. Int J Cardiol. 2017; 243:404–412.
- Wang Q, Li Y, Zhang Y, et al. LncRNA MEG3 inhibited osteogenic differentiation of bone marrow mesenchymal stem cells from postmenopausal osteoporosis by targeting miR-133a-3p. Biomed Pharmacother. 2017; 89:1178–1186.
- Wei B, Wei W, Zhao B, et al. Long non-coding RNA HOTAIR inhibits miR-17-5p to regulate osteogenic differentiation and proliferation in non-traumatic osteonecrosis of femoral head. PLoS One. 2017; 12(2):e0169097–0169111.
- Chen L, Song Z, Huang S, et al. lncRNA DANCR suppresses odontoblast-like differentiation of human dental pulp cells by inhibiting wnt/beta-catenin pathway. Cell Tissue Res. 2016;364(2):309–318.
- Zhang L, Wang F, Wang L, et al. Prevalence of chronic kidney disease in China: a cross-sectional survey. Lancet. 2012;379(9818):815–822.
- Schiffrin EL, Lipman ML, Mann J. Chronic Kidney Disease. Circulation. 2007;116(1):85–97.
- Lu Y-A, Lee S-Y, Lin H-Y, et al. Serum phosphate as an additional marker for initiating hemodialysis in patients with advanced chronic kidney disease. Biomed J. 2015;38(6):531–537.
- Komori T. Regulation of proliferation, differentiation and functions of osteoblasts by Runx2. IJMS. 2019; 20(7):1694–1705.
- Rosen V. BMP2 signaling in bone development and repair. Cytokine Growth Factor Rev. 2009;20(5-6):475–480.
- Karsenty G. Update on the Biology of Osteocalcin. Endocrine Practice. 2017;23(10):1270–1274.
- Ransohoff JD, Wei Y, Khavari PA. The functions and unique features of long intergenic non-coding RNA. Nat Rev Mol Cell Biol. 2018;19(3):143–157.
- Yu C, Li L, Xie F, et al. LncRNA TUG1 sponges miR-204-5p to promote osteoblast differentiation through upregulating Runx2 in aortic valve calcification. Cardiovasc Res. 2018;114(1):168–179.
- Merryman WD, Clark CR. Lnc-ing NOTCH1 to idiopathic calcific aortic valve disease. Circulation. 2016;134(23):1863–1865.
- Zhu L, Xu PC. Downregulated LncRNA-ANCR promotes osteoblast differentiation by targeting EZH2 and regulating Runx2 expression. Biochem Biophys Res Commun. 2013;432(4):612–617.
- Xanthoulea S, Curfs DM, Hofker MH, de Winther MP. Nuclear factor kappa B signaling in macrophage function and atherogenesis. Curr Opin Lipidol. 2005;16(5):536–542.
- Zhang D, Bi X, Liu Y, et al. High phosphate-induced calcification of vascular smooth muscle cells is associated with the TLR4/NF-kappab signaling pathway. Kidney Blood Press Res. 2017;42(6):1205–1215.
- Kim EK, Choi EJ. Pathological roles of MAPK signaling pathways in human diseases. Biochim Biophys Acta. 2010;1802(4):396–405.
- Yu X, Quan J, Long W, et al. LL-37 inhibits LPS-induced inflammation and stimulates the osteogenic differentiation of BMSCs via P2X7 receptor and MAPK signaling pathway. Exp Cell Res . 2018;372(2):178–187.
- Li X, Zheng Y, Zheng Y, et al. Circular RNA CDR1as regulates osteoblastic differentiation of periodontal ligament stem cells via the miR-7/GDF5/SMAD and p38 MAPK signaling pathway. Stem Cell Res Ther. 2018; 9(1):232–246.
- Xing LZ, Ni HJ, Wang YL. Quercitrin attenuates osteoporosis in ovariectomized rats by regulating mitogen-activated protein kinase (MAPK) signaling pathways. Biomed Pharmacother. 2017; 89:1136–1141.
- Stanton LA, Beier F. Inhibition of p38 MAPK signaling in chondrocyte cultures results in enhanced osteogenic differentiation of perichondral cells. Exp Cell Res. 2007;313(1):146–155.
- White NM, Cabanski CR, Silva-Fisher JM, et al. Transcriptome sequencing reveals altered long intergenic non-coding RNAs in lung cancer. Genome Biol. 2014;15(8):429–445.
- Bu D, Luo H, Jiao F, et al. Evolutionary annotation of conserved long non-coding RNAs in major mammalian species. Sci China Life Sci. 2015;58(8):787–798.
- Yoshiko Y, Aubin JE, Maeda N. Stanniocalcin 1 (STC1) protein and mRNA are developmentally regulated during embryonic mouse osteogenesis: the potential of STC1 as an autocrine/paracrine factor for osteoblast development and bone formation. J Histochem Cytochem. 2002;50(4):483–491.
- Li L, Jiang D. Hypoxia-responsive miRNA-21-5p inhibits Runx2 suppression by targeting SMAD7 in MC3T3-E1 cells. J Cell Biochem. 2019;120(10):16867–16875.
- Li C, Shi C, Kim J, et al. Erythropoietin promotes bone formation through EphrinB2/EphB4 signaling. J Dent Res. 2015;94(3):455–463.
- Ma B, Dohle E, Li M, et al. TLR4 stimulation by LPS enhances angiogenesis in a co-culture system consisting of primary human osteoblasts and outgrowth endothelial cells. J Tissue Eng Regen Med. 2017;11(6):1779–1791.
- Wang J, Schreiber RD, Campbell IL. STAT1 deficiency unexpectedly and markedly exacerbates the pathophysiological actions of IFN-alpha in the central nervous system. Proc Natl Acad Sci U S A. 2002;99(25):16209–16214.
- Takayanagi H, Kim S, Koga T, et al. Stat1-mediated cytoplasmic attenuation in osteoimmunology. J Cell Biochem. 2005;94(2):232–240.
- Gegonne A, Devaiah BN, Singer DS. TAF7: traffic controller in transcription initiation. Transcription. 2013;4(1):29–33.