
 ?Mathematical formulae have been encoded as MathML and are displayed in this HTML version using MathJax in order to improve their display. Uncheck the box to turn MathJax off. This feature requires Javascript. Click on a formula to zoom.
Abstract
Background
Acute kidney injury (AKI) is a significant cause of morbidity and mortality, especially in sepsis patients. Early prediction of AKI can help physicians determine the appropriate intervention, and thus, improve the outcome. This study aimed to develop a nomogram to predict the risk of AKI in sepsis patients (S-AKI) in the initial 24 h following admission.
Methods
Sepsis patients with AKI who met the Sepsis 3.0 criteria and Kidney Disease: Improving Global Outcomes criteria in the Massachusetts Institute of Technology critical care database, Medical Information Mart for Intensive Care (MIMIC-III), were identified for analysis. Data were analyzed using multiple logistic regression, and the performance of the proposed nomogram was evaluated based on Harrell’s concordance index (C-index) and the area under the receiver operating characteristic curve.
Results
We included 2917 patients in the analysis; 1167 of 2042 patients (57.14%) and 469 of 875 patients (53.6%) had AKI in the training and validation cohorts, respectively. The predictive factors identified by multivariate logistic regression were blood urea nitrogen level, infusion volume, lactate level, weight, blood chloride level, body temperature, and age. With the incorporation of these factors, our model had well-fitted calibration curves and achieved good C-indexes of 0.80 [95% confidence interval (CI): 0.78–0.82] and 0.79 (95% CI: 0.76–0.82) in predicting S-AKI in the training and validation cohorts, respectively.
Conclusion
The proposed nomogram effectively predicted AKI risk in sepsis patients admitted to the intensive care unit in the first 24 h.
Background
Acute kidney injury (AKI) is a common and economically significant disease. It affects approximately 5–7% of hospitalized patients [Citation1,Citation2], particularly in the intensive care unit (ICU) where it is reported in 20–50% of patients [Citation3–5]. Sepsis is a major devastating disease in the ICU. The outcomes for ICU admissions owing to the two syndromes are significant, with the mortality rates for septic acute kidney injury (S-AKI) ranging from 22.0 to 70.2% [Citation6–8].
Currently, AKI is diagnosed based on elevation of serum creatinine levels or a decline in urine output according to the Kidney Disease: Improving Global Outcomes (KDIGO) guidelines [Citation9]. In February 2016, JAMA reported the newest Sepsis-3 criteria for clinical care, which highlighted the strong association between infection and organ failure [Citation10]. Early diagnosis and intervention delay progression of AKI to severe stages and development of chronic kidney disease (CKD) after hospital discharge. For these reasons, the prediction of risk is worthy of investigation [Citation11].
Many prediction efforts have been made over the past decade, most of which focused on blood- or urine-based injury or novel biomarkers [Citation12–14]. Unfortunately, these markers are not only rarely available but often lack sensitivity or specificity. With advances in machine learning techniques, other investigators have built models that focus on other specific patient subsets [Citation15–17].
Because of the current inability to predict S-AKI in ICU settings, the development of a predictive model that considers relevant factors associated with S-AKI based on electronic health records appears to be essential. Of the available models, a nomogram can provide an individualized, evidence-based, highly accurate risk estimation. Nomograms are easy to use and can facilitate management-related decision making. To our knowledge, there are no previous nomograms for predicting AKI risk estimation in patients with sepsis.
Methods
Source of data
An openly available US-based critical care database named the Medical Information Mart for Intensive Care (MIMIC)-III v 1.4 was analyzed [Citation18]. MIMIC-III is a large, integrated, de-identified, comprehensive clinical dataset that includes data from all patients admitted to the ICUs of Beth Israel Deaconess Medical Center in Boston, MA from June 1, 2001 to October 31, 2012. Three hundred and eighty laboratory measurements and hourly records made by ICU nurses were recorded. The database also includes data on basic information, laboratory results, imaging examinations, diagnoses, and others. When patients were discharged, International Classification of Diseases, 9th revision (ICD-9) were entered for precise diseases by the hospital staff. Because this study was an analysis of a third-party anonymized publicly available database with preexisting institutional review board approval, IRB approval from our institution was waived. The study was conducted according to the recommendations of the Transparent Reporting of a multivariable prediction model for Individual Prognosis Or Diagnosis (TRIPOD) statement [Citation19].
Participants
The inclusion criteria were as follows: (1) Sepsis-3 criteria [Citation10] (suspected infection, sequential organ failure assessment (SOFA) scores calculated using data from the first 24 h of the ICU stay); (2) KDIGO criteria [Citation9] (serum creatinine ≥ 26.4 μmol/L or increase by ≥ 1.5-fold to two-fold from baseline, > two-fold to three-fold from baseline, and > three-fold from baseline; or serum creatinine ≥ 354 μmol/L with an acute increase of at least 44 μmol/L. Individuals who received continuous renal replacement therapy (CRRT) were considered to have met the criteria of AKI III regardless of their serum creatinine value. Baseline serum creatinine level was evaluated according to KDIGO standards for all patients); and (3) ICU admission from 2008 to 2012, because antibiotic prescriptions were only recorded from 2003 onwards [Citation20]. We excluded patients with CKD, who were less than 18 years of age, or those who had incomplete clinical data. Variables with >20% missing values were excluded from the model building process. Eligible patients were selected randomly from 70% of the sample for the training set, and the data were independently validated using the remaining 30% of patients. The training group was used to train the model weight parameters, and the validation group was used to verify the accuracy of the model in predicting AKI in sepsis patients. Finally, we excluded several items with extreme values and considered a range of 0.5–99.5%.
Clinicopathologic variables
The clinicopathologic variables in the study are displayed in . The basic data included covariates, comorbidities, vital signs, interventions, and laboratory results. Age, sex, weight, height, and ethnicity were collected from the original dataset. Respiratory rate, temperature, and heart rate at ICU admission were collected from the CHARTENENTS in MIMIC_III. Laboratory parameters, including white blood cell (WBC) count, hemoglobin level, platelet count, and blood urea nitrogen (BUN), potassium, bicarbonate, chloride, and lactate levels were recorded in the LABENENTS in MIMIC-III. All data were recorded in the first 24 h following admission. SOFA scores were calculated using data from the initial 24 h of the ICU stay. All comorbidities were identified on the basis of the recorded International Classification of Diseases, 9th revision (ICD-9) codes. According the Bayesian Information Criterion (BIC) principle, six factors were selected to build the model. Bayesian Information Criterion (BIC) principle formula is:
is the maximized value of likelihood function of the model M, i.e.
= p(x |
M), where
are the parameter values that maximize the likelihood function, and x is the observed data; n means the number of data points in x, the number of observations, or equivalently, the sample size; k is the number of parameters estimated by the model. For example, in multiple linear regression, the estimated parameters are the intercept, the q slope parameters, and the constant variance of the errors, thus, k is q add 2.
Table 1. Baseline demographic, intervention and laboratory characteristics of patients.
Statistical analysis
Continuous clinical data are expressed as means and were compared using the independent Student t-test or rank-sum test, as appropriate. Categorical variables were compared using the Chi-square or Fisher exact test. The significance of potential risk factors in the training cohort was assessed using univariate logistic regression analysis. A stepwise logistic regression model was used to select significant variables associated with AKI. A nomogram was developed based on the results of the multivariate logistic regression analysis using the rms package of R, version 3.6 (http://www.r-project.org/). The predictive performance of the nomogram was evaluated using Harrell’s concordance index (C-index) and calibration with 1000 bootstrap samples was performed to decrease the overfit bias. Accuracy of the optimal cutoff value was assessed using sensitivity, specificity, positive and negative predictive values, and likelihood ratios.
Statistical significance in all analyses was set at the 0.05 level. All analyses were performed using R, version 3.6. The outcomes of our study are completely reproducible, and the data are available online from the MIMIC-III database.
Results
After applying our selection criteria, 2917 of 23,620 ICU admissions met the Sepsis 3.0 criteria, with 2042 and 875 patients with and without AKI, respectively. The differences in the characteristics of the patients between the training and validation sets are shown in . The baseline clinicopathologic data were similar between the training set and validation set. According to the KDIGO criteria, AKI was detected in 1167 (1167/2042) and 496 (496/875) patients in the training and validation sets, respectively.
Development and validation of an S-AKI predicting nomogram
All variables shown in were used in the univariate logistic analysis (). Multivariate logistic regression was performed using variables with p < 0.05 in the univariate logistic analysis and those with not more than 20% missing values. We selected another six factors based on the Bayesian Information Criterion (BIC) principle in the ‘bestglm’ package in R; however, considering its clinical significance, age was also taken into account [Citation21,Citation22]. On multivariate analysis, with results reported as odds ratio (95% CI), BUN level (mg/dL) (1.08 [1.07–1.09]), infusion volume (ml) (1.00 [1.00–1.00]), lactate level (mmol/L) (1.18 [1.12–1.26]), weight (kg) (1.01 [1.01–1.02]), chloride level (mEq/L) (1.04 [1.02–1.06]), temperature (°C) (0.83 [0.73-0.94]), and age(year) (1.01 [1.00–1.01]) were independently associated with the occurrence of S-AKI (). Because they were calculated based on basic units instead of 10-year and L, the ORs for age and infusion volume were relatively small.
Table 2. Univariate logistic regression analysis of S-AKI based on first 24 h data in the training set.
Table 3. Multivariate logistic regression analysis of S-AKI based on first 24 h data in the training set.
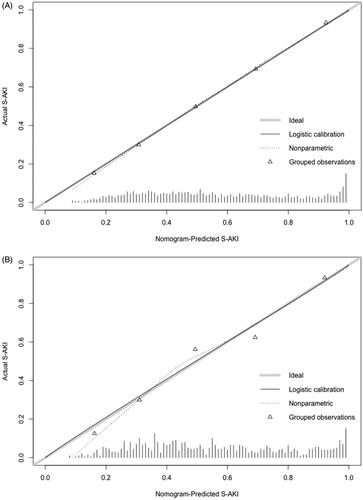
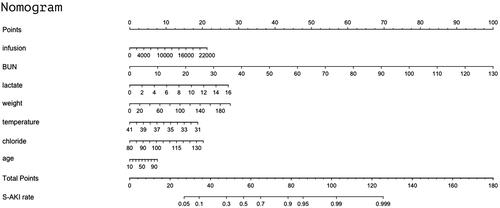
These factors were then used to develop an S-AKI risk estimation nomogram () as continuous variables, meaning that the parameters were not categorized as normal, low, or high. The resulting model was internally validated using the bootstrap validation method. The nomogram demonstrated good accuracy for estimating the risk of S-AKI in the first 24 h, with an unadjusted C-index of 0.80 (95% CI: 0.78–0.82) (); the C-index for the estimation of S-AKI risk in the validation set was 0.79 (95% CI: 0.76–0.82) ().
Figure 1. Flow chart of patient selection.
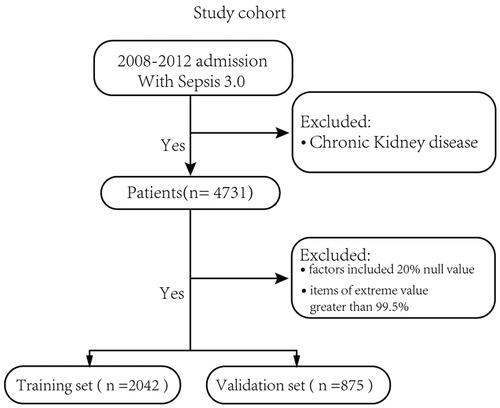
Figure 2. (A) Calibration of the training set. Evaluation of the predictive performance for estimating the risk of S-AKI of the nomogram in the training cohort (n = 2042); (B) Calibration of the validation set. Evaluation of the predictive performance for estimating the risk of S-AKI of the nomogram in the validation set (n = 875). C-index: concordance index.
Risk of S-AKI based on the nomogram scores
Our model performed well with sensitivity, specificity, positive predictive value, and negative predictive value for differentiating between the presence and absence of S-AKI of 73.86, 68.46, 75.75, and 65.54% in the training set, and 71.98, 69.39, 75.48, and 65.42% in the validation cohort, respectively. The AUC, used for evaluation of the accuracy of the nomogram in the prediction of AKI in septic patients, was 0.80 (95% CI, 0.78–0.82) in the training set and 0.79 (95% CI, 0.76–0.82) in validation set ().
Figure 3. Receiver operating characteristic curve of the nomogram. Receiver operating characteristic curve for predicting AKI within 24 h of admission to the intensive care unit in sepsis patients. AUC = area under the receiver operating characteristic curve. The AUC of the nomogram for the prediction of AKI in septic patients was 0.80 [95% confidence interval (CI) 0.78–0.82] in the training set and 0.79 (95% CI, 0.76–0.82) in the validation set.
![Figure 3. Receiver operating characteristic curve of the nomogram. Receiver operating characteristic curve for predicting AKI within 24 h of admission to the intensive care unit in sepsis patients. AUC = area under the receiver operating characteristic curve. The AUC of the nomogram for the prediction of AKI in septic patients was 0.80 [95% confidence interval (CI) 0.78–0.82] in the training set and 0.79 (95% CI, 0.76–0.82) in the validation set.](/cms/asset/b3804b7a-b69d-451c-8216-ab0d3e55c8b0/irnf_a_1761832_f0003_c.jpg)
Discussion
The first hours in the ICU are considered the critical ‘golden hours’ because appropriate decision-making during this period about treatment and examination, such as fluid and hemodynamic management and targeted contrast-enhanced ultrasound, and drugs causing nephrotoxicity may alter the risk of AKI [Citation23,Citation24].
In this study, we found that AKI according to the KDIGO criteria was diagnosed in sepsis patients on the first day of admission 8–10 times more often than that in hospitalized patients. Further, the incidence of S-AKI in the ICU was significantly high. Moreover, we developed and validated a risk prediction nomogram, which was shown to have good performance for predicting AKI, using routine laboratory parameters and vital signs. We found that BUN level, infusion volume, lactate level, body weight, blood chloride level, body temperature, and age were significantly associated with AKI risk. Overall, our results demonstrated that the combination of these seven indicators may be used for more sensitive and specific diagnostic tests and requires further study.
AKI prediction models reported in previous studies focused on subsets of patients such as those with contrast-induced AKI [Citation17], those who underwent cardiac surgery [Citation16,Citation25] and those who received living donor liver transplants [Citation26]. However, to our knowledge, our nomogram is the first to be developed for AKI prediction in sepsis patients. Another study [Citation27] reported a recurrent neural network (RNN) model that demonstrated extraordinary practical value; however, the authors did not publicly release the code and the model is not available. Furthermore, the application of such a model would require specific computer software with programming ability, and it cannot be used on portable devices using basic clinical data, thereby limiting its application. Among currently available prediction tools, a nomogram can provide highly accurate information that can be generated simply and expressed graphically.
Our nomogram performed well as indicted by the C-index values. The bootstrapped calibration curves demonstrate the difference between a prediction and observation. Moreover, because the data for this model were derived from septic patients with a baseline probability of developing AKI, the values of these indicators although within the normal range may contribute to morbidity due to AKI.
For example, consider a 56-year-old man with sepsis and severe pneumonia who had received a transfusion. The patient’s volume of infusion was 4000 mL, BUN level 40 mg/dL, lactate level 2 mmol/L, weight 60 kg, chloride level 115 mEq/L, and last measured temperature 37.9 °C. According to , the score corresponding to each individual parameter in this case should be based on the first row. For example for age, the score will be approximately 3 based on an age of 56 years; the final score is calculated as the sum of points for all parameters (3(age) + 3(infusion) + 31(BUN) + 3(lactate) + 8(weight) + 5(temperature) + 14(chloride) = 67). This score corresponds to a risk of developing AKI in 24 h of approximately 73%. If data for one or two indicators are missing for a patient, the sensitivity of the model may decline, with inaccurate scores leading to underestimation of the risk.
Figure 4. Nomogram to estimate the risk of AKI in sepsis patients. To use the nomogram, we first draw a line from each parameter value to the score axis for the score. The points for all the parameters are then added. Finally, a line from the total score axis is drawn to determine the risk of AKI on the lower line of the nomogram.
Previous studies have shown BUN level [Citation28], infusion volume [Citation29], and hyperlactatemia [Citation30] to be associated with an increased likelihood of S-AKI incidence. The OR for infusion volume was 1.00009 because the unit of this parameter was ml, and in clinical settings, patients usually receive several hundred ml of infusion at a time. Accordingly, if a patient’s infusion volume is 1000 mL, the OR becomes 1.09 (1.000091000) for patients receiving no infusion. Elevated BUN levels and hyperlactatemia, in the clinical setting, are common indicators for physicians to carefully evaluate the condition of the patient and select suitable treatments or medications. The most sensitive indicator for the occurrence of AKI is the BUN level; a decline in the BUN level is associated with a reduced need for CRRT or diuretic use in patients. In this study, the ORs of the seven factors in the univariate logistic regression and multivariate logistic regression analyses showed a similar trend. Although body temperature can be controlled to maintain it as close to normal as possible, it is a complex parameter that is affected by several factors and may rise or fall secondary to factors such as cold shock.
We intend to develop more advanced machine learning algorithms, including random forest, support vector machine, and even RNNs for sepsis patients in the future. We plan to integrate these models into our local electronic health records system, from which the data and models can be extracted readily and automatically. Further, we intend to update this database and the models on a monthly basis by retraining and validating them using latest patient data. Although some data in a few algorithms may be difficult to interpret, the overall aim of this endeavor would be to enhance the specificity and sensitivity of the predictive ability.
Our study has several limitations. First, these data were derived from a single institution between 2008 and 2012; therefore, the model needs to be validated using data from other sources. Second, the risk of S-AKI in the first 24 h of admission to the ICU was predicted and no time series analysis was undertaken. Furthermore, with the accumulation of further laboratory and clinical data, a model-driven development approach should be employed. Finally, we only considered traditional parameters and did not consider new biomarkers of sepsis. With the inclusion of variables, such as neutrophil gelatinase-associated lipocalin (NGAL) [Citation31], matrix metallopeptidase 9 (MMP-9) [Citation32], and cystatin C, [Citation33] the accuracy of the model may improve.
Conclusion
Our model effectively predicts S-AKI risk upon ICU admission. The S-AKI nomogram demonstrated high sensitivity and specificity and can be used widely if routine clinical data are available. The application of this nomogram in clinical care settings can help physicians in decision-making regarding treatment and management, which may in turn help reduce mortality caused by the development of AKI.
Author contributions
Fuxing Deng analyzed the data and wrote the article. Milin Peng provided information regarding the background. Li Jing, Yana Chen, and Buyao Zhang reviewed the data analyses.
Acknowledgments
In writing this article, I listened to Professor Zhongheng Zhang’s lecture about the MIMIC III and I was inspired to conduct research based on the database. I thank my teachers and friends. In particular, I am deeply indebted to Professor Zhao, my supervisor, who gave me tips on writing this paper. I also wish to sincerely thank my friend Zelin Huang, for contributing to the statistical analyses of the data.
Disclosure statement
The authors report no conflict of interest
Data availability
All data that support the findings of this study are available from MIMIC III.
Additional information
Funding
References
- Koyner JL, Adhikari R, Edelson DP, et al. Development of a multicenter ward-based AKI prediction model. CJASN. 2016;11(11):1935–1943.
- Chertow GM, Burdick E, Honour M, et al. Acute kidney injury, mortality, length of stay, and costs in hospitalized patients. JASN. 2005;16(11):3365–3370.
- Hoste EA, Bagshaw SM, Bellomo R, et al. Epidemiology of acute kidney injury in critically ill patients: the multinational AKI-EPI study. Intensive Care Med. 2015;41(8):1411–1423.
- Case J, Khan S, Khalid R, et al. Epidemiology of acute kidney injury in the intensive care unit. Crit Care Res Pract. 2013;2013:1–9.
- Kashani K, Shao M, Li G, et al. No increase in the incidence of acute kidney injury in a population-based annual temporal trends epidemiology study. Kidney Int. 2017;92(3):721–728.
- Bagshaw SM, Uchino S, Bellomo R, et al. Septic acute kidney injury in critically ill patients: clinical characteristics and outcomes. CJASN. 2007;2(3):431–439.
- Bouchard J, Acharya A, Cerda J, et al. A prospective international multicenter study of AKI in the intensive care unit. CJASN. 2015;10(8):1324–1331.
- Bagshaw SM, George C, Bellomo R, et al.; the ANZICS Database Management Committee. Early acute kidney injury and sepsis: a multicentre evaluation. Crit Care. 2008;12(2):R47.
- Section 2: AKI Definition. Kidney Int Suppl. 2011;2(1):19–36.
- Sprung CL, Reinhart K. Definitions for sepsis and septic shock. JAMA. 2016;316(4):456–457.
- Ponce D, Zorzenon C. d P F, Santos N. Y d, et al. Early nephrology consultation can have an impact on outcome of acute kidney injury patients. Nephrol Dial Transplant. 2011;26(10):3202–3206.
- Zappitelli M, Greenberg JH, Coca SG, et al. Association of definition of acute kidney injury by cystatin C rise with biomarkers and clinical outcomes in children undergoing cardiac surgery. JAMA Pediatr. 2015;169(6):583–591.
- Wang JJ, Chi NH, Huang TM, et al. Urinary biomarkers predict advanced acute kidney injury after cardiovascular surgery. Crit Care. 2018;22(1):108.
- Wang M, Zhang Q, Zhao X, et al. Diagnostic and prognostic value of neutrophil gelatinase-associated lipocalin, matrix metalloproteinase-9, and tissue inhibitor of matrix metalloproteinases-1 for sepsis in the Emergency Department: an observational study. Crit Care. 2014;18(6):634.
- Malhotra R, Kashani KB, Macedo E, et al. A risk prediction score for acute kidney injury in the intensive care unit. Nephrol Dial Transplant. 2017;32(5):814–822.
- Thakar CV, Arrigain S, Worley S, et al. A clinical score to predict acute renal failure after cardiac surgery. JASN. 2005;16(1):162–168.
- Mehran R, Aymong ED, Nikolsky E, et al. A simple risk score for prediction of contrast-induced nephropathy after percutaneous coronary intervention: development and initial validation. J Am Coll Cardiol. 2004;44(7):1393–1399.
- Johnson AE, Pollard TJ, Shen L, et al. MIMIC-III, a freely accessible critical care database. Sci Data. 2016;3(1):160035.
- Collins GS, Reitsma JB, Altman DG, et al. Moons KGM, members of the Tg. Transparent reporting of a multivariable prediction model for individual prognosis or diagnosis (TRIPOD): the TRIPOD statement. Eur Urol. 2015;67(6):1142–1151.
- Johnson AEW, Aboab J, Raffa JD, et al. A comparative analysis of sepsis identification methods in an electronic database. Crit Care Med. 2018;46(4):494–499.
- Schmitt R, Coca S, Kanbay M, et al. Recovery of kidney function after acute kidney injury in the elderly: a systematic review and meta-analysis. Am J Kidney Dis. 2008;52(2):262–271.
- Kane-Gill SL, Sileanu FE, Murugan R, et al. Risk factors for acute kidney injury in older adults with critical illness: a retrospective cohort study. Am J Kidney Dis. 2015;65(6):860–869.
- Mehta RL, McDonald B, Gabbai F, et al. Nephrology consultation in acute renal failure: does timing matter? Am J Med. 2002;113(6):456–461.
- Kashani K, Ronco C. Acute kidney injury electronic alert for nephrologist: reactive versus proactive? Blood Purif. 2016;42(4):323–328.
- Pannu N, Graham M, Klarenbach S, et al. A new model to predict acute kidney injury requiring renal replacement therapy after cardiac surgery. CMAJ. 2016;188(15):1076–1083.
- Park MH, Shim HS, Kim WH, et al. Clinical risk scoring models for prediction of acute kidney injury after living donor liver transplantation: a retrospective observational study. PLoS One. 2015;10(8):e0136230.
- Tomasev N, Glorot X, Rae JW, et al. A clinically applicable approach to continuous prediction of future acute kidney injury. Nature. 2019;572(7767):116–119.
- Rachoin JS, Daher R, Moussallem C, et al. The fallacy of the BUN:creatinine ratio in critically ill patients. Nephrol Dial Transplant. 2012;27(6):2248–2254.
- Eriksson M, Brattstrom O, Martensson J, et al. Acute kidney injury following severe trauma: Risk factors and long-term outcome. J Trauma Acute Care Surg. 2015;79(3):407–412.
- Haas SA, Lange T, Saugel B, et al. Severe hyperlactatemia, lactate clearance and mortality in unselected critically ill patients. Intensive Care Med. 2016;42(2):202–210.
- Li J, Chen Y, Deng F, et al. Protective effect and mechanisms of exogenous neutrophil gelatinase-associated lipocalin on lipopolysaccharide-induced injury of renal tubular epithelial cell. Biochem Biophys Res Commun. 2019;515(1):104–111.
- Bengatta S, Arnould C, Letavernier E, et al. MMP9 and SCF protect from apoptosis in acute kidney injury. JASN. 2009;20(4):787–797.
- Li DY, Yin WJ, Zhou LY, et al. Utility of cystatin C-based equations in patients undergoing dialysis. Clin Chim Acta. 2018;485:282–287.