
Abstract
Aim
To analyze changes in saliva flow rate and clinical measures from unstimulated whole saliva (UWS) among patients undergoing hemodialysis for end-stage kidney disease (ESKD).
Background
Chronic hemodialysis causes changes in blood chemistry as well as dry mouth, due to removal of excess fluids. UWS is used to examine saliva flow rate as an indicator of mouth dryness. Whether UWS can be used to measure changes in clinical variables following hemodialysis has not been explored.
Design
A cross-sectional quantitative study.
Methods
Patients with ESKD were recruited by purposive sampling (n = 100) between 1 January and 30 June 2015 from a hospital in northern Taiwan. UWS was collected 1-hour pre-dialysis (T1), mid-dialysis (T2), and 1-hour post-dialysis (T3). Saliva flow rate and clinical variables were analyzed.
Results
Saliva flow rate increased significantly from T1 to T3 (Wald χ2 = 10.40, p < .01). Changes in saliva from T1 to T3 included decreases in blood urea nitrogen and creatinine (Wald χ2 = 97.12, p < .001 and Wald χ2 = 36.98, p < .001, respectively). The pH and osmolality also decreased (p < .001 and p < .01, respectively). Changes in electrolytes included decreases in potassium and calcium (Wald χ2 = 6.71, p < .05 and Wald χ2 = 17.64, p < .01, respectively) and increases in chloride (Wald χ2 = 17.64, p < .001).
Conclusion
Our findings demonstrated saliva flow rate and several saliva components were altered during hemodialysis. The total volume of saliva secretion increased following dialysis, which can reduce xerostomia. Therefore, medical personnel could provide interventions of relieving dry mouth symptoms and increasing saliva flow rate before hemodialysis treatment.
Introduction
The prevalence of end-stage kidney disease (ESKD) in Taiwan was reported to be the highest in the world in 2017 by the United States Renal Data System (USRDS); prevalence of treatment, per million population (PMP), was 3,392 PMP, and the incidence was 493 PMP [Citation1]. Nephritis, nephrotic syndrome, and renal disease are among the top 10 leading causes of death in Taiwan and treatments for ESKD contributes a significant financial burden to expenditures for Taiwan’s National Health Insurance System. Worldwide, hemodialysis (HD) is the most common approach for treatment of ESKD [Citation1] and this also holds true for Taiwan, with 83,808 individuals in treatment at the end of 2016 [Citation2].
Patients with ESKD undergo chronic hemodialysis and often suffer from dry mouth. Chronic hemodialysis has additional side effects due to the changes in blood volume that occur over the course of treatment: blood pressure fluctuations, which can lead to interdialytic hypertension; alterations in electrolytes, such as sodium; and fluctuations in biochemicals, such as albumin, blood urea nitrogen (BUN) and creatine (Cr); and weight gain [Citation3]. Therefore, a critical component for optimizing outcomes of hemodialysis is fluid control, which can also influence saliva flow rate.
Saliva flow rate measurement, which includes the measurement of stimulated saliva flow rate and unstimulated saliva flow rate, is a crucial objective indicator for dry mouth diagnosis. Measurement of stimulated saliva flow rate involves having the patient chew on a piece of chemically inert resin or transparent gum at 45 chews/min for 5 min, collecting their secreted saliva, and then calculating the mean weight of saliva secretion [Citation4]. By contrast, measurement of unstimulated saliva flow rate involves measuring the participant’s secreted saliva during 5–10 min of rest without receiving any form of stimulation [Citation5].
Saliva comprises numerous substances. In addition to water and mucin, saliva contains blood urea nitrogen (BUN), creatinine (Cr), and various electrolytes. Relevant research has indicated that the concentrations of biochemical substances in saliva and blood are equally correlated to each other [Citation6]. The saliva secretion volume under normal physiological functioning should be approximately 0.5–1 L/day [Citation7]. A survey conducted in Taiwan indicated that the unstimulated saliva flow rate of hemodialysis patients is approximately 0.06–0.07 mL/min [Citation8]; approximately 66.4% of such patients have experienced dry mouth [Citation9]. Ship et al. determined that unstimulated saliva flow rate below 0.1–0.2 mL/min indicates salivary gland hypofunction (SGH) [Citation10]. Using salivary scintigraphy, Kao et al. found hemodialysis patients who experienced dry mouth had decreased salivary gland functioning [Citation11]. A possible reason underlying the occurrence of dry mouth in dialysis patients is metabolic wastes, such as high concentration BUN and Cr, damaging the salivary gland; this in turn affects the saliva secretion function of the gland and causes the sensation of mouth dryness.
The combined effect of high concentrations of BUN and Cr, removal of water, and changes in electrolytes during the process of hemodialysis also lead to osmolality changes [Citation12,Citation13]. Osmolality changes cause redistribution of cellular water content and decreased blood flow to the kidneys resulting in metabolic changes in the renin–angiotensin system, and stimulation of osmolality receptors, which also cause dry mouth [Citation14]. Additionally, changes in osmolality and electrolytes, such as sodium and potassium, are crucial factors that can cause mouth dryness [Citation15]. The causes of decreased saliva flow may be medications, diseases, or radiotherapy. For example, anticholinergics inhibit saliva secretion. However, patients’ saliva secretion returns to normal after they stop using said medication. Similarly, the continued use of adrenergic agonist antagonists such as clondine, guanfacine and methyldopa decreases saliva secretion [Citation16–18]. Some diseases or treatments result in decreased saliva flow. For instance, Sjögren’s syndrome and patients with head and neck cancer receiving radiotherapy experience decreased saliva flow [Citation5,Citation16]. Sex, age, and smoking habits also affect mouth dryness among patients on hemodialysis [Citation15,Citation19]. Hemodialysis patients often increase their fluid intake to offset dry mouth, which can cause interdialytic weight gain; every 1% increase over a 5% weight gain increases mortality risk by 67.5% [Citation20].
The variables of saliva flow rate, and serum levels of BUN, Cr and electrolytes are all effected by treatment with hemodialysis. By examining saliva changes during the dialysis process, one can better understand the symptom of mouth dryness among patients on hemodialysis. Therefore, the aim of this study was to examine unstimulated saliva flow rates as well as BUN, Cr, and electrolyte levels in saliva samples, and to investigate the effects of hemodialysis treatment on these variables during hemodialysis and 1 h after the completion of hemodialysis. Our findings could serve as an objective basis for future nursing interventions for patients experiencing dry mouth due to chronic hemodialysis.
Materials and methods
Design
This cross-sectional study used repeated measures of saliva samples collected 1 h prior to dialysis (T1), midway through dialysis (T2), and 1 h after completion of dialysis (T3).
Participants
Participants were recruited by purposive sampling of patients with ESKD from a hemodialysis center of a regional teaching hospital in the Taoyuan area of Taiwan. Patients who met the following inclusion criteria were invited to participate in the study: between the ages of 20 and 80 years; receiving hemodialysis on a regular basis; had experienced mouth dryness in the past 4 weeks; fully conscious; able to spit out saliva; and able to communicate in Mandarin, Taiwanese, or written text. Exclusion criteria were as follows: presence of head and neck cancer and receiving radiotherapy; Sjögren’s syndrome; or had taken any of the following medications within the past week: diuretics, tricyclic antidepressants, anticholinergics, antihistamines, or antianginals.
This study was reviewed and approved by the Institutional Review Board (IRB) of the study hospital (IRB Landseed 14-025-B1). A researcher identified all eligible participants. The first author described the purpose and design of the study and assured them they had the right to withdraw at any time, without any loss of benefits to which they were otherwise entitled. All patients who agreed to participate provided written informed consent prior to data collection. Participants then filled out a survey questionnaire (described below) and a time was arranged that was determined convenient for each participant for collection of hemodialysis -related data. Participants were instructed not to engage in oral activities, such as smoking, eating, drinking, or teeth brushing, for 1 h prior to arrival at the clinic for dialysis.
Measurements
Demographic and clinical characteristics
A survey questionnaire collected data regarding demographic characteristics of participants included gender, age, and health behaviors. Clinical characteristics included smoking (yes/no), duration of hemodialysis treatment and comorbidities. Clinical data collected prior to dialysis on the day of the study included blood pressure, and serum components. Blood pressure was monitored during dialysis and recorded upon completion of dialysis. Study variables collected at T1, T2, and T3 included salivary flow rate, pH and osmolality of the saliva, and saliva components of BUN, Cr, and the electrolytes.
Measures of unstimulated whole saliva (UWS)
The UWS was collected at all three time points following the guidelines developed by the School of Dentistry of the University of Southern California [Citation21]. For each saliva collection procedure, the participants were instructed to not move their tongue or swallow (unless instructed), and to keep their eyes open. Each collection procedure consisted of requesting the participant to perform the following steps: (1) Please swallow once in order to remove excess saliva from your mouth; 92) Please hold your saliva in your mouth without swallowing for 5 min; and (at the end of 5 min) (3) Please spit your saliva into the test tube. Once the saliva collection procedure was complete, the collected saliva was stored at 4 °C for processing.
Saliva flow rate for each sample was determined by weight. The saliva was centrifuged to remove residual material or oral mucous cells (1 min @ 1000 rpm) and the upper layer was transferred to a fresh pre-weighed test tube. The solution was weighed and the volume was calculated (1 g = 1 mL). UWS (mL/min) was calculated by dividing the saliva volume by the collection time [Citation11,Citation15]. The pH, osmolality and the biochemical and electrolyte components of the saliva were then analyzed.
The pH of the saliva was determined with pH indicator strips. Salivary osmolality was measured with a freezing point depression salivary osmometer. The concentration of BUN was determined by colorimetric analysis with the absorbance set at 340/410 nm. The concentration of Cr was determined using the Jaffe alkaline picrate method with absorbance set at 505/571 nm. The concentrations of salivary sodium, potassium ions, chloride, and calcium were determined by changes in absorbance using an autoanalyzer. Absorbance was converted to concentration.
Data collection
Data from survey questionnaires were obtained in the clinic after participants provided informed consent. Saliva collection was begun when the participant’s blood pressure had stabilized, and was conducted at three timepoints: 1 h before dialysis (T1), 1 h after dialysis had begun (the midpoint of dialysis, T2), and 1 h after completion of dialysis (T3). Blood pressure data were collected at T1 and T3.
Statistical analysis
IBM SPSS Version 23 was used for data analysis. Descriptive statistics included mean, standard deviation (SD), and percentage. Generalized estimating equations (GEE) were used to analyze changes in UWS and the saliva variables at the three timepoints. The correlation matrix was selected to control for the effect of time [Citation22]. Fisher’s least significant difference (LSD) was used to conduct post-hoc comparisons. A p-value < .05 was considered significant [Citation23].
Results
A total of 100 participants with ESKD agreed to participate in this study. The mean age of participants was 62.45 years (SD = 11.09; range 34–85 years); 66% were male. The mean duration of hemodialysis for 5.10 years (SD = 4.96); 67% of participants had a comorbidity of hypertension; the mean systolic blood pressure was 143.85 mm HG (SD = 18.98). Details of participants’ demographic and clinical characteristics and components of serum plasma pre-dialysis are shown in . The oral cleaning habits of the 100 participants are listed in . In terms of brushing habits, the majority of the participants (65%) brushed their teeth twice a day (once in the morning and once at night), followed by those who brushed once a day (21%); 6% of the participants did not brush their teeth or had other oral cleaning habits. For 3% of the participants, their teeth had fallen out; thus, they did not have a habit of brushing their teeth. Furthermore, 67% of the participants gargled after eating, and only 34% of the participants visited their dentist in the past year ().
Table 1. Demographics and baseline clinical characteristics of participants prior to receiving hemodialysis for end-stage renal disease (N = 100).
Measurements of saliva flow rate, biochemical components, pH and osmolality, and electrolytes from UWS collected before and after dialysis are shown in . GEE analysis was used to examine differences between measures for the three timepoints, controlling for the effect of time. Post-hoc comparisons were conducted to examined differences among the three timepoints.
Table 2. Comparison of saliva variables before (pre-dialysis), during (mid-dialysis), and 1 h after completion of dialysis (post-dialysis) for participants (N = 100).
The mean saliva flow rate at T1 was 0.15 mL/min and flow rates increased significantly T2 and T3 compared with pre-dialysis rates (0.17 mL/min and 0.19 mL/min), respectively; Wald χ2 = 10. 40, p < .01). Post-hoc comparisons indicated the increase in saliva flow rate was only significantly higher than T1 post-dialysis (T3).
The biochemical components of BUN and Cr decreased significantly at T2 and T3 (Wald χ2 = 97.12 and 36.98, respectively; p < .001). Post-hoc comparisons showed the concentration of BUN at T3 was lower than at T2 and T2 was lower than T1, indicating a constant decrease in BUN during the course of dialysis. Post-hoc comparisons for Cr concentrations showed a significant drop from T1 to T2, and from T2 to T3, however there was no significant difference between T1 and T3.
There were also significant decreases at T2 and T3 compared with T1 for pH () (Wald χ2 = 30.13, p < .001) and osmolality () (Wald χ2 = 9.71, p < .01). Post-hoc comparisons for changes in pH value indicated there was continuous decrease in the pH of saliva during dialysis. Although osmolality was lower at T2 than T1, the difference was not significant. However, osmolality at T3 was significantly lower than at T1 and T2 was significantly lower than T3
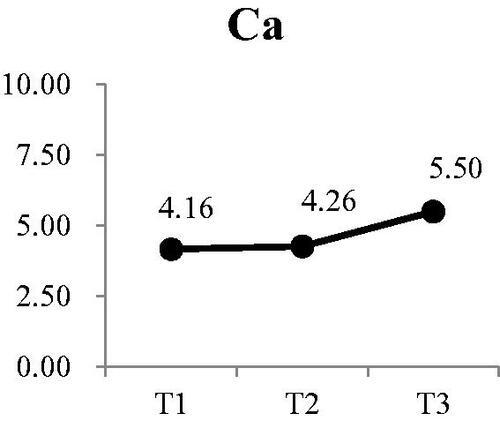
Three of the four electrolytes in the saliva showed significant changes. The was no significant change in sodium at either T2 or T3 (). There was a small, but significant decrease in potassium from a mean of 25.79 mEq/L at T1 to 22.86 mEq/L at T3 (Wald χ2 = 6.71, p < .05) (). Post-hoc comparison showed both T2 and T3 were significantly lower that T1; however, there was no difference between T2 and T3. Calcium levels in the saliva increased during dialysis, from a mean of 4.16 mEq/L at T1 to 5.50 at T3 () (Wald χ2 = 12.73, p < .01). Post-hoc comparison showed the significant increases were T3 compared to T1 and T2, with no increase from T1 to T2. The most significant change was in the concentration of chloride () (Wald χ2 = 17.64, p < .001). The greatest reduction occurred from T1 (53.36 mEq/L) to T2 (45.55 mEq/L). Although the concentration at T3, was lower than T2, the difference was not significant.
Interdialytic weight gain (IDWG) is a one of factor that influences saliva flow rate. Dialysis guidelines state that ideally, IDWG should not exceed 5% of dry weight. Therefore, we divided the participants into the IDWG < 5% and ≥ 5% subgroups and compared the differences in saliva flow rate at T1, T2, and T3 (). The results revealed significant differences in the saliva flow rate between the two subgroups at T2 and T3.
Table 3. Differences in saliva flow rate by interdialytic weight gain (IDWG).
Discussion
This study examined the of hemodialysis on saliva flow rate and components of saliva at by comparing unstimulated saliva collected pre-dialysis, at the midpoint of dialysis and 1 h post-dialysis. The saliva flow rate increased significantly after hemodialysis was complete, which is similar to results of other studies [Citation15,Citation22] in which flow rate increased during and after completion of dialysis, but was only significant between pre- and post-dialysis levels. The increase in saliva flow rate allows for an increase in removal of waste during the process of hemodialysis, which explains the lower osmolality after completion of treatment. This evidence-based information suggests the optimal time to administer an intervention to relieve dry mouth is before dialysis. Understanding a patient’s previous changes in saliva flowrate could allow nurses to administer interventions prior to dialysis according to changes in the saliva flow rate. These could include chewing gum, mouthwash, acupressure, transcutaneous electrical stimulation, or holding ice cubes in the mouth [Citation23,Citation24].
The mean unstimulated salivary flow rate prior to dialysis was 0.15 mL/min and reached 0.19 mL/min 1 h following completion of treatment. These flow rates were lower than previous studies with pre- and post-dialysis rates of 0.30 and .41, respectively [Citation25], and 0.46 and 0.83, respectively [Citation26]. The lower flowrates in our study might be due to the age of the patients in our study. The mean age for the participants in the study by Bots et al. was 54.6 years [Citation25]. The age of participants in the study by Khanum et al. included patients as young as 18 years of age, and there was no report of the mean age for all participants [Citation26]. Age-related changes in the function of the salivary gland contribute to reductions in unstimulated salivary flow rates [Citation27]. Therefore, the low rates in our study may be the result of the older age of our participants.
IDWG is related to saliva flow rate; dry mouth induces thirst, which prompts increased IDWG [Citation15,Citation28]. The present study divided participants’ IDWG by their dry weight, multiplied the quotient by 100% to obtain their IDWG%, and then classified participants into IDWG% < 5% and IDWG% ≥ 5% subgroups. A comparison revealed that the saliva flow rate of the IDWG% < 5% subgroup was greater than that of the IDWG% ≥ 5% subgroup at T1, T2, and T3, and the differences were significant at T2 and T3. After dialysis, the saliva flow rate of the IDWG% < 5% subgroup gradually increased, testimony for ongoing significantly volume depleted state, even ate rinsing back and completion of HD session. This result may be related to the ultrafiltration rate used in the hemodialysis process. The most likely line of causality was that higher UF rate resulted (as all IDWG gained in 48 h was removed in a 2 ∼ 4 h) in more actual (intravascular) volume depletion – thus leading to less gland perfusion and saliva production. A decreased saliva flow rate stimulates thirst responses; because participants in the IDWG% ≥ 5% subgroup had low saliva flow rates, they may have consumed excessive amounts of water, which would result in increased IDWG and form a correlated cycle. Marques et al. posited that although IDWG is not related to saliva flow rate, higher IDWG implies higher risks of cardiovascular diseases and mortality [Citation29]. Therefore, mitigating dry mouth symptoms in patients to further control water intake and IDWG is crucial. The study results can provide a reference for physicians to adjust dry weight.
The pH of the saliva gradually changed from weakly alkaline to almost neutral following completion of hemodialysis. These findings are in contrast to studies reporting hemodialysis resulted in no change in pH [Citation26] or a decrease in pH [Citation25]. Once again, the differences in our findings might be due to the younger age of the participants in these two studies compared with the older age of our participants. Factors such as age, sex, marital status, tobacco or soda consumption, presence of chronic diseases, tooth brushing patterns, chronic diseases, and number of missing teeth could all affect the pH value of saliva. We suggest future research should examine the relationships among saliva pH and age for patients receiving hemodialysis.
Levels of BUN, Cr, potassium, and chloride in the saliva gradually, and significantly decreased over the course of hemodialysis treatment. These changes are similar to decreases in these components when measured in blood serum. There was a significant increase in calcium concentration following dialysis. These findings provide support for a recent study by Alpdemir et al. who reported following completion of hemodialysis BUN, Cr, and potassium from saliva samples were lower than pre-dialysis levels and calcium was higher, which were similar to levels in the patients’ serum [Citation30]. The collection of saliva is preferred to collecting blood serum for clinicians, however few researchers recognize its usefulness [Citation30,Citation31]. Our findings provide further support for the use of unstimulated whole saliva for measuring BUN, Cr, and electrolytes. Developing additional assays that rely on saliva could reduce the number of blood draws or finger sticks, which would reduce the number of painful, invasive procedures experienced by patients.
In spite of its strengths, our study had some limitations. First, data were collected from only one hospital in Taiwan, which might limit the generalization of our findings. Second, the research team did not take blood samples for the purpose of a correlation analysis between saliva and serum in order to minimize discomfort for our participants. Third, we might be use technology assessment to measure volume status before dialysis in the future, such as bioimpedance spectroscopy. We suggest these studies be conducted in the future in order to strengthen our findings.
In conclusion, unstimulated whole saliva was not only useful for examining changes in saliva flow rate as a physiological indicator of mouth dryness, but was also useful for examining changes in pH, osmolality, biochemical components and electrolytes over the course of hemodialysis. The results of the current study indicated that similar to blood, saliva could also serve as an indicator for predicting patients’ physiological changes throughout the process of hemodialysis. When conducting similar studies in the future, researchers could conduct blood testing simultaneously for the comparative analysis of blood and saliva. If the relationship between saliva and blood serum can be verified by more large-sample studies, saliva may be used as a physiological monitoring indicator in the future. Besides, the results of this study provide empirical evidence for medical personnel when explaining the time of interventions in health education concerning mouth dryness; thus, the effectiveness of such health education can be maximized.
Acknowledgments
The authors wish to express their sincere appreciation to the patients who participated in this study.
Disclosure statement
No potential conflict of interest was reported by the author(s).
Figure 1. Participants’ changes in pH at each time point Participants’ changes in osmo at each time point.
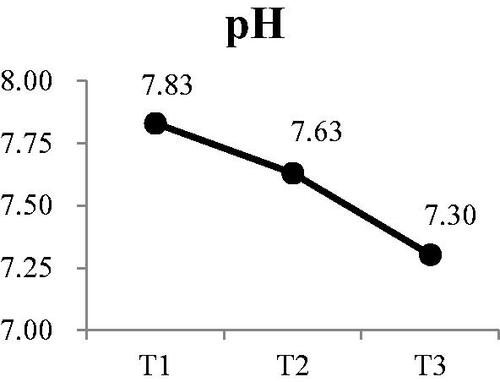
Figure 2. Participants’ changes in sodium at each time point Participants’ changes in potassium at each time point.
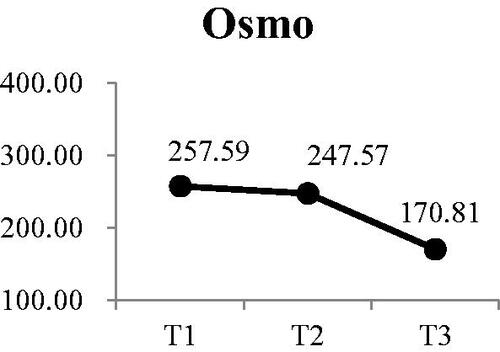
Figure 3. Participants’ changes in chloride at each time point Participants’ changes in calcium at each time point.
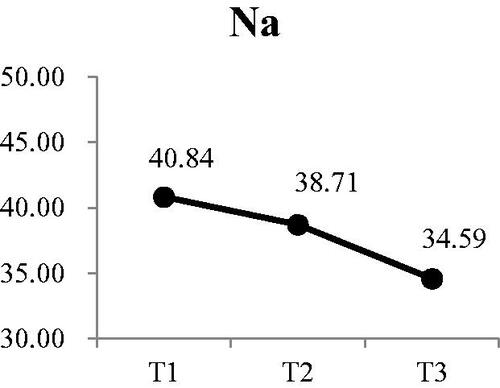
Figure 4. Participants’ changes in potassium at each time point.
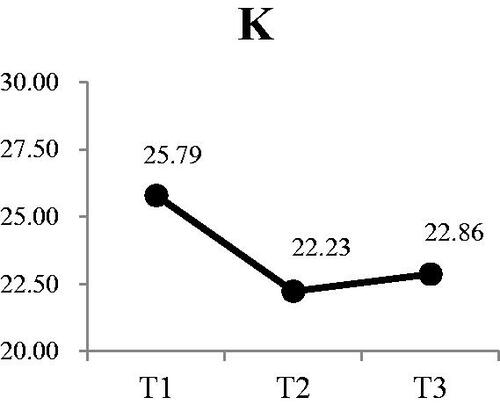
Figure 5. Participants’ changes in chloride at each time point.
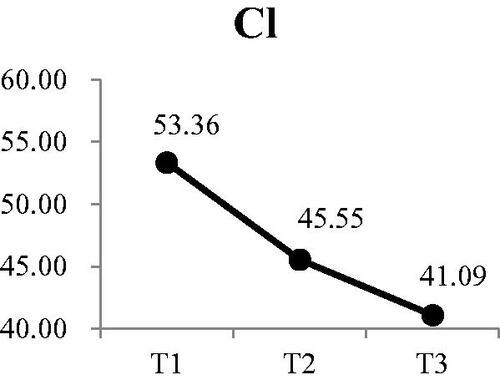
Figure 6. Participants’ changes in calcium at each time point.
Additional information
Funding
References
- United States Renal Data System. Annual Data Report. 2018; [cited 2020 Nov 30]. Available from: http://www.usrds.org.
- Ministry of Health and Welfare. Health statistics. 2018; [cited 2020 Nov 30]. Available from: https://dep.mohw.gov.tw/DOS/lp-4648-113.html.
- Lin J, Cheng Z, Ding X, et al. Acid-base and electrolyte managements in chronic kidney disease and end-stage renal disease: case-based discussion. Blood Purif. 2018;45(1–3):179–186.
- Navazesh M, Christensen C, Brightman V. Clinical criteria for the diagnosis of salivary gland hypofunction. J Dent Res. 1992;71(7):1363–1369.
- Guggenheimer J, Moore PA. Xerostomia: etiology, recognition and treatment. J Am Dent Assoc. 2003;134(1):61–69.
- Raimann JG, Kirisits W, Gebetsroither E, et al. Saliva urea dipstick test: application in chronic kidney disease. CN. 2011;76(07):23–28.
- Jensen SB, Pedersen AM, Reibel J, et al. Xerostomia and hypofunction of the salivary glands in cancer therapy. Support Care Cancer. 2003;11(4):207–225.
- Yu I-C, Tsai Y-F, Fang J-T, et al. Effects of mouthwash interventions on xerostomia and unstimulated whole saliva flow rate among hemodialysis patients: a randomized controlled study. Int J Nurs Stud. 2016;63:9–17.
- Yu IC, Huang JY, Tsai YF. Symptom cluster among hemodialysis patients in Taiwan. Appl Nurs Res. 2012;25(3):190–196.
- Ship JA, Eisbruch A, D’Hondt E, et al. Parotid sparing study in head and neck cancer patients receiving bilateral radiation therapy: one-year results. J Dent Res. 1997;76(3):807–813.
- Kao CH, Hsieh JF, Tsai SC, et al. Decreased salivary function in patients with end-stage renal disease requiring hemodialysis. Am J Kidney Dis. 2000;36(6):1110–1114.
- de la Rosa Garcia E, Padilla AM, Romo SA, et al. Oral mucosa symptoms, signs and lesions, in end stage renal disease and non-end stage renal disease diabetic patients. Patologia Oral Y Cirugia Bucal. 2006;11(6):E467–E473.
- Garcia MK, Chiang JS, Cohen L, et al. Acupuncture for radiation-induced xerostomia in patients with cancer: a pilot study. Head Neck. 2009;31(10):1360–1368.
- Yang LY, Chin CC. Physiological viewpoint of thirst in hemodialysis patients.. Chang Gung Nursing. 2009;20(2):8.
- Bots CP, Brand HS, Veerman ECI, et al. Interdialytic weight gain in patients on hemodialysis is associated with dry mouth and thirst. Kidney Int. 2004;66(4):1662–1668.
- Napeñas JJ, Brennan MT, Fox PC. Diagnosis and treatment of xerostomia (dry mouth). Odontology. 2009;97(2):76–83.
- Osterberg T, Landahl S, Hedegård B. Salivary flow, saliva, pH and buffering capacity in 70-year-old men and women. Correlation to dental health, dryness in the mouth, disease and drug treatment. J Oral Rehabil. 1984;11(2):157–170.
- Thomson WM, Lawrence HP, Broadbent JM, et al. The impact of xerostomia on oral-health-related quality of life among younger adults. Health Qual Life Outcomes. 2006;4:86.
- Cassolato SF, Turnbull RS. Xerostomia: clinical aspects and treatment. Gerodontology. 2003;20(2):64–77.
- Kimmel PL, Varela MP, Peterson RA, et al. Interdialytic weight gain and survival in hemodialysis patients: effects of duration of ESRD and diabetes mellitus. Kidney Int. 2000;57(3):1141–1151.
- Navazesh M, Kumar SKS. Measuring salivary flow: challenges and opportunities. J Am Dent Assoc. 2008;139(Suppl):35S–40S.
- Liang KY, Zeger SL. Longitudinal analysis using generalized linear models. Biometrika. 1920;73:10.
- Warner RM. Applied statistics: from bivariate through multivariate techniques. 2008. Thousand Oaks: Sage Publications.
- Bossola M. Xerostomia in patients on chronic hemodialysis: an update. Semin Dial. 2019;32(5):467–474.
- Bots CP, Brand HS, Veerman ECI, et al. Acute effects of hemodialysis on salivary flow rate and composition. Clin Nephrol. 2007;67(01):25–31.
- Khanum N, Mysore-Shivalingu M, Basappa S, et al. Evaluation of changes in salivary composition in renal failure patients before and after hemodialysis. J Clin Exp Dent. 2017;9(11):e1340–e1345.
- Xu F, Laguna L, Sarkar A. Aging-related changes in quantity and quality of saliva: where do we stand in our understanding? J Texture Stud. 2019;50(1):27–35.
- Fan W-F, Zhang Q, Luo L-H, et al. Study on the clinical significance and related factors of thirst and xerostomia in maintenance hemodialysis patients. Kidney Blood Press Res. 2013;37(4–5):464–474.
- Marques PLP, Libório AB, Saintrain MVdL. Hemodialysis-specific factors associated with salivary flow rates. Artif Organs. 2015;39(2):181–186.
- Alpdemir M, Eryilmaz M, Alpdemir MF, et al. Comparison of widely used biochemical analytes in the serum and saliva samples of dialysis patients. J Med Biochem. 2018;37(3):346–354.
- Lasisi TJ, Lawal FB. Preference of saliva over other body fluids as samples for clinical and laboratory investigations among healthcare workers in Ibadan, Nigeria. Pan Afr Med J. 2019;34:191.