
Abstract
Background
Patients with chronic kidney disease (CKD) often have structural abnormalities of the heart due to pressure and volume overload. The aim of this study was to evaluate associations between echocardiographic parameters and renal outcomes (estimated glomerular filtration rate [eGFR] slope and progression to dialysis) in patients with stage 3–5 CKD.
Methods
This longitudinal study enrolled 419 patients. Changes in renal function were assessed using the eGFR slope. Rapid renal progression was defined as an eGFR slope < −3 mL/min/1.73 m2/year, and the renal endpoint was defined as commencing dialysis.
Results
Increased left atrial diameter (LAD), ratio of left ventricular mass to body surface area (LVM/BSA), ratio of LVM to height2.7 (LVM/ht2.7), and ratio of observed to predicted LVM (o/p LVM) were associated with eGFR slope in an adjusted model, but left ventricular ejection fraction (LVEF) was not. Furthermore, LAD ≥ 4.7 cm, LVM/BSA > 115 g/m2 in males and > 95 g/m2 in females, and LVM/ht2.7 > 48 g/ht2.7 in males and > 44 g/ht2.7 in females were correlated with progression to dialysis, but o/p LVM and LVEF were not. The maximum change in χ2 change to predict renal outcomes was observed for LAD, followed by LVM/BSA and LVM/ht2.7.
Conclusions
A large LAD and increased LVM, regardless of how it was measured (LVM/BSA, LVM/ht2.7 and o/p LVM), were correlated with adverse renal outcomes in patients with CKD stage 3–5. LAD had superior prognostic value to LVM and LVEF.
Introduction
Chronic kidney disease (CKD) is a major global public health problem, characterized by a progressive deterioration in kidney function and eventually end-stage renal disease. Moreover, not all patients with CKD survive to maintenance dialysis [Citation1,Citation2]. Recent studies have reported the effect of dynamic changes in estimated glomerular filtration rate (eGFR) on the risk of mortality [Citation3,Citation4]. Therefore, identifying patients with rapidly worsening renal function is important to allow for timely and aggressive interventions to attenuate the disease and prolong survival.
CKD has been associated with a significant increase in the risk of cardiovascular disease (CVD). CKD and CVD have many shared risk factors, and abnormal cardiac structure and function are major predictors of adverse clinical outcomes [Citation5]. Patients with CKD often have structural abnormalities of the heart due to pressure and volume overload [Citation6]. Hickson et al. analyzed 654 patients who underwent echocardiography examination following initiation of hemodialysis, and revealed that echocardiography variables were associated with death over a median follow-up period of 2.4 years were left-ventricular ejection fraction (LVEF) ≤45% and right-ventricular systolic dysfunction [Citation7]. Matsuo et al. examined 315 Japanese patients with hemodialysis using transthoracic echocardiography, and showed that only 11.5% and 3.4% of all patients had normal left ventricular geometry and normal left ventricular filling pattern, respectively [Citation8]. A study in 3,487 CKD patients showed that the prevalence of left ventricular hypertrophy (LVH) was 32%, 48%, 57%, and 75% in patients with eGFR of ≥ 60, 45–59, 30–44, and <30 mL/min/1.73 m2, respectively [Citation9]. Previous studies have reported that LVH and high left atrial volume index are associated with progression to dialysis [Citation10–12]. In addition, decreased LVEF and increased left atrial diameter (LAD) have been associated with a rapid decline in renal function [Citation10,Citation13]. Therefore, heart structural and functional parameters may serve as prognostic indicators of renal outcomes in patients with CKD. However, few studies have investigated the association between echocardiographic parameters and renal outcomes in patients with CKD.
LVH has been reported to be both highly prevalent and often inappropriate in patients with CKD [Citation14,Citation15]. Appropriately indexing left ventricular mass (LVM) is necessary to minimize over- or under-estimating LVH [Citation16], and body surface area (BSA) and height raised to the power of 2.7 (ht2.7) are common indexing parameters [Citation17]. In addition, inappropriate LVM, defined as an excess increase in LVM, is common in patients with CKD as a means to compensate for alterations in hemodynamic and metabolic status [Citation18]. The ratio of observed LVM to predicted LVM (o/p LVM) can be used to assess the appropriateness of LVM. Few studies have investigated the impact of LVH classified using LVM indices on adverse clinical outcomes, and the results have been inconclusive [Citation17,Citation19]. Moreover, a comparison of the impact of LVM and its indices on renal outcomes has never been reported. Accordingly, the aim of this study was to investigate the association between echocardiographic parameters (left atrial dimension [LAD], LVM/BSA, LVM/ht2.7, o/p LVM and LVEF) and renal outcomes (eGFR slope and progression to dialysis) in patients with CKD stage 3–5.
Study patients and methods
Study patients and design
We consecutively enrolled 505 pre-dialysis patients with stages 3–5 of CKD from the Outpatient Department of Internal Medicine at a regional hospital in southern Taiwan from May 2006 to January 2010. Patients with evidence of kidney damage lasting for > 3 months were defined as having CKD, and the stage was classified according to the National Kidney Foundation-Kidney Disease Outcomes Quality Initiative (K/DOQI) guidelines [Citation20] as follows: stage 3, eGFR 30–59 mL/min/1.73 m2; stage 4, eGFR 15–29 mL/min/1.73 m2; and stage 5, eGFR < 15 mL/min/1.73 m2. We excluded patients with fewer than three eGFR readings (n = 64) during follow-up and those who were followed for <6 months (n = 22) to ensure complete data of changes in renal function. The remaining 419 patients (mean age 65.9 ± 12.3 years, 256 males) were included. The Institutional Review Board of Kaohsiung Medical University Hospital approved this study, and all participants provided written informed consent to participate in this study. All methods were performed in accordance with the appropriate guidelines.
Evaluation of cardiac structure and function
Echocardiographic examinations were performed by two experienced cardiologists who were blinded to the patients’ data using a VIVID 7 system (General Electric Medical Systems, Horten, Norway). The patients were placed in a left decubitus position, and standardized two-dimensional and guided M-mode echocardiographic imaging was performed. Left ventricular internal diameter in diastole (LVIDd), interventricular septal wall thickness in diastole (IVSTd), LAD, and left ventricular posterior wall thickness in diastolic (LVPWTd) were measured. LAD was approached from anteroposterior view. LVEF was used to assess left ventricular systolic function according to the Teichholz’ M-mode [Citation21]. The Devereux-modified method was used to calculate observed LVM as follows: observed LVM = 1.04 × [(IVSTd + LVIDd + LVPWTd)3 – LVIDd3] − 13.6 g [Citation22]. Predicted LVM was estimated as follows [Citation23]: predicted LVM = 55.37 + 6.64 × height (m2.7) + 0.64 × stroke work − 18.07 × sex (where for sex: male = 1 and female = 2). The ratio of observed LVM to predicted LVM (o/p LVM) was used to assess inappropriate LVM, and observed LVM > 28% more than the predicted value (i.e., o/p LVM > 128%) was defined as being inappropriate [Citation15,Citation23]. LVH was defined as an LVM/BSA ratio of > 115 g/m2 in men and > 95 g/m2 in women, and as LVM/ht2.7 > 48 g/ht2.7 in men and >44 g/ht2.7 in women [Citation24]. Stroke work (gm) was calculated as: (systolic blood pressure × stroke volume product) × 0.0144.
Collection of demographic, medical and laboratory data
Smoking status, demographic (age and sex) and medical (hypertension, diabetes mellitus and coronary artery disease) data were collected at baseline via chart review. Systolic and diastolic blood pressures were measured, and laboratory findings (hemoglobin, fasting glucose, triglycerides, calcium-phosphorous product and total cholesterol) were measured from fasting blood samples using an autoanalyzer (COBAS Integra 400, Roche Diagnostics GmbH, D-68298 Mannheim COBAS Integra 400). The kinetic Jaffé method was used to measure levels of serum creatinine on an autoanalyzer (Roche Diagnostics) using isotope-dilution mass spectrometry [Citation25]. The 4-variable Modification of Diet in Renal Disease (MDRD) equation was used to calculate eGFR [Citation26]. All urine and blood samples were collected within 1 month of enrollment.
Assessment of rate of renal function decline and definition of rapid renal progression
The eGFR slope (mL/min/1.73 m2/year) was used to assess the rate of decline in renal function, and was calculated as the regression coefficient between time and a minimum of three eGFR measurements after enrollment. A reduction of > 3 mL/min/1.73 m2/year (i.e., a slope < −3 mL/min/1.73 m2/year) was defined as rapid renal progression [Citation27].
Definition of renal endpoint
The renal endpoint was defined as commencing dialysis. Renal function data of the patients who reached the renal endpoint were censored at the commencement of renal replacement therapy, and the remaining patients were followed until January 2020. The National Health Insurance regulations for dialysis therapy, which are based on uremic symptoms and signs, nutritional status and laboratory data were used to determine the commencement of dialysis.
Definition of overall mortality
Cases of overall mortality were defined by two cardiologists from medical records. Disagreements were resolved after consultation with a third cardiologist. The patients were followed until death or January 2020, whichever occurred first.
Statistical analysis
Statistical analysis was performed using SPSS 19.0 for Windows (SPSS Inc. Chicago, USA). Data were expressed as percentage, mean ± standard deviation, median (25th–75th percentile) for triglycerides, and mean ± standard error of mean for eGFR slope. Between-group differences were evaluated using the chi-square test for categorical variables and the independent t-test for continuous variables. Associations between the echocardiographic parameters and eGFR slope were assessed using linear regression analysis, and the time to dialysis was modeled using a Cox proportional hazards model in three steps. The first model included age and sex. Clinical risk factors were added to the second model, and biochemical factors were added to the third model. The Kaplan-Meier method was used to plot survival curves for dialysis-free survival. A difference was considered significant at p < .05.
Results
A total of 419 CKD stage 3–5 patients were included. Their mean age was 65.9 ± 12.3 years, and there were 256 men and 163 women. A comparison of the clinical characteristics between the groups with an eGFR slope ≧ −3 (n = 304) and < −3 mL/min/1.73 m2/year (n = 115) is shown in . Compared to the patients with an eGFR slope ≧ −3, those with an eGFR slope < −3 were younger, predominantly female, had higher rates of diabetes mellitus, hypertension and coronary artery disease, higher systolic blood pressure, calcium-phosphorous product, fasting glucose, triglycerides and total cholesterol, and lower hemoglobin and baseline eGFR. With regards to the echocardiographic parameters, the patients with an eGFR slope < −3 had higher values of LAD, prevalence of LAD ≧ 4.7 cm, LVM/BSA, prevalence of LVM/BSA > 115 g/m2 in males and >95 g/m2 in females, LVM/ht2.7, prevalence of LVM/ht2.7 > 48 g/ht2.7 in males and > 44 g/ht2.7 in females, o/p LVM and prevalence of o/p LVM > 128% than those with an eGFR slope ≧ −3. Regarding outcomes, the patients with an eGFR slope < −3 had a lower eGFR slope and higher prevalence of progression to commencement of dialysis than those with an eGFR slope ≧ −3.
Table 1. Comparison of clinical characteristics between eGFR slope ≧ –3 and < –3 mL/min/1.73m2/yr.
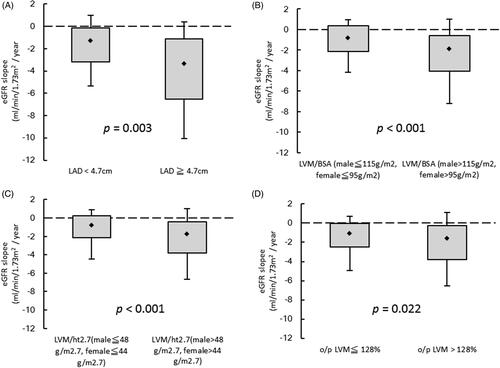
illustrates the eGFR slopes among the following four groups: (A) LAD < 4.7 cm vs. LAD ≧ 4.7 cm (–1.91 ± 0.15 vs. −3.87 ± 0.81; p = .003); (B) LVM/BSA ≦ 115 g/m2 in males and ≦ 95 g/m2 in females vs. LVM/BSA > 115 g/m2 in males and > 95 g/m2 in females (–1.13 ± 0.16 vs. −2.69 ± 0.23; p < .001); (C) LVM/ht2.7 ≦ 48 g/ht2.7 in males and ≦ 44 g/ht2.7 in females vs. LVM/ht2.7 > 48 g/ht2.7 in males and > 44 g/ht2.7 in females (–1.23 ± 0.18 vs. −3.43 ± 0.20; p < .001); (D) o/p LVM ≦ 128% vs. o/p LVM >128% (–1.59 ± 0.21 vs. −2.27 ± 0.20; p = .022).
Figure 1. The estimated glomerular filtration rate (eGFR) slopes among (A) LAD < 4.7 cm vs. LAD ≧ 4.7 cm (p = .003); (B) LVM/BSA ≦ 115 g/m2 in male and ≦ 95 g/m2 in female vs. LVM/BSA > 115 g/m2 in male and > 95 g/m2 in female (p < .001); (C) LVM/ht2.7 ≦ 48 g/ht2.7 in male and ≦ 44 g/ht2.7 in female vs. LVM/ht2.7 > 48 g/ht2.7 in male and > 44 g/ht2.7 in female (p < .001); (D) o/p LVM ≦ 128% vs. o/p LVM > 128% (p = .022).
Determinants of eGFR slope
shows the associations between echocardiographic parameters and eGFR slope in three modeling steps. LAD was associated with eGFR slope in the unadjusted model (per 1 cm; unstandardized coefficient β, −1.151; p < .001), the age-and sex-adjusted model (per 1 cm; unstandardized coefficient β, −1.177; p < .001) and in the multivariate model (1) adjusting for age, sex, diabetes mellitus, hypertension and coronary artery disease (per 1 cm; unstandardized coefficient β, −0.897; p < .001). This relationship remained significant in the multivariate model (2) after further adjusting for smoking history, systolic blood pressure ≧ 140 mmHg, fasting glucose, total cholesterol, log-transformed triglycerides, hemoglobin < 12 g/dL, baseline eGFR < 45 mL/min/1.73 m2 and calcium-phosphorous product (per 1 cm; unstandardized coefficient β, −0.736; p = .001). Similarly, LVM/BSA (per 1 g/m2; unstandardized coefficient β, −0.015; p < .001), LVM/ht2.7 (per 1 g/m2.7; unstandardized coefficient β, −0.029; p < .001) and o/p LVM (per 1%; unstandardized coefficient β, −0.006; p = .036) were significantly associated with eGFR slope with or without adjustment, but LVEF (per 1%; unstandardized coefficient β, 0.023; p = .123) was not in the multivariate model (2).
Table 2. Relation of echocardiographic parameters to eGFR slope using linear analysis.
We further performed eGFR slope analysis using the CKD Epidemiology Collaboration (CKD-EPI) Study Equation [Citation28] and found that LAD (per 1 cm; unstandardized coefficient β, −1.043; p = .003), LVM/BSA (per 1 g/m2; unstandardized coefficient β, −0.015; p = .016), and LVM/ht2.7 (per 1 g/m2.7; unstandardized coefficient β, −0.027; p = .031) were significantly associated with eGFR slope, but o/p LVM (per 1%; unstandardized coefficient β, −0.005; p = .252), and LVEF (per 1%; unstandardized coefficient β, 0.006; p = .776) were not in the multivariate model (2).
Risk of progression to dialysis
The follow-up period was 6.0 (2.1–11.0) years, during which 166 patients (39.6%) started hemodialysis. displays the relationships between echocardiographic parameters and progression to dialysis using a Cox proportional hazards model with three modeling steps. In the multivariate model (2), LAD ≧ 4.7 cm (vs. LAD <4.7 cm; hazard ratio [HR], 2.048; 95% confidence interval [CI], 1.115–3.760; p = .021), LVM/BSA > 115 g/m2 in males and > 95 g/m2 in females (vs. LVM/BSA ≦115 g/m2 in male and ≦ 95 g/m2 in female; HR, 1.547; 95% CI, 1.069–2.240; p = .021), and LVM/ht2.7 >48 g/ht2.7 in males and > 44 g/ht2.7 in females (vs. LVM/ht2.7 ≦48 g/ht2.7 in males and ≦ 44 g/ht2.7 in females; HR, 1.756; 95% CI, 1.157–2.665; p = .008) were significantly associated with progression to dialysis. However, in the multivariate model (2), o/p LVM > 128% (vs. o/p LVM ≦ 128%, p = .131), and LVEF < 50% (vs. LVEF ≧ 50%, p = .686) were not significantly correlated with progression to dialysis.
Table 3. Relation of echocardiographic parameters to progression to dialysis using Cox proportional hazards model.
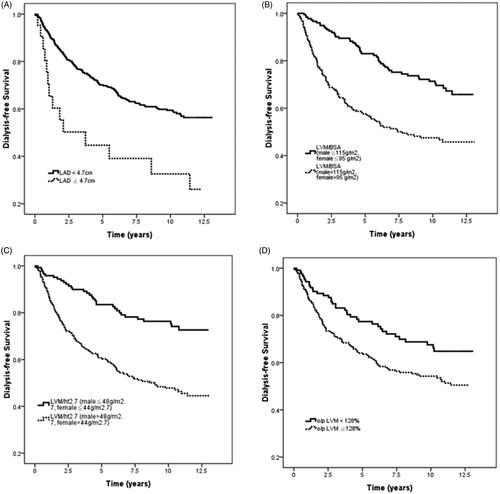
illustrates the Kaplan-Meier analyses of dialysis-free survival among the four study groups: (A) LAD < 4.7 cm vs. LAD ≧ 4.7 cm (log-rank p = .001); (B) LVM/BSA ≦ 115 g/m2 in males and ≦ 95 g/m2 in females vs. LVM/BSA > 115 g/m2 in males and > 95 g/m2 in females (log-rank p < .001); (C) LVM/ht2.7 ≦ 48 g/ht2.7 in males and ≦ 44 g/ht2.7 in females vs. LVM/ht2.7 > 48 g/ht2.7 in males and > 44 g/ht2.7 in females (log-rank p < .001); (D) o/p LVM ≦ 128% vs. o/p LVM > 128% (log-rank p = .008).
Figure 2. Kaplan-Meier analyses of dialysis-free survival among (A) LAD < 4.7 cm vs. LAD ≧ 4.7 cm (log-rank p = .001); (B) LVM/BSA ≦ 115 g/m2 in male and ≦ 95 g/m2 in female vs. LVM/BSA > 115 g/m2 in male and > 95 g/m2 in female (log-rank p < .001); (C) LVM/ht2.7 ≦ 48 g/ht2.7 in male and ≦ 44 g/ht2.7 in female vs. LVM/ht2.7 > 48 g/ht2.7 in male and > 44 g/ht2.7 in female (log-rank p < .001); (D) o/p LVM ≦ 128% vs. o/p LVM > 128% (log-rank p = .008).
We further performed Cox proportional hazards model to analysis progression to dialysis using the CKD-EPI eGFR [Citation28] and found that LAD ≧ 4.7 cm (vs. LAD < 4.7 cm; HR, 2.042; 95% CI, 1.112–3.750; p = .021), LVM/BSA > 115 g/m2 in males and > 95 g/m2 in females (vs. LVM/BSA ≦ 115 g/m2 in male and ≦ 95 g/m2 in female; HR, 1.592; 95% CI, 1.098–2.3070; p = .014), and LVM/ht2.7 > 48 g/ht2.7 in males and > 44 g/ht2.7 in females (vs. LVM/ht2.7 ≦ 48 g/ht2.7 in males and ≦ 44 g/ht2.7 in females; HR, 1.774; 95% CI, 1.170–2.692; p = .007) were significantly associated with progression to dialysis. However, in the multivariate model (2), o/p LVM >128% (vs. o/p LVM ≦ 128%, p = .127), and LVEF <50% (vs. LVEF ≧ 50%, p = .673) were not significantly correlated with progression to dialysis.
Risk of overall mortality
The median follow-up period was 11.4 (10.2–11.9) years, during which 77 of the 419 patients died (18.4%) due to CV causes (n = 37), malignancy (n = 5), infectious diseases (n = 27), gastrointestinal bleeding (n = 2), and others (n = 6). After adjusting for age, gender, smoking, diabetes mellitus, hypertension, coronary artery disease, systolic blood pressure ≧ 140 mmHg, fasting glucose, log-transformed triglyceride, total cholesterol, hemoglobin <12 g/dL, baseline eGFR < 45 mL/min/1.73m2 and calcium-phosphorous product, LAD ≧ 4.7 cm (vs. LAD <4.7 cm; HR, 2.628; 95% CI, 1.242–5.561; p = .012), and LVM/BSA > 115 g/m2 in males and >95 g/m2 in females (vs. LVM/BSA ≦ 115 g/m2 in male and ≦95 g/m2 in female; HR, 1.7337; 95% CI, 1.003–2.993; p = .049) were significantly associated with increased overall mortality. However, LVM/ht2.7 > 48 g/ht2.7 in males and >44 g/ht2.7 in females (vs. LVM/ht2.7 ≦ 48 g/ht2.7 in males and ≦ 44 g/ht2.7 in females; HR, 1.206; 95% CI, 0.693–2.099; p = .508), o/p LVM > 128% (vs. o/p LVM ≦ 128%, p = .438), and LVEF < 50% (vs. LVEF ≧ 50%, p = .383) were not significantly correlated with increased overall mortality.
Incremental values of echocardiographic parameters in relation to progression to dialysis
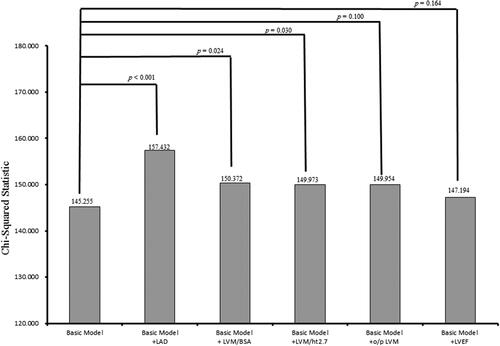
The incremental values of echocardiographic parameters in outcome prediction are shown in . The basic model included age, sex, smoking status, diabetes mellitus, hypertension, coronary artery disease, systolic blood pressure >140 mmHg, fasting glucose, log-transformed triglycerides, total cholesterol, hemoglobin <12 g/dL, baseline eGFR <45 mL/min/1.73 m2 and calcium-phosphorous product (χ2 = 145.255). Adding LAD to the basic model offered an additional benefit in the prediction of progression to dialysis (χ2 = 157.432, χ2 change = 15.177, p < .001). In addition, adding LVM/BSA and LVM/ht2.7 to the basic model resulted in significant improvements in the prediction of progression to dialysis (χ2 = 150.372, χ2 change = 5.117, p = .024; χ2 = 149.973, χ2 change = 4.718, p = .030; respectively). However, adding o/p LVM and LVEF to the basic model did not result in significant improvements in the prediction of progression to dialysis (χ2 = 147.954, χ2 change = 2.699, p = .100; χ2 = 147.194, χ2 change = 1.939, p = .164, respectively).
Figure 3. Comparison of the prediction power of addition of echocardiographic parameters to a basic model in the prediction of progression to dialysis. Addition of LAD (p < .001), LVM/BSA (p = .024), and LVM/ht2.7 (p = .030) resulted in a significant improvement in the prediction of progression to dialysis, but o/p LVM (p = .100) and LVEF (p = .164) did not.
Discussion
In this study, we evaluated the relationships between various echocardiographic parameters and renal outcomes of 419 patients with stage 3–5 CKD. The results showed that rapid renal progression was associated with large LAD and increased LVM, regardless of how it was measured (LVM/BSA, LVM/ht2.7 and o/p LVM). Furthermore, three of the parameters (LAD, LVM/BSA and LVM/ht2.7) were related to progression to dialysis. However, the relationships between LVEF and eGFR slope and progression to dialysis were insignificant.
The first important finding of this study is that the maximum change in χ2 change to predict renal outcomes was observed for LAD, followed by increased LVM. In addition to left ventricular morphologic changes, left atrial enlargement is also frequently observed in CKD patients, and previous studies have shown that LAD can serve as a predictor of clinical outcomes in CKD patients [Citation29,Citation30]. Chan et al. [Citation29] evaluated the relationship between LAD and clinical outcomes in 200 CKD patients with coronary artery disease, and found that increased indexed LAD was associated with CVD mortality. In addition, Tripepi et al. [Citation30] investigated the association between various echocardiographic parameters and death in 249 patients with end-stage renal disease, and found that left atrial volume indexed for height had better prognostic value than LVM and function. There are two principle pathophysiologies of an enlarged left atrium: pressure overload with abnormal myocyte relaxation, and volume overload with normal myocyte relaxation. Left atrial dilatation due to pressure overload is secondary to increased left atrial afterload, which is observed in the setting of mitral valve disease or left ventricular dysfunction; whereas chronic volume overload is related to valvular regurgitation and high output conditions including chronic anemia and athletic heart dilatation [Citation31]. Previous studies have also reported other risk factors for left atrial enlargement, including higher systolic and pulse pressures, duration of hypertension, overweight, and inflammatory markers [Citation32–34]. Both LVM/BSA and LVM/ht2.7 require mathematical calculations, whereas LAD can be used to quickly analyze heart function using a straight-forward method. Several important studies have indicated that left atrial enlargement can be used as a predictor of atrial fibrillation, hypertension, stroke, congestive heart failure, and cardiovascular death, which could be useful in clinical applications [Citation31,Citation35–37]. Regarding renal outcomes, Furukawa et al. [Citation12] reported that left atrial volume index was an independent risk factor for the interval before initiating dialysis in 140 patients with CKD stage 4–5, whereas we previously only found a weak association between renal outcomes and left atrial size in patients with CKD [Citation10]. In the current study, we found that a higher LAD was also independently associated with a rapid decline in renal function and progression to dialysis after adjusting for baseline eGFR. This implies that patients with a higher indexed LAD may have high left ventricular filling pressure and volume status, which may then decrease renal blood flow and increase renal efferent pressure, ultimately resulting in a progressive decline in renal function [Citation38].
The second important finding in this study is that LVM/BSA, LVM/ht2.7 and o/p LVM were all associated with rapid renal progression, and that LVM/BSA and LVM/ht2.7 were associated with an increased risk of progression to dialysis. This progressive renal-function-related decline in cardiac function in known as cardiorenal syndromes. According to The Acute Dialysis Quality Initiative (ADQI) consensus group definition in 2010 [Citation39], cardiorenal syndromes can be divided into five subcategories based on primary organ dysfunction and chronicity. The fourth type is a subset of renal impairment resulting from an increase in preload and afterload. The increase in preload is caused by the activation of xanthine oxidase and oxidative stress, consequently increasing intravascular volume expansion and ultimately leading to myocardial cell lengthening and left ventricular myocardial remodeling. The increase in afterload is caused by calcification of the aorta, which then inevitably increases systemic arterial resistance and increases arterial blood pressure. Both preload and afterload have a synergistic effect on each other, which ultimately leads to LVH [Citation40]. Paoletti et al. [Citation11] investigated the relationship between LVH and progression to dialysis in 144 patients with CKD stage 3–4, and found an independent association between a higher LVM index and progression to dialysis and a combined endpoint of dialysis or death. Our previous study also showed a significant association between concentric LVH and progression to dialysis in patients with CKD stage 3–5 [Citation10]. Several studies have reported that patients with LVH may have impaired myocardial contractility and left ventricular diastolic function [Citation41–43], and this may worsen the decline in renal function resulting in adverse renal outcomes.
In this study, the maximum change in χ2 change to predict renal outcomes was observed for LAD, followed by LVM/BSA (χ2 change = 5.117) and LVM/ht2.7 (χ2 change = 4.718). The size of a normal heart is influenced by sex, exercise, age, and ethnicity [Citation16]. LVM is influenced by body size, and appropriate indexing of LVM is necessary to minimize over- or under-estimation of LVH [Citation16]. BSA and ht2.7 are common indexing parameters [Citation17]. Although the American Society of Echocardiography (ASE) guidelines [Citation16] define LVH using LVM indexed with BSA, indexing LVM with BSA in patients with CKD is questionable, because body fluid volume status is unstable in such patients [Citation44]. Our results are in accordance with those of the study by Liao et al. [Citation45]. In their study, they analyzed 988 patients who underwent coronary angiography and found that LVH defined with LVM/BSA was associated with an increased risk of all-cause and cardiovascular mortality but that LVM/ht2.7 was not, indicating that LVM indexed with BSA may be more appropriate that LVM indexed with ht2.7. However, Zoccal et al. [Citation19] reported that LVM/ht2.7 was a stronger predictor of overall and cardiovascular mortality and cardiovascular events than LVM/BSA in 254 patients undergoing dialysis. We hypothesize that differences in volume status, based on the dialysis status of their patients, may be responsible for the different results. Compared to patients undergoing regular dialysis, pre-dialysis patients with CKD tend to have greater volume overload and volume status, and this has a greater influence on the internal diameter of the left ventricle. Therefore, we suggest that LVM/BSA may be preferable to LVM/ht2.7, especially in pre-dialysis patients with CKD.
The third important finding of this study is that o/p LVM was related to rapid renal progression, although not to progression to dialysis. Patients with CKD have many hemodynamic and metabolic disturbances, which can lead to pathophysiological changes including increased preload and afterload, neurohormonal stress response, and factors inducing atherosclerosis and myocardial fibrosis, all of which can increase LVM [Citation46–50]. In addition, Nardi et al. [Citation15] investigated inappropriate LVM, and found that patients with CKD stage 2–5 had higher inappropriate LVM than patients with hypertension and normal renal function (52.6% vs. 30.5%, p < .001). Inappropriate LVM has been associated with the risk of cardiovascular events [Citation51,Citation52]. Recently, several studies have reported the adverse impact of inappropriate LVM on cardiovascular outcomes in hypertensive patients [Citation53,Citation54]. De Simone et al. [Citation53] studied the effect of inappropriate LVM on cardiovascular outcomes in 294 patients with hypertension, and found that inappropriate LVM could predict a poor cardiovascular prognosis, even in patients without LVH. This finding implies that o/p LVM has clinical importance, and that it could serve as an early indicator of a decline in renal function.
There are several limitations to this study. First, the number of serum creatinine measurements that were used to plot the eGFR slope and the interval between them differed in each patient, and thus the eGFR slope varied between the patients. To increase the reliability of eGFR slope, we only included patients with at least three eGFR measurements, and excluded those who were followed for < 3 months. Second, left atrial volume may be more accurate than LAD in reflecting the size of the left atrial chamber. However, LAD has been shown to be a valid surrogate of the size of the left atria in several large population-based cohort studies including the Strong Heart Study [Citation37] and Losartan Intervention For Endpoint study [Citation55]. Moreover, LAD is more easily obtained than left atrial volume, and LAD measurements are already included in routine echocardiographic evaluations. Third, atrial fibrillation might influence left atrial diameter, however, we lack atrial fibrillation history of the study patients. In addition, we used Teichholz’ M-mode [Citation21] to calculate LVEF in this study, which might not accurate as biplane Simpson’s or 3D techniques. Finally, we did not evaluate volume status, and therefore we could not evaluate the effect of volume overload in our pre-dialysis patients with CKD.
In conclusion, we demonstrated that large LAD and increased LVM, regardless of how it was measured (LVM/BSA, LVM/ht2.7 and o/p LVM) were correlated with adverse renal outcomes in CKD stage 3–5 patients. LAD had better prognostic value than LVM and LVEF. Assessing echocardiographic parameters may be useful to identify patients with CKD stage 3–5 at high risk of adverse renal outcomes.
Disclosure statement
No potential conflict of interest was reported by the author(s).
References
- Hwang SJ, Lin MY, Chen HC, et al. Increased risk of mortality in the elderly population with late-stage chronic kidney disease: a cohort study in Taiwan. Nephrol Dial Transplant. 2008;23(10):3192–3198.
- O’Hare AM, Choi AI, Bertenthal D, et al. Age affects outcomes in chronic kidney disease. J Am Soc Nephrol. 2007;18(10):2758–2765.
- Perkins RM, Bucaloiu ID, Kirchner HL, et al. GFR decline and mortality risk among patients with chronic kidney disease. Clin J Am Soc Nephrol. 2011;6(8):1879–1886.
- Stevens LA, Li S, Wang C, et al. Prevalence of CKD and comorbid illness in elderly patients in the United States: results from the Kidney Early Evaluation Program (KEEP). Am J Kidney Dis. 2010;55(3):S23–S33.
- Glassock RJ, Pecoits-Filho R, Barberato SH. Left ventricular mass in chronic kidney disease and ESRD. Clin J Am Soc Nephrol. 2009;4(Suppl 1):S79–S91.
- Stewart GA, Gansevoort RT, Mark PB, et al. Electrocardiographic abnormalities and uremic cardiomyopathy. Kidney Int. 2005;67(1):217–226.
- Hickson LJ, Negrotto SM, Onuigbo M, et al. Echocardiography criteria for structural heart disease in patients with end-stage renal disease initiating hemodialysis. J Am Coll Cardiol. 2016;67(10):1173–1182.
- Matsuo H, Dohi K, Machida H, et al. Echocardiographic assessment of cardiac structural and functional abnormalities in patients with end-stage renal disease receiving chronic hemodialysis. Circ J. 2018;82(2):586–595.
- Park M, Hsu C, Li Y, et al. Associations between kidney function and subclinical cardiac abnormalities in CKD. J Am Soc Nephrol . 2012;23(10):1725–1734.
- Chen SC, Su HM, Hung CC, et al. Echocardiographic parameters are independently associated with rate of renal function decline and progression to dialysis in patients with chronic kidney disease. Clin J Am Soc Nephrol. 2011;6(12):2750–2758.
- Paoletti E, Bellino D, Gallina AM, et al. Is left ventricular hypertrophy a powerful predictor of progression to dialysis in chronic kidney disease? Nephrol Dial Transplant. 2011;26(2):670–677.
- Furukawa M, Io H, Tanimoto M, et al. Predictive factors associated with the period of time before initiation of hemodialysis in CKD stages 4 and 5. Nephron Clin Pract. 2011;117(4):c341–347.
- Shlipak MG, Katz R, Kestenbaum B, et al. Clinical and subclinical cardiovascular disease and kidney function decline in the elderly. Atherosclerosis. 2009;204(1):298–303.
- Cioffi G, Tarantini L, Frizzi R, et al. Chronic kidney disease elicits excessive increase in left ventricular mass growth in patients at increased risk for cardiovascular events. J Hypertens. 2011;29:565–573.
- Nardi E, Palermo A, Mule G, et al. Left ventricular hypertrophy and geometry in hypertensive patients with chronic kidney disease. J Hypertens. 2009;27:633–641.
- Marwick TH, Gillebert TC, Aurigemma G, et al. Recommendations on the Use of Echocardiography in Adult Hypertension: A Report from the European Association of Cardiovascular Imaging (EACVI) and the American Society of Echocardiography (ASE). J Am Soc Echocardiogr. 2015;28(7):727–754.
- Cuspidi C, Facchetti R, Bombelli M, et al. Differential value of left ventricular mass index and wall thickness in predicting cardiovascular prognosis: data from the PAMELA population. Am J Hypertens. 2014;27(8):1079–1086.
- Palmieri V, de Simone G, Roman MJ, et al. Ambulatory blood pressure and metabolic abnormalities in hypertensive subjects with inappropriately high left ventricular mass. Hypertension. 1999;34(5):1032–1040.
- Zoccali C, Benedetto FA, Mallamaci F, et al. Prognostic impact of the indexation of left ventricular mass in patients undergoing dialysis. J Am Soc Nephrol. 2001;12:2768–2774.
- Initiative KDOQ. K/DOQI clinical practice guidelines for chronic kidney disease: evaluation, classification, and stratification. Am J Kidney Dis. 2002;39:S1–S266.
- Teichholz L, Kreulen T, Herman M, et al. Problems in echocardiographic volume: echocardiographicangiographic correlations in the presence or absence of asynergy. Am J Cardiol. 1976;37(1):7–11.
- Devereux RB, Alonso DR, Lutas EM, et al. Echocardiographic assessment of left ventricular hypertrophy: comparison to necropsy findings. Am J Cardiol. 1986;57(6):450–458.
- de Simone G, Devereux RB, Kimball TR, et al. Interaction between body size and cardiac workload: influence on left ventricular mass during body growth and adulthood. Hypertension. 1998;31(5):1077–1082.
- Marwick TH, Gillebert TC, Aurigemma G, et al. Recommendations on the use of echocardiography in adult hypertension: a report from the European Association of Cardiovascular Imaging (EACVI) and the American Society of Echocardiography (ASE). Eur Heart J Cardiovasc Imag. 2015;16(6):577–605.
- Vickery S, Stevens PE, Dalton RN, et al. Does the ID-MS traceable MDRD equation work and is it suitable for use with compensated Jaffe and enzymatic creatinine assays? Nephrol Dial Transplant. 2006;21(9):2439–2445.
- Levey AS, Bosch JP, Lewis JB, et al. A more accurate method to estimate glomerular filtration rate from serum creatinine: a new prediction equation. Modification of Diet in Renal Disease Study Group. Ann Intern Med. 1999;130(6):461–470.
- Shlipak MG, Katz R, Kestenbaum B, et al. Rapid decline of kidney function increases cardiovascular risk in the elderly. J Am Soc Nephrol. 2009;20(12):2625–2630.
- Levey AS, Lesley AS, Schmid CH, et al. A new equation to estimate glomerular filtration rate. Ann Intern Med. 2009;150(9):604–612.
- Chan MY, Wong HB, Ong HY, et al. Prognostic value of left atrial size in chronic kidney disease. Eur J Echocardiogr. 2008;9(6):736–740.
- Tripepi G, Benedetto FA, Mallamaci F, et al. Left atrial volume in end-stage renal disease: a prospective cohort study. J Hypertens. 2006;24:1173–1180.
- Abhayaratna WP, Seward JB, Appleton CP, et al. Left atrial size: physiologic determinants and clinical applications. J Am Coll Cardiol. 2006;47(12):2357–2363.
- Kim BS, Jeon DS, Shin MJ, et al. Persistent elevation of C-reactive protein may predict cardiac hypertrophy and dysfunction in patients maintained on hemodialysis. Am J Nephrol. 2005;25(3):189–195.
- Vaziri SM, Larson MG, Lauer MS, et al. Influence of blood pressure on left atrial size. The Framingham Heart Study. Hypertension. 1995;25(6):1155–1160.
- Xu JZ, Wu SY, Yan YQ, et al. Left atrial diameter, flow-mediated dilation of brachial artery and target organ damage in Chinese patients with hypertension. J Hum Hypertens. 2012;26(1):41–47.
- Todaro MC, Choudhuri I, Belohlavek M, et al. New echocardiographic techniques for evaluation of left atrial mechanics. Eur Heart J Cardiovasc Imag. 2012;13(12):973–984.
- Tsang TS, Barnes ME, Gersh BJ, et al. Left atrial volume as a morphophysiologic expression of left ventricular diastolic dysfunction and relation to cardiovascular risk burden. Am J Cardiol. 2002;90(12):1284–1289.
- Kizer JR, Bella JN, Palmieri V, et al. Left atrial diameter as an independent predictor of first clinical cardiovascular events in middle-aged and elderly adults: the Strong Heart Study (SHS). Am Heart J. 2006;151(2):412–418.
- Bock JS, Gottlieb SS. Cardiorenal syndrome: new perspectives. Circulation. 2010;121(23):2592–2600.
- Ronco C, Ronco F. Cardio-renal syndromes: a systematic approach for consensus definition and classification. Heart Fail Rev. 2012;17(2):151–160.
- Di Lullo L, Gorini A, Russo D, et al. Left ventricular hypertrophy in chronic kidney disease patients: from pathophysiology to treatment. Cardiorenal Med. 2015;5(4):254–266.
- Muiesan ML, Salvetti M, Monteduro C, et al. Left ventricular concentric geometry during treatment adversely affects cardiovascular prognosis in hypertensive patients. Hypertension. 2004;43(4):731–738.
- Palatini P, Visentin P, Mormino P, et al. Left ventricular performance in the early stages of systemic hypertension. HARVEST Study Group. Hypertension and Ambulatory Recording Venetia Study. Am J Cardiol. 1998;81(4):418–423.
- Wachtell K, Smith G, Gerdts E, et al. Left ventricular filling patterns in patients with systemic hypertension and left ventricular hypertrophy (the LIFE study). Losartan Intervention For Endpoint. Am J Cardiol. 2000;85(4):466–472.
- Hassan MO, Duarte R, Dix-Peek T, et al. Correlation between volume overload, chronic inflammation, and left ventricular dysfunction in chronic kidney disease patients. Cardiorenal Med. 2016;86(S1):131–135.
- Liao Y, Cooper RS, Durazo-Arvizu R, et al. Prediction of mortality risk by different methods of indexation for left ventricular mass. J Am Coll Cardiol. 1997;29(3):641–647.
- Ritz E. Heart and kidney: fatal twins? Am J Med. 2006;119(5 Suppl 1):S31–S39.
- Levin A, Singer J, Thompson CR, et al. Prevalent left ventricular hypertrophy in the predialysis population: identifying opportunities for intervention. Am J Kidney Dis. 1996;27(3):347–354.
- Levin A, Thompson CR, Ethier J, et al. Left ventricular mass index increase in early renal disease: impact of decline in hemoglobin. Am J Kidney Dis. 1999;34(1):125–134.
- Randomised trial of cholesterol lowering in 4444 patients with coronary heart disease: the Scandinavian Simvastatin Survival Study (4S). Lancet. 1994;344:1383–1389.
- Hunter JJ, Chien KR. Signaling pathways for cardiac hypertrophy and failure. N Engl J Med. 1999;341(17):1276–1283.
- de Simone G, Kitzman DW, Palmieri V, et al. Association of inappropriate left ventricular mass with systolic and diastolic dysfunction: the HyperGEN study. Am J Hypertens. 2004;17(9):828–833.
- Mureddu GF, Pasanisi F, Palmieri V, et al. Appropriate or inappropriate left ventricular mass in the presence or absence of prognostically adverse left ventricular hypertrophy. J Hypertens. 2001;19:1113–1119.
- de Simone G, Palmieri V, Koren MJ, et al. Prognostic implications of the compensatory nature of left ventricular mass in arterial hypertension. J Hypertens. 2001;19:119–125.
- de Simone G, Verdecchia P, Pede S, et al. Prognosis of inappropriate left ventricular mass in hypertension: the MAVI Study. Hypertension. 2002;40(4):470–476.
- Gerdts E, Wachtell K, Omvik P, et al. Left atrial size and risk of major cardiovascular events during antihypertensive treatment: losartan intervention for endpoint reduction in hypertension trial. Hypertension. 2007;49(2):311–316.