
Abstract
Background
End-stage renal disease (ESRD) is the final stage during the development of renal failure. Depression is the most common psychiatric disorder in patients with ESRD, which in turn aggravates the progression of renal failure, however, its underlying mechanism remains unclear. This study aimed to reveal the pathogenesis and to discover novel peripheral biomarkers for ESRD patients with depression through metabolomic analysis.
Methods
Ultra-high-performance liquid chromatography coupled with mass spectrometry (UPLC-MS) was used to explore changes of serum metabolites among healthy controls, ESRD patients with or without depression. The differential metabolites between groups were subjected to clustering analysis, pathway analysis, receiver operating characteristic (ROC) curve analysis.
Results
A total of 57 significant serum differential metabolites were identified between ESRD patients with or without depression, which were involved in 19 metabolic pathways, such as energy metabolism, glycerolipid metabolism, and glutamate-centered metabolism. Moreover, the area under the ROC curve of gentisic acid, uric acid, 5-hydroxytryptamine, 2-phosphoglyceric acid, leucyl-phenylalanine, propenyl carnitine, naloxone, pregnenolone, 6-thioxanthene 5'-monophosphate, hydroxyl ansoprazole, zileuton O-glucuronide, cabergoline, PA(34:2), PG(36:1), probucol and their combination was greater than 0.90.
Conclusions
Inflammation, oxidative stress and energy metabolism abnormalities, glycerolipid metabolism, and glutamate-centered metabolism are associated with the pathogenesis of ESRD with depression, which may be promising targets for therapy. Furthermore, the identified differential metabolites may serve as biomarkers for the diagnosis of ESRD patients with depression.
1. Background
End-stage renal disease (ESRD) is the final stage of acute and chronic renal failure with accumulated metabolites and toxic substances, disordered electrolytes and acid-base balance, as well as some endocrine dysfunction, resulting in a series of autotoxic symptoms [Citation1–4]. Depression is the most common psychological disorder, with a prevalence rate as high as 20–25% in patients with ESRD [Citation5,Citation6]. Depression has been identified as a complicating comorbid diagnosis in ESRD, shown as low mood, slow thinking, cognitive impairment, physical symptoms and even suicide [Citation7–11]. There is overwhelming evidence that chronic illness with depression is associated with increased symptom burden and functional impairment, poor quality of life, nonadherence to treatment, and worse clinical outcomes [Citation12–14]. Nevertheless, the pathogenesis of ESRD patients with depression remains unclear.
The kidney is a metabolically active organ involved in the handling of biochemical classes of metabolites [Citation2,Citation15–17]. One of the hallmarks of progression to ESRD is the plasma accumulation of certain metabolites and uremic solutes [Citation18]. Therefore, the metabolomic profiling of patients with ESRD may be a promising method to identify new biomarkers for the prognosis of ESRD patients [Citation19]. Ultra-performance liquid chromatography coupled with mass spectrometry (UPLC-MS) has high selectivity, high sensitivity, and good time-retention reproducibility, thereby suitable for metabolome analysis, especially for non-targeted metabolomics study [Citation20–24]. Previous studies have demonstrated the dysregulation of various metabolites in CKD [Citation18,Citation25,Citation26], while other studies have revealed that the levels of fatty acid metabolism, particularly the polyunsaturated fatty acids (PUFAs) metabolism, and purine metabolism, are significantly different between depressed and nondepressed patients [Citation27]. However, there is no metabolomic study focusing on ESRD patients with depression to our best knowledge.
In this study, we aim to perform metabolomics analysis to discover new biomarkers for depression in ESRD and its possible underlying mechanisms.
2. Methods
2.1. Study populations
All participants had signed written informed consent papers before the study. The procedures were approved by the Ethics Committee of Chongqing Medical University. From January 2016 to July 2017, 17 ESRD patients without depression, and 17 ESRD patients with depression in the Department of Nephrology in the Second Affiliated Hospital of Chongqing Medical University were enrolled. The determination of depression was according to Hamilton Depression Rating Scale for Depression (HAMD) [Citation28]: depression group with total score >17 points, and nondepression group with a total score ≤17 points. Hamilton Anxiety Scale (HAMA) was used to assess anxiety symptoms in subjects. Additionally, 12 healthy participants with matched age, gender, and body mass index (BMI) recruited from the physical examination center were included, and structured interview to exclude the psychiatric diagnosis.
Inclusion criteria were as follows: (1) Confirmed as chronic renal failure uremia; (2) Serum creatinine >707 mmol/L and endogenous creatinine clearance <15 mL/(min·1.73m2); (3) The diagnosis and treatment of the disease were informed; (4) With normal liver function and blood glucose fluctuation range of 5.4–11.2 mM; (5) Brain computed tomography and magnetic resonance imaging showed no new lesions; (6) No previous history of drug abuse, mental illness were all excluded.
2.2. Sample and clinical data collection
The blood is collected before the patient starts the dialysis course and all participants underwent venous blood collection 10 h after fasting. Collected blood was stored at 4 °C for 30–60 min followed by centrifugation at 3000 g for 10 min, and the supernatant was stored. The samples were stored at −80 °C with drikold as cold chain during transport. All participants underwent routine including height, weight, blood pressure, and BMI as well as blood tests. Plasma biochemical indicators for participants are shown in .
Table 1. Demographic and clinical characteristics of the three groups.
2.3. Sample preparation
Before analysis, every frozen plasma sample was thawed and dissolved at 4 °C. A mixture of acetonitrile/methanol (75:25 v/v, 300 μl) (Merck, Germany) was added to plasma (100 μl) to precipitate proteins. After vortexing for 60 s, the mixture was stood for 10 min and then centrifuged at 12,000 g/min for 10 min at 4 °C. The supernatant was filtered through 0.22-μm syringe filters (Jinteng, China) and then analyzed by UPLC-MS. Samples were subjected to quality control (QC) by pooling equal volumes of different individual serum samples to assess the reproducibility and reliability of the UPLC-MS system. QC of mixed samples was interspersed at the start, middle, and end of the test.
2.4. Liquid chromatography-mass spectrometry (LC-MS) analysis
LC separation was performed on the ZORBAX Eclipse Plus C18 column (2.1 × 100 mm, 3.5 μm; Agilent, USA). The column was maintained at 45 °C. A 10 μl sample was injected into the column for each run in the full loop injection mode. The flow rate of the mobile phase was 0.5 mL/min. Gradient elution was performed with the following solvent system: (A) 0.1% formic acid-water, (B) acetonitrile with 0.1% formic acid. The gradient started with 98% A and decreased to 10% A in 13 min, holding at 10% A for 3 min, and then turned to 98% A immediately, holding at 98% A for 4 min. MS experiments were performed on Triple TOF 5600+, an orthogonal accelerated time of flight mass spectrometer (AB SCIEX, USA) equipped with an electrospray ion source. Data were acquired in positive and negative-V-geometry modes for each LC-MS analysis. The MS parameters were as follows: capillary voltages 2500 and 3000 V, cone gas 50 L/h, desolvation gas 600 L/h, source temperature 120 °C and desolvation temperature 500 °C. The scan range was from 50 to 1500 m/z in the full scan mode and data were collected in centroid mode. Data were centralized during acquisition using independent reference lock-mass ions via the Analyst TF 1.6 and Marker View 1.2.1.
Metabolites were identified by searching the free databases of the Human Metabolome Database (HMDB) [Citation29]. The mass tolerance for the HMDB database search was set at 0.05 Da. The chromatographic retention behavior was used to reduce false-positive matches.
2.5. Statistical analysis
The multivariate analyses including unsupervised principal component analysis (PCA), supervised partial least squares discriminant analysis (PLS-DA) and orthogonal projections to latent structures discriminant analysis (OPLS-DA), were conducted to determine the distributions and identify the metabolic difference in two or three groups using the MetaboAnalyst 4.0 [Citation30]. The parameter R2 was used to evaluate the fitting condition of the PLS-DA models, and Q2 was used to assess the predictive ability. These parameters ranged from 0 to 1, where 1 indicated a perfect fit. When the values of R2 and Q2 were >0.5, the model considered to be successful. To avoid overfitting, 7-fold cross-validation and response permutation testing (RPT) were used for model validation [Citation31]. In the PLS-DA model, variables with variable important in projection (VIP) >1 considered to be potentially differential metabolites. Meanwhile, a single variable statistical analysis was performed on the identified metabolites.
Partial Least Squares Discrimination Analysis (PLS-DA) or Orthogonal PLS-DA (OPLS-DA) is a supervised discriminant analysis statistical method. This method uses PLS-DA to establish a model of the relationship between the expression of metabolites and the sample category to realize the prediction of the sample category. Establish a PLS-DA model or OPLS-DA model for group comparisons, and calculate the variable importance for the projection (Variable Importance for the Projection, VIP) to measure the influence of the expression pattern of each metabolite on the classification of each group of samples. And interpretation capabilities, thereby assisting the screening of marker metabolites.
Welch’s t-test was used to compare the two groups that were correlated with the intensities of the integrated regions using MetaboAnalyst 4.0, and p < 0.05 was considered statistically significant. Moreover, peaks with consistently upregulated or downregulated were identified, the regional intensity data of which were used in hierarchical cluster analysis and metabolic pathway analysis.
2.6. Pathway analysis
The differential metabolites were subjected to pathway analysis with Metaboanalyst followed by visualization. Additional powerful pathway enrichment analysis was conducted by Metabolite Set Enrichment Analysis (MSEA). Pearson’s r correlation was calculated to evaluate the relations among the biomarkers (p < 0.05, impact >0.01).
2.7. Receiver operating characteristic (ROC) curve analysis
ROC curve was used to investigate the diagnostic value of differential metabolites. The area under the ROC curve (AUC) indicates the overall ability of the test. A test with an AUC greater than 0.9 has high accuracy, while 0.7–0.9 indicates moderate accuracy, 0.5–0.7 indicates low accuracy and 0.5 a chance result. ROC curve was obtained using the SPSS 25.0 software.
3. Results
3.1. Biochemical characteristics
The demographics and clinical characteristics of the subjects are shown in . There was no significant difference in age, gender, and BMI between ESRD patients (with or without depression) and healthy controls. the levels of neutrophilic granulocyte% (N%), systolic blood pressure (SBP), diastolic blood pressure (DBP), triglyceride (TG), creatinine (Cr), blood urea nitrogen (BUN), blood potassium (K+), phosphorus and depression scores were significantly increased, while the levels of total cholesterol (TC), hemoglobin (HB) and albumin were significantly decreased in the patients with ESRD (with or without depression) compared with the healthy controls. Moreover, the N% of anxiety score and depression scores were significantly increased in ESRD patients with depression compared with ESRD patients without depression.
3.2. Multivariate analysis of UPLC-QTOF/MS
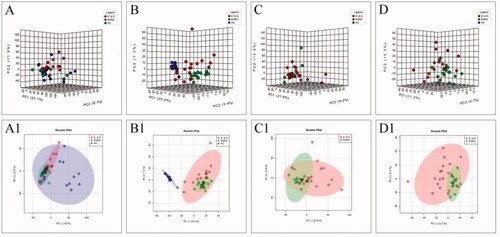
The distribution of samples, rationality of the experimental design, and homogeneity of biological replicates were determined by PCA. As shown in the score plot in positive or negative ion modes, ESRD patients without depression were separated from controls, but ESRD patients without depression and with depression were not separated ().
Figure 1. The score plots of PCA model in positive-ion mode (A, C) and negative-ion mode (B, D); A(A1) and B(B1) show health controls, ESRD patients without depression and ESRD patients with depression; C(C1) and D(D1) show ESRD patients without depression and ESRD patients with depression.
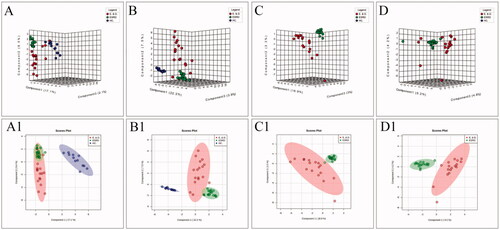
To improve the separation of the three groups, PLS-DA and SPLS-DA were performed to visualize their metabolic differences. The score plots of PLS-DA are shown in . After the response replacement test of these score plots, there was no overfitting, indicating that the PLS-DA model was successfully constructed. Moreover, in both positive- and negative-ion modes, the three groups were well separated in the SPLS-DA score plot, especially in ESRD patients without depression and ESRD patients with depression (). All models were cross-validated and no overfitting was identified. These results indicated that ESRD patients without depression and ESRD patients with depression had different metabolic characteristics.
Figure 2. The score plots of PLS-DA model in positive-ion mode (A, C) and negative-ion mode (B, D); A(A1) and B(B1) show health controls, ESRD patients without depression and ESRD patients with depression; C(C1) and D(D1) show ESRD patients without depression and ESRD patients with depression.
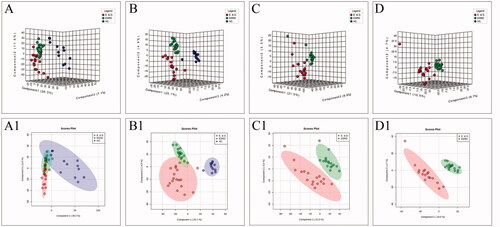
Figure 3. The score plots of the three groups of SPLS-DA model in positive-ion mode (A, C) and negative-ion mode (B, D); A(A1) and B(B1) show health controls, ESRD patients without depression and ESRD patients with depression; C(C1) and D(D1) show ESRD patients without depression and ESRD patients with depression.
3.3. Differential metabolite analysis and identification
According to the VIP values of characteristic variables obtained from the cross-validated OPLS-DA model, the potential markers were further screened. Variables with FC >5 or FC <0.1, VIP >1 and p < 0.05 were considered as potential markers and were structurally identified. A total of 643 ions that were differential between ESRD patients and healthy control. 459 ions in ESRD patients with depression vs. healthy controls, 57 metabolites in ESRD patients without depression vs. ESRD patients with depression were identified. The differential metabolites were mapped to HMDB to identify specific substances. Qualitative results and related information of differential metabolites were screened in positive and negative ion modes. showed the results of ESRD patients without depression vs. ESRD patients with depression.
Table 2. Characteristic compounds of ESRD patients without depression vs. ESRD patients with depression.
3.4. Clustering analysis
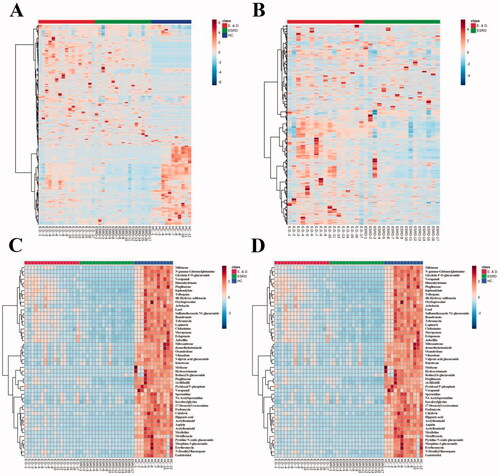
The heatmaps of the differential metabolites are shown in , which provide an intuitive understanding of the relative content of each metabolite. Bidirectional clustering of samples and metabolites was performed on all metabolites using the hierarchical clustering analysis. Clustering analysis for the metabolomics data, using a dendrogram accompanied the head map, has the potential for estimating relationships among these differential metabolites.
Figure 4. Thermogram of the relative content of differential metabolites: (A) is three groups; (B) shows ESRD patients without depression and ESRD patients with depression. (C) Shows the analytical heat map of the 50 metabolite contents with the largest differences between the three groups. (D) Shows the analytical heat map of the 50 metabolite contents with the largest difference between the two groups.
3.5. Pathway analysis
A pathway analysis of differential compounds was performed using the KEGG database. The relevant influence scores (-log(p) >0.5, impact >0.01) of metabolic pathways enriched by the differential compound in ESRD patients without depression vs. ESRD patients with depression are shown in . For simplicity, the metabolic pathways were converted into a pathway overview map, each point representing one pathway (). The abscissa is the importance value of the compound in the pathway, and the ordinate is the negative logarithm of the p-value log with a base of 10; the closer to the upper right corner, the more significant the enrichment represents and the more important the role of the compound plays in the pathway. There were 19 differential serum metabolite pathways in ESRD patients without depression vs. ESRD patients with depression, and 16 of them were key pathways.
Figure 5. Scores of metabolite pathways involved by differential metabolites in ESRD patients without depression vs. ESRD patients with depression. The size and color of each circle are based on pathway impact value and p value, respectively.
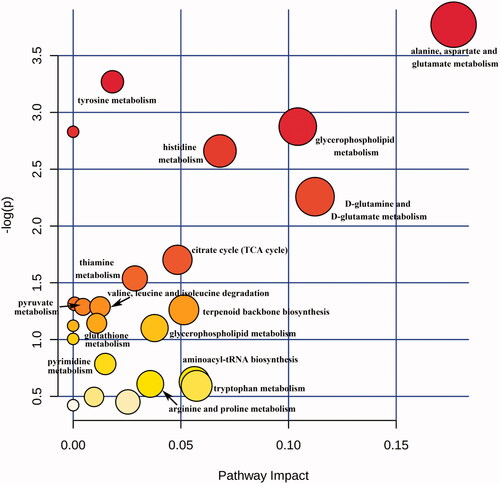
Table 3. Different metabolite pathway in ESRD patients without depression versus ESRD patients with depression.
3.6. ROC analysis
To obtain a simple metabolite combination that can separate ESRD patients and ESRD patients with depression in clinical practice, we further analyzed the 57 differential metabolites in the main metabolic pathway. To investigate the diagnostic value of these differential metabolites, ROC curve analysis was conducted to assess the sensitivity and specificity of these metabolites. The compounds with AUC >0.90 are shown in .
Table 4. The metabolites for the diagnosis of ESRD with depression (AUC ≥0.90).
4. Discussion
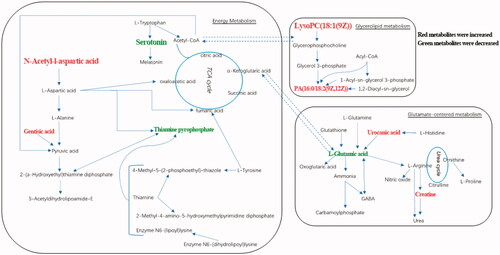
This study examined serum metabolite differences between ESRD patients/ESRD patients with depression and healthy controls, and between ESRD patients and ESRD patients with depression. Based on the pattern recognition method and the recognition model (PLS-DA, OPLS-DA), metabolite changes between groups were distinguished, and satisfactory model parameters were obtained. Through multivariate and univariate statistical analyses, the unique metabolic patterns related to ESRD were also obtained. The differential metabolites in ESRD patients and healthy controls were involved in metabolic pathways such as alanine, aspartate and glutamate metabolism, phenylalanine metabolism, glutathione metabolism, and cysteine and methionine metabolism. ESRD patients with depression were significantly different from ESRD patients without depression in metabolic pathways, such as energy metabolism, glycerolipid metabolism and glutamate-centered metabolism (). Additionally, differential metabolites with high diagnostic performance may serve as potential diagnostic markers for distinguishing ESRD patients with or without depression.
Figure 6. Biochemical transformation of differential metabolites. ESRD patients with depression compared with ESRD patients without depression, red metabolites have increased and green metabolites decreased.
4.1. Metabolic disorders in ESRD patients
4.1.1. Clinical biochemical characteristics of ESRD patients
Compared with the healthy control group, the levels of SBP, DBP, TG, Cr, BUN, K+, phosphate and depression scores of the ESRD patients without depression were significantly increased, while HB and albumin were significantly decreased. These biochemical changes were consistent with hypertension, azotemia, and anemia in ESRD patients, and suggested a high inflammatory response in ESRD patients.
4.1.2. Reduction of antioxidants
Glutathione, taurine and hypotaurine metabolism, as well as cysteine and methionine metabolic pathways, are abnormal in ESRD patients and metabolites in these pathways such as S-adenosyl methionine (SAM), glutathione (GSH) and taurocholic acid antioxidants were lower than that of the healthy controls. The GSH structure contains an active sulfhydryl group (–SH) that is easily oxo-dehydrogenated; studies have shown that SAM inhibits the strong inflammatory and oxidative stress processes that occur in patients [Citation32]. Therefore, ESRD patients have reduced antioxidant capacity and may have oxidative stress damage in vivo, which is consistent with the previous findings [Citation33,Citation34].
4.1.3. Metabolic disorders of aromatic amino acids
Phenylalanine, tyrosine, and tryptophan belong to aromatic amino acids, in which phenylalanine is catalyzed by phenylalanine hydroxylase to form tyrosine, and tyrosine is further metabolized to produce catecholamine (dopamine, norepinephrine, and epinephrine) [Citation35]. Compared with the healthy controls, the tyrosine content of the ESRD patients without depression was significantly decreased, which was consistent with previous studies [Citation36], and the significantly decreased tyrosine level was also observed in patients and animal models with CKD [Citation37–39]. In addition, patients with ESRD had a significantly decreased kynurenine level and a significantly increased 3-hydroxyanthranilic acid (3-HANA) level than healthy controls [Citation40]. Tryptophan is mainly metabolized by the kynurenine pathway and the serotonin metabolic pathway, the former being more than 95% in mammals [Citation41]; kynurenine can inhibit antigen presentation, suppress the immune response, and ultimately reduce inflammation [Citation42]. However, 3-HANA is neurotoxic and induces the formation of free radicals such as hydroxyl radicals and hydrogen peroxide, and raises the level of oxidative stress [Citation43]. It is concluded that ESRD may be in a state of a high inflammatory response and oxidative stress [Citation44,Citation45].
4.2. Metabolic disorders in ESRD patients with depression
4.2.1. Clinical biochemical characteristics of ESRD patients with depression
In our study, the neutrophil percentage of the ESRD patients with depression was higher than that of the ESRD patients without depression. The occurrence of depression is highly related to inflammation [Citation46–48], which is shown obviously in ESRD patients, with neutrophils as the indicator of inflammatory response [Citation49]. It was been reported that the presence of inflammatory factors such as TNF-α, IL-4, IL-6 in patients ESRD may be effectively regulated by the hypothalamic–pituitary–adrenal axis (HPA); Inflammatory factors can also directly stimulate HPA to cause abnormalities. Studies have shown that HPA abnormalities are one of the main causes of depression [Citation50]. Therefore, high inflammatory response in ESRD patients with depression may be the pathological basis of depression.
4.2.2. Energy metabolism
Compared with ESRD patients without depression, ESRD patients with depression had higher N-acetyl-L-aspartic acid (NAA) and gentisic acid, and lower serotonin and thiamin pyrophosphate (TPP). KEGG analysis showed that these metabolites were involved in the TCA cycle. TCA cycle is the ultimate and hub metabolic pathway of three major nutrients (sugars, lipids, and amino acids) [Citation51]. Dysregulation of TCA metabolism has been reported in ESRD patients with depression [Citation27]. The disorder of nutrient metabolism is common in ESRD patients, leading to insufficient energy supply for biochemical reactions.
NAA as a biomarker of neuronal damage severity and only exists in neurons, which is one of the most concentrated metabolites in the human brain and is not detected in the blood [Citation52]. This study revealed that the NAA level in ESRD patients with depression was higher than that in ESRD patients without depression, which may be due to neuronal apoptosis and necrosis, indicating that neuronal activity was reduced or functional damage in ESRD patients with depression. Serotonin is an important neurotransmitter, and the lack of serotonin in the central nervous system can result in depression. The reduction of serotonin function and activity is closely related to depression, loss of appetite, and endocrine dysfunction [Citation53]. This phenomenon can be observed in patients with major depression [Citation29]. In accordance with the findings above, our result showed that the serotonin level in ESRD patients with depression was lower than that in ESRD patients. We speculated that the factors affecting the metabolism of tryptophan to serotonin and further metabolism to melatonin or acetyl-CoA in ESRD patients with depression may be one of the causes of depression.
4.2.3. Glycerolipid metabolism
In this study, we also found abnormalities in glycerolipid metabolism. Elevated levels of LysoPC(18:1), PG(36:1) and PA(34:2) are observed in ESRD patients with depression compared with ESRD patients without depression. Phospholipids that account for 60% of the brain weight, is critical for brain neuronal structures especially synaptic structures [Citation54]. The three phospholipids of PA, PG, and LysoPC play important roles in signal transduction of dopamine, serotonin, glutamate, and acetylcholine [Citation55,Citation56]. The dysregulation of lipid metabolism has been demonstrated in patients and rats with CKD and ESRD [Citation57–59]. It has been reported that PA, PG, and LysoPC are important signaling molecules with various biological functions involved in cell proliferation and inflammatory processes [Citation60–62]. Therefore, our current demonstrated the dysregulation of lipid metabolism in ESRD patients with depression.
5. Limitation
This study only explored depressed or nondepressed ESRD patients through nontargeted metabolomics. The conclusions that can be explained are limited. A number of studies have shown that in addition to inflammation that directly stimulates HPA, cachexia caused by chronic inflammation related to latent infection or malignant disease may also participate in the development of depression in patients with ESRD. Therefore, further experiments and data are needed to explain the relationship between the course of ESRD and depression in patients.
6. Conclusions
Our research uses non-targeted metabolomics methods to study the metabolic characteristics of ESRD patients and ESRD patients with depression. Inflammation, oxidative stress and abnormal energy metabolism are related to the pathogenesis of patients with ESRD depression, which may be a promising target for treatment. In addition, several metabolites have been found, and they may play an important role in the development of depression in ESRD patients.
Ethical approval
The study protocol was approved by the Second Affiliated Hospital of Chongqing Medical University (Approved ID: 2019-Research No. 279–01).
| Abbreviations | ||
| α-KGDHC | = | alpha-ketoglutarate dehydrogenase complex |
| ATP | = | adenosine triphosphate |
| AUC | = | the area under the curve |
| BCKDH | = | branched-chain alpha-keto acid dehydrogenase complex |
| BUN | = | blood urea nitrogen |
| Cr | = | creatinine |
| CKD | = | chronic kidney disease |
| Cr | = | creatinine |
| DBP | = | diastolic blood pressure |
| ESRD | = | end stage renal disease |
| FC | = | fold change |
| GAD | = | glutamic acid decarboxylase |
| HAMD | = | Hamilton Depression Scale for depression |
| HB | = | hemoglobin |
| HMDB | = | human metabolome database |
| HPA | = | hypothalamic–pituitary–adrenal axis |
| IL-4 | = | interleukin-4 |
| KEGG | = | Kyoto Encyclopedia of Genes and Genomes |
| N% | = | neutrophilic granulocyte% |
| NAA | = | N-acetyl-L-aspartic acid |
| OPLS-DA | = | orthogonal partial least square-discriminate analysis |
| PCA | = | principal component analysis |
| PDHC | = | pyruvate dehydrogenase complex |
| PLS-DA | = | partial least squares-discriminant analysis |
| PUFAs | = | polyunsaturated fatty acids |
| RBC | = | red blood cell |
| RPT | = | response permutation testing |
| ROC | = | receiver operating curve |
| SBP | = | systolic blood pressure |
| SSRIs | = | selective serotonin reuptake inhibitors |
| TCA-cycle | = | tricarboxylic acid cycle |
| TC | = | total cholesterol |
| TG | = | triglyceride |
| TPP | = | thiamin pyrophosphate |
| UPLC-QTOF/MS | = | ultra-high-performance liquid chromatography tandem quadrupole time-of-flight mass spectrometry |
| VIP | = | variable important in projection |
| WBC | = | white blood cell. |
Acknowledgments
We gratefully acknowledge the assistance of Department of Nephrology in the Second Affiliated Hospital of Chongqing Medical University and our colleagues Chunhua Fan, Yi Chen and YanweiLv during the writing of this paper and the helpful advice of Jing Li and Xin Tian.
Disclosure statement
No potential conflict of interest was reported by the author(s).
Data availability statement
The study data can be accessed from the corresponding author Ran J.H. or Li J.F. by request.
Additional information
Funding
References
- Webster AC, Nagler EV, Morton RL, et al. Chronic kidney disease. Lancet. 2017;389(10075):1238–1252.
- Brier ME, Gooding JR, Harrington JM, et al. Serum trace metal association with response to erythropoiesis stimulating agents in incident and prevalent hemodialysis patients. Sci Rep. 2020;10(1):20202.
- Zhu S, Zhang F, Shen A-W, et al. Metabolomics evaluation of patients with stage 5 chronic kidney disease before dialysis, maintenance hemodialysis, and peritoneal dialysis. Front Physiol. 2020;11:630646.
- Hunter E, Percival B, Ahmad Z, et al. NMR-based metabolomics associated with chronic kidney disease in humans and animals: a one health perspective. Mol Cell Biochem. 2021;476(11):4133–4137.
- Wang Y-C, Chiu C-H, Lin C-L, et al. Scrub typhus and depression: a nationwide cohort analysis. J Transl Med. 2018; 16(1):333.
- Riggs DW, Pearce R, Pfeffer CA, et al. Transnormativity in the psy disciplines: constructing pathology in the diagnostic and statistical manual of mental disorders and standards of care. Am Psychol. 2019;74(8):912–924.
- Condon MD, Platt NJ, Zhang Y-F, et al. Plasticity in striatal dopamine release is governed by release-independent depression and the dopamine transporter. Nat Commun. 2019;10(1):4263.
- Gorinski N, Bijata M, Prasad S, et al. Attenuated palmitoylation of serotonin receptor 5-HT1A affects receptor function and contributes to depression-like behaviors. Nat Commun. 2019;10(1):3924.
- Herman FJ, Simkovic S, Pasinetti GM. Neuroimmune nexus of depression and dementia: Shared mechanisms and therapeutic targets. Br J Pharmacol. 2019;176(18):3558–3584.
- Su J-A, Chang C-C, Wang H-M, et al. Antidepressant treatment and mortality risk in patients with dementia and depression: a nationwide population cohort study in Taiwan. Ther Adv Chronic Dis. 2019;10:2040622319853719.
- Alshogran OY, Khalil AA, Oweis AO, et al. Association of brain-derived neurotrophic factor and interleukin-6 serum levels with depressive and anxiety symptoms in hemodialysis patients. Gen Hosp Psychiatry. 2018;53:25–31.
- Navarrete M, Cuartero MI, Palenzuela R, et al. Astrocytic p38alpha MAPK drives NMDA receptor-dependent long-term depression and modulates long-term memory. Nat Commun. 2019;10(1):2968.
- Holmes SE, Scheinost D, Finnema SJ, et al. Lower synaptic density is associated with depression severity and network alterations. Nat Commun. 2019;10(1):1529.
- Howard DM, Adams MJ, Shirali M, 23andMe Research Team, et al. Genome-wide association study of depression phenotypes in UK biobank identifies variants in excitatory synaptic pathways. Nat Commun. 2018;9(1):1470.
- Wang YN, Ma SX, Chen YY, et al. Chronic kidney disease: biomarker diagnosis to therapeutic targets. Clin Chim Acta. 2019;499:54–63.
- Zhang Z-H, Mao J-R, Chen H, et al. Removal of uremic retention products by hemodialysis is coupled with indiscriminate loss of vital metabolites. Clin Biochem. 2017;50(18):1078–1086.
- Hu J-R, Grams ME, Coresh J, et al. Serum metabolites and cardiac death in patients on hemodialysis. Clin J Am Soc Nephrol. 2019;14(5):747–749.
- Zhao YY. Metabolomics in chronic kidney disease. Clin Chim Acta. 2013;422:59–69.
- Zhao YY, Lin RC. Metabolomics in nephrotoxicity. Adv Clin Chem. 2014;65:69–89.
- Gladine C, Ostermann AI, Newman JW, et al. MS-based targeted metabolomics of eicosanoids and other oxylipins: analytical and inter-individual variabilities. Free Radic Biol Med. 2019; 144:72–89.
- Zhao YY, Lin RC. UPLC-MS(E) application in disease biomarker discovery: the discoveries in proteomics to metabolomics. Chem Biol Interact. 2014;215:7–16.
- Martinez-Sena T, Luongo G, Sanjuan-Herraez D, et al. Monitoring of system conditioning after blank injections in untargeted UPLC-MS metabolomic analysis. Sci Rep. 2019;9(1) :9822.
- Zhao Y-Y, Wu S-P, Liu S, et al. Ultra-performance liquid chromatography-mass spectrometry as a sensitive and powerful technology in lipidomic applications. Chem Biol Interact. 2014;220:181–192.
- Zhao YY, Cheng XL, Vaziri ND, et al. UPLC-based metabonomic applications for discovering biomarkers of diseases in clinical chemistry. Clin Biochem. 2014;47(15):16–26.
- Hocher B, Adamski J. Metabolomics for clinical use and research in chronic kidney disease. Nat Rev Nephrol. 2017;13(5):269–284.
- Schultheiss U, Sekula P. The promise of metabolomics in decelerating CKD progression in children. Clin J Am Soc Nephrol. 2021;16(8):1152–1154.
- Zhou X, Liu L, Lan X, et al. Polyunsaturated fatty acids metabolism, purine metabolism and inosine as potential independent diagnostic biomarkers for major depressive disorder in children and adolescents. Mol Psychiatry. 2019;24(10):1478–1488.
- Hamilton M. A rating scale for depression. J Neurol Neurosurg Psychiatry. 1960;23(1):56–62.
- Wishart DS, Knox C, Guo AC, et al. HMDB: a knowledgebase for the human metabolome. Nucleic Acids Res. 2009; 37(Database):D603–D610.
- Wang TJ, Larson MG, Vasan RS, et al. Metabolite profiles and the risk of developing diabetes. Nat Med. 2011; 17(4):448–453.
- Westerhuis JA, van Velzen EJJ, Hoefsloot HCJ, et al. Multivariate paired data analysis: multilevel PLSDA versus OPLSDA. Metabolomics. 2010;6(1):119–128.
- Molle T, Moreau Y, Clemancey M, et al. Redox behavior of the S-Adenosylmethionine (SAM)-binding Fe-S cluster in methylthiotransferase RimO, toward understanding dual SAM activity. Biochemistry. 2016;55(41):5798–5808.
- Chen D-Q, Cao G, Chen H, et al. Identification of serum metabolites associating with chronic kidney disease progression and anti-fibrotic effect of 5-methoxytryptophan. Nat Commun. 2019;10(1):1476.
- Chen H, Cao G, Chen DQ, et al. Metabolomics insights into activated redox signaling and lipid metabolism dysfunction in chronic kidney disease progression. Redox Biol. 2016;10:168–178.
- Zhao YY, Cheng XL, Wei F, et al. Intrarenal metabolomic investigation of chronic kidney disease and its TGF-β1 mechanism in induced-adenine rats using UPLC Q-TOF/HSMS/MS(E). J Proteome Res. 2013;12(2):692–2703.
- Duranton F, Lundin U, Gayrard N, et al. Plasma and urinary amino acid metabolomic profiling in patients with different levels of kidney function. CJASN. 2014;9(1):37–45.
- Pena MJ, Lambers Heerspink HJ, Hellemons ME, et al. Urine and plasma metabolites predict the development of diabetic nephropathy in individuals with type 2 diabetes mellitus. Diabet Med. 2014;31(9):1138–1147.
- Feng YL, Cao G, Chen DQ, et al. Microbiome-metabolomics reveals gut microbiota associated with glycine-conjugated metabolites and polyamine metabolism in chronic kidney disease. Cell Mol Life Sci. 2019;76(24):4961–4978.
- Chen L, Chen DQ, Liu JR, et al. Unilateral ureteral obstruction causes gut microbial dysbiosis and metabolome disorders contributing to tubulointerstitial fibrosis. Exp Mol Med. 2019;51(3):1–18.
- Chen D-Q, Cao G, Chen H, et al. Gene and protein expressions and metabolomics exhibit activated redox signaling and wnt/β-catenin pathway are associated with metabolite dysfunction in patients with chronic kidney disease. Redox Biol. 2017;12:505–521.
- Chen D-Q, Chen H, Chen L, et al. The link between phenotype and fatty acid metabolism in advanced chronic kidney disease. Nephrol Dial Transplant. 2017;32(7):1154–1166.
- Benson JM, Shepherd DM. Dietary ligands of the aryl hydrocarbon receptor induce anti-Inflammatory and immunoregulatory effects on murine dendritic cells. Toxicol Sci. 2011;124(2):327–338.
- Goldstein LE, Leopold MC, Huang X, et al. 3-Hydroxykynurenine and 3-hydroxyanthranilic acid generate hydrogen peroxide and promote alpha-crystallin cross-linking by metal ion reduction. Biochemistry. 2000;39(24):7266–7275.
- Feng YL, Chen H, Chen DQ, et al. Activated NF-κB/Nrf2 and wnt/β-catenin pathways are associated with lipid metabolism in CKD patients with microalbuminuria and macroalbuminuria. Biochim Biophys Acta Mol Basis Dis. 2019;1865(9):2317–2332.
- Zhao YY, Wang HL, Cheng XL, et al. Metabolomics analysis reveals the association between lipid abnormalities and oxidative stress, inflammation, fibrosis, and Nrf2 dysfunction in aristolochic acid-induced nephropathy. Sci Rep. 2015; 5:12936.
- Eick SM, Meeker JD, Brown P, et al. Associations between socioeconomic status, psychosocial stress, and urinary levels of 8-iso-prostaglandin-F2α during pregnancy in Puerto Rico. Free Radic Biol Med. 2019;143:95–100.
- Song J, Ma W, Gu X, et al. Metabolomic signatures and microbial community profiling of depressive rat model induced by adrenocorticotrophic hormone. J Transl Med. 2019;17(1):224.
- Wang J, Jiang C, Zhang K, et al. Melatonin receptor activation provides cerebral protection after traumatic brain injury by mitigating oxidative stress and inflammation via the Nrf2 signaling pathway. Free Radic Biol Med. 2019;131:345–355.
- Balta S, Demırkol S, Kucuk U. The platelet lymphocyte ratio may be useful inflammatory indicator in clinical practice. Hemodial Int. 2013;17(4):668–669.
- Turkmen K, Guney I, Yerlikaya FH, et al. The relationship between neutrophil-to-lymphocyte ratio and inflammation in end-stage renal disease patients. Renal Failure. 2012;34(2):155–159.
- Zhang Z-H, Li M-H, Liu D, et al. Rhubarb protect against tubulointerstitial fibrosis by inhibiting TGF-β/smad pathway and improving abnormal metabolome in chronic kidney disease. Front Pharmacol. 2018;9:1029.
- Tsai G, Coyle JT. N-acetylaspartate in neuropsychiatric disorders. Prog Neurobiol. 1995;46(5):531–540.
- Coppen A, Shaw DM, Malleson A, et al. Tryptamine metabolism in depression. Br J Psychiatry. 1965;111(479):993–998.
- González-Ramírez EJ, Goñi FM, Alonso A. Mixing brain cerebrosides with brain ceramides, cholesterol and phospholipids. Sci Rep. 2019;9(1) :13326.
- Horrobin DF. Phospholipid metabolism and depression: the possible roles of phospholipase A2 and coenzyme A-independent transacylase. Hum Psychopharmacol. 2001; 16(1):45–52.
- Chen H, Miao H, Feng YL, et al. Metabolomics in dyslipidemia. Adv Clin Chem. 2014;66:101–119.
- Zhao YY, Vaziri ND, Lin RC. Lipidomics: new insight into kidney disease. Adv Clin Chem. 2015;68:153–175.
- Zhang Z-H, Chen H, Vaziri ND, et al. Metabolomic signatures of chronic kidney disease of diverse etiologies in the rats and humans. J Proteome Res. 2016;15(10):3802–3812.
- Zhao YY, Cheng XL, Lin RC, et al. Lipidomics applications for disease biomarker discovery in mammal models. Biomark Med. 2015;9(2):153–168.
- Chen H, Chen L, Liu D, et al. Combined clinical phenotype and lipidomic analysis reveals the impact of chronic kidney disease on lipid metabolism. J Proteome Res. 2017;16(4):1566–1578.
- Zhang Z-H, Vaziri ND, Wei F, et al. An integrated lipidomics and metabolomics reveal nephroprotective effect and biochemical mechanism of Rheum officinale in chronic renal failure. Sci Rep. 2016;6:22151.
- Dou F, Miao H, Wang J-W, et al. An integrated lipidomics and phenotype study reveals protective effect and biochemical mechanism of traditionally used alisma Orientale juzepzuk in chronic renal disease. Front Pharmacol. 2018;9:53.