
Abstract
Background
Diabetic kidney disease (DKD) is a common and serious complication in patients with diabetic mellitus (DM), the risk of cardiovascular events and all-cause mortality also increases in DKD patients. This study aimed to detect the influencing factors of DKD in type 2 DM (T2DM) patients, and construct DKD prediction models and nomogram for clinical decision-making.
Methods
A total of 14,628 patients with T2DM were included. These patients were divided into pre-DKD and non-DKD groups, depending on the occurrence of DKD during a 3-year follow-up from first clinic attendance. The influencing indicators of DKD were analyzed, the prediction models were established by multivariable logistic regression, and a nomogram was drawn for DKD risk assessment.
Results
Two prediction models for DKD were built by multivariate logistic regression analysis. Model 1 was created based on 17 variables using the forward selection method, Model 2 was established by 19 variables using the backward elimination method. The Somers’ D values of both models were 0.789. Four independent predictors were selected to build the nomogram, including age, UACR, eGFR, and neutrophil percentages. The C-index of the nomogram reached 0.864, suggesting a good predictive accuracy for DKD development.
Conclusions
Our prediction models had strong predictive powers, and our nomogram provided visual aids to DKD risk calculation, which was simple and fast. These algorithms can provide early DKD risk prediction, which might help to improve the medical care for early detection and intervention in T2DM patients, and then consequently improve the prognosis of DM patients.
Introduction
Diabetes mellitus (DM) is one of the fastest-growing global health burdens in recent decades, which affected 537 million adults, and the prevalence rate was 10.5% all over the world in 2021. While the number of DM patients will increase to 537 million in 2030, and 643 million in 2045 [Citation1]. Approximately 20–40% of DM patients develop diabetic kidney disease (DKD). DKD is a common microvascular complication, which is a leading cause of end-stage kidney disease (ESKD), cardiovascular events, and all-cause mortality in DM patients [Citation2].
The multifactorial intervention of DKD is an important goal in the management of type 2 diabetes mellitus (T2DM), mainly including the management of hyperglycemia, hypertension, hyperlipidemia, and hyperuricemia, combined with reasonable dietary intake, weight control, and exercise [Citation3,Citation4]. Pharmacological treatment of DKD is primarily targeted toward glycemic and blood pressure (BP) control, and adequate management of lipid and uric acid, with the goal of reducing urinary albumin and preventing microvascular complications. Of which, there are several medications that can improve cardiac and renal outcomes. BP lowering with angiotensin-converting enzyme inhibitors (ACEi) and angiotensin receptor blockers (ARB) are proven to slow down the progression of DKD [Citation5,Citation6]. Mineralocorticoid receptor antagonists (MRAs) have efficacy in resistant hypertension, reducing albuminuria and DKD progression, as well as reduction of cardiovascular disease (CVD) and heart failure [Citation7,Citation8]. Novel diabetic drugs, such as sodium-glucose cotransporter 2 inhibitor (SGLT2i) and glucagon-like peptide 1 receptor agonist (GLP-1RA) could improve the renal and cardiovascular outcomes in T2DM patients [Citation9,Citation10]. However, none of the above drugs were suitable for patients with advanced DKD. Therefore, the early prediction of DKD is crucial for the clinical application of these drugs, and the delay of DKD progression.
The construction of risk prediction models might benefit early evaluation and intervention of DKD, and delay DKD development in T2DM patients. Existing prediction models for DKD were mostly developed based on data from Western populations [Citation11]. Previous studies showed that DKD incidence in the Chinese population is higher than in Caucasians, due to genetic and environmental factors (e.g., diet and living habits) [Citation12]. This study aims to develop prediction models of DKD for clinical application and improve the long-term prognosis of Chinese T2DM patients.
Materials and methods
Study design and population
This is a population-based, retrospective, cohort study. All patients with T2DM were screened in the outpatient and inpatient department, as well as the medical examination center in Xuzhou Central Hospital (Xuzhou, China). Inclusion criteria: (1) patients with T2DM; (2) aged 18–75years. Exclusion criteria: (1) without complete data of 3-year follow-up; (3) verified diagnosis of DKD at baseline, based on the guidelines created by the Expert Group of the Chinese Society of Nephrology, American Diabetes Association (ADA), and the European Association for the Study of Diabetes (EASD) [Citation13,Citation14]; (4) had persistent albuminuria, decreased renal function, other kidney diseases, systemic diseases (e.g., autoimmune diseases), infection, tumors, or malnutrition at first clinic attendance. The baseline date was defined as the date of first clinic attendance. This study followed the International Conference on Harmonized guidelines for good clinical practice and was conducted in accordance with the Helsinki Declaration. The agreement was approved by the Ethics Committee of Xuzhou Central Hospital (Reference NO. XZXY-LJ-20201030-055).
Data extraction and clinical variables
The data were obtained from the electronic health records (EHRs) in the hospital information system (HIS), from January 2014 to July 2021. The diagnosis of DM and/or DKD was determined by the baseline and last follow-up evaluation, using both the International Statistical Classification of Diseases 10th Revision (ICD-10) and the latest Chinese DKD guideline [Citation13]. A total of 14,628 patients with T2DM were enrolled in this study. The data on demographic information, medical history, physical examination, and laboratory tests were collected. The urinary albumin to creatinine ratio (UACR) was classified as follows: normoalbuminuria, UACR <30 mg/g; microalbuminuria, UACR 30–299 mg/g; as well as macroalbuminuria, UACR >300 mg/g. The estimated glomerular filtration rate (eGFR) was calculated by the chronic kidney disease epidemiology collaboration (CKD-EPI) equations based on serum creatinine.
Clinical outcomes
The primary endpoint was the occurrence of DKD, which was defined as DM patients presenting one of the following conditions [Citation13]: ① microalbuminuria or macroalbuminuria, and the repeat UACR ≥ 30 mg/g at least 2 of 3 samples within 3 to 6 months; ② eGFR < 60 mL/min/1.73m2 for more than 3 months; ③ renal biopsy was consistent with DKD pathological changes. The T2DM patients who developed DKD within 3 years after the first clinic attendance were assigned to the pre-DKD group and the remaining patients were assigned to the non-DKD group.
Statistical analysis
Patients’ baseline demographic and clinical characteristics, as well as laboratory parameters, were expressed as proportions for dichotomous variables, mean (±SD) or median (interquartile range) for continuous variables; and the Shapiro-Wilk test was used to assess the normal distribution of these variables. The t-test, chi-square test, and Kruskal-Wallis test were performed to detect the difference between groups, depending on the distribution status of these variables. Multivariable logistic regression analysis was performed using the forward selection method (Model 1) and backward elimination method (Model 2). The area under the Receiver Operating Characteristic (ROC) curve, which is referred to as the C-statistic, was used to assess the discriminatory ability of the models. The Akaike information criterion (AIC) was used to evaluate the goodness of fit of the models. The calibration was assessed by the calibration curves. We evaluated the relative importance of the predictive variables using the ‘relweights’ function in R software [Citation15,Citation16], then selected the top four predictive variables to establish a nomogram model for DKD risk prediction. A two-sided p-value < .05 was defined as statistically significant. Statistical analyses were performed using the SAS system (version 9.4, SAS Institute Inc., Cary, NC, USA) and R software (version 4.1.3, https://www.R-project.org).
Results
Cohort description
A total of 14,628 adults with T2DM were enrolled in this study and were assigned to two groups according to the presence of DKD during a 3-year follow-up. The mean age was 51.32 ± 17.24 years, with 44.28% of female patients. Compared with the patients in the non-DKD group, the mean age was significantly higher, and the proportion of female patients was lower in the pre-DKD group. A total of 95 baseline variables were analyzed and compared between the non-DKD group and pre-DKD group, of which, the baseline variables with significant statistical differences between these two groups and/or with reported clinical significance by previous studies were listed in . The levels of white blood cell (WBC), neutrophils percentages, neutrophil-lymphocyte ratio (NLR), α-hydroxybutyrate dehydrogenase (α-HBDH), alkaline phosphatase (ALP), creatine phosphokinase (CK), globulin, high-density lipoprotein cholesterol (HDL-C), total cholesterol (TCH), triglyceride, APOB/APOA1 ratio, lipoprotein (a) [Lp(a)], blood urea nitrogen (BUN), uric acid (UA), C-peptide, HbA1c, UACR, as well as systolic blood pressure (SBP) were significantly higher in the pre-DKD group than in the non-DKD group, while the levels of hemoglobin, albumin, and pre-albumin had opposite trends (all p < .05).
Table 1. Baseline characteristics stratified by DKD occurrence in enrolled T2DM patients.
Predictive models for DKD development
Multivariate logistic regression analysis was performed on the independent variables, then the variables were selected to build two risk prediction models for DKD (). Model 1 was created based on 17 variables using the forward selection method, the area under the receiver operating characteristic (ROC) curve (AUC) of model 1 was 0.8943, and the optimal cutoff value of the ROC curve was 0.26, with a specificity and sensitivity of 0.764 and 0.852, respectively (). In the forward selection model, the hazard ratio (HR) of age, WBC, neutrophils, α-HBDH, albumin, CK, globulin, pre-albumin, TCH, eGFR, BUN, UA, C-peptide, UACR, SBP, as well as RASI usage exceeded 1.0 with statistical significance, which suggested the DKD risk could be high in the T2DM patients with high levels of these above variables.
Figure 1. Receiver operating characteristic (ROC) curve for DKD predictive models based on multivariate logistic regression analysis. (A) ROC curve for model 1 showed that its AUC for predicting DKD was 0.8943. Its optimal cutoff value was 0.26, with a specificity and sensitivity of 0.764 and 0.852, respectively. (B) ROC curve for model 2 showed that its AUC for predicting DKD was 0.8946. Its optimal cutoff value was 0.22, with a specificity and sensitivity of 0.797 and 0.818, respectively.
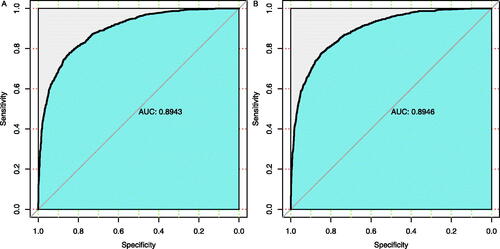
Table 2. Prediction models for DKD by the forward selection method (Model 1) and the backward elimination method (Model 2).
Model 2 was established by 19 variables using the backward elimination method, the AUC of model 2 was 0.8946, and its optimal cutoff value was 0.22, with a specificity and sensitivity of 0.797 and 0.818 (). Similarly, in this backward elimination model, the hazard ratio (HR) of age, WBC, neutrophils, α-HBDH, albumin, globulin, pre-albumin, TCH, APOB/APOA1 ratio, eGFR, BUN, UA, C-peptide, UACR, SBP, as well as RASI usage exceeded 1.0 with statistical significance, indicated that the DKD risk could positive correlated with these variables. Moreover, the value of Somers’ D arranges from −1 to 1, the Somers’ D values of both models was 0.789 in this study. The larger values of AUC and Somers’ D indicated the stronger predictive power of the model.
In order to verify Model 1 and Model 2 in , we randomly selected one-third of the enrolled patients (N = 4876) in the dataset as the internal validation group, and its descriptive statistics were shown in Supplemental Table S1. A collinearity analysis was performed to verify the linear correlations between the independent variables (Supplemental Table S2), of which, the variance inflation factor (VIF) is a key index for the severity of complex (multiple) collinearities in multiple linear regression models, the closer the VIF value is to 1, the lighter the multi-collinearity, and the heavier vice versa. Usually, 10 is used as the judgment boundary. When VIF <10, there is no multi-collinearity; when 10 ≤ VIF ≤ 100, there is a strong multi-collinearity; and when VIF ≥ 100, there is a severe multi-collinearity. Supplemental Table S2 showed that the VIF values of the variables in Model 1 were between 1 and 2, and the VIF values of the variables in Model 2 were less than 10, indicating that there was no multi-collinearity in our multivariate logistic regression models. The C-statistic, generalized R-squared, and AIC criteria (Supplemental Table S3), as well as the calibration curves (Supplemental Figure S1), were performed to evaluate these two models. Moreover, we also validated the reliability of these two models in subgroups of enrolled patients with different age (age <60 and age ≥60 years old), gender (male and female), and medications (metformin and statins), the details were listed in Supplemental Table S4–Table S15. All the above assessments demonstrated that these two models had good reliability and calibration ability.
The nomogram prediction model for DKD
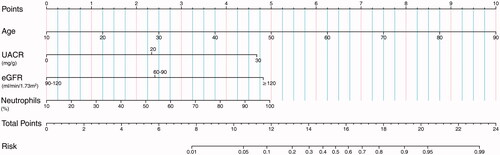
The relative importance of predictor variables was calculated and sequenced using ‘relweights’ function in R language, the top four independent predictors were selected to build a nomogram, including age, UACR, eGFR, and neutrophils percentages (). The C-index of this nomogram was 0.864, suggesting a good predictive accuracy for DKD development. Based on the sum of the assigned points for each selected predictor in the nomogram, the larger value of total points indicated a higher risk of DKD in T2DM patients. For example, a T2DM patient is 60 years old (score = 6.25), with normal UACR (20 mg/g) (score = 2.4), normal eGFR (120 mL/min/1.73m2) (score = 4.75), and higher neutrophils percentages (70%) (score = 3.3) would have a total of 16.7 points (6.25 + 2.4 + 4.75 + 3.3 = 16.7), which indicated that the probability of DKD onset was about 70% in the next three years.
Figure 2. Nomograms to predict the 3-year risk of diabetic kidney disease (DKD) in Chinese patients with type 2 diabetes (T2DM). Note: The renal nomogram was developed in the cohort, with variables, age, UACR, eGFR, and neutrophils percentages. Steps to estimate the DKD risk: first, obtain the point for each variable by drawing a vertical line from the value to the scoring ruler; second, summate points for all variables to calculate a total point; finally, evaluate the risk of DKD onset by drawing a vertical line from the total points to the predicted risk ruler. Abbreviations: UACR, urinary albumin to creatinine ratio; eGFR, estimated glomerular filtration rate.
Discussion
The onset of T2DM is usually insidious, its incidence of DKD is associated with various clinical factors and genetic factors [Citation2]. Currently, clinical DKD screening is mainly based on urinary albumin and serum creatinine. When DM patients develop increased urinary albumin, with UACR ≥ 30 mg/g, and/or urinary albumin excretion rate (UAER) ≥30mg/24h, and/or lower eGFR <60 mL/min/1.73m2, and without the absence of signs of other renal diseases, the diagnosis of DKD could be confirmed [Citation13]. However, a substantial proportion of DM patients have renal function loss without proteinuria, known as non-proteinuric DKD. The prevalence of non-proteinuric DKD is about 20% among T1DM patients, and 40% among T2DM patients [Citation17]. The serum levels of creatinine only begin to rise after the injured glomeruli exceed 50% of the total glomeruli. Thus, urinary albumin and elevated serum creatinine should be the final results of kidney injury in DM patients, and both only be considered late indicators of DKD screening [Citation18]. Diabetic retinopathy (DR) is an important basis for DKD diagnosis, however, the DR process is not entirely consistent with DKD, and the predictive value of DR on subsequent DKD risk was relatively low in DM patients [Citation19]. Although renal biopsy is the ‘gold standard’ to diagnose DKD, renal biopsy is an invasive procedure and is classically indicated when a nondiabetic cause of CKD is suspected in DM patients. Currently, the clinical diagnosis of DKD is still based on clinical and laboratory evaluations [Citation13,Citation20]. Therefore, there is an urgent need for early detection of DKD that would help to improve the diagnosis, treatment, and prevention of DKD.
The major clinical factors for DKD progression are glycemic control and hypertension, among which, the abnormal vasoactive hormone-related pathways could cause systemic vasoconstriction, renal fibrosis, and inflammation, then promote DKD progression, for instance. the aldosterone, endothelin, and renin-angiotensin-aldosterone system (RAAS) [Citation21]. Uric acid-mediated endothelial dysfunction and RAAS activation, induced vascular smooth muscle proliferation and inflammatory response and thus promoted microangiopathy and DKD development [Citation22]. Long-term exposure to relatively high levels of serum uric acid (SUA), even within the normal range, was an independent predictor of DKD [Citation23]. Moreover, high albuminuria, low serum albumin, and dyslipidemia were associated with renal dysfunction in T2DM patients [Citation24,Citation25].
Except for the above conventional variables for DKD progression, previous studies demonstrated that systemic inflammatory status was an important predictor of DKD onset in DM patients, including inflammatory factors, leukocytes, and neutrophils. Among them, the neutrophil-lymphocyte ratio was a reliable index for systemic inflammation, that was associated with the inflammatory conditions caused by metabolic syndrome and insulin resistance [Citation26]. EPO deficiency and the impairment of the hypoxia-inducible transcription factor-1α (HIF-1α) pathway could be the main cause of anemia in DM patients, and the anemia exacerbated the microvascular complications, such as the occurrence and development of renal involvement in DM patients [Citation27]. The elevated serum level of alkaline phosphatase (ALP) was independently associated with poor renal outcomes in T2DM patients [Citation28]. The elevated serum level of Lp(a) was associated with renal impairment in T2DM patients independent of albuminuria and insulin resistance [Citation29]. Excessive C-peptide may promote renal function loss and the incidence of DKD [Citation30].
This study conducted a retrospective analysis of T2DM patients based on their diagnosis and clinical data from the hospital information system (HIS), to detect and select major indexes for DKD prediction models during T2DM follow-up. The trends of most variables in our non-DKD and pre-DKD groups in were consistent with previous reports. In addition, our results also showed that the baseline serum levels of α-hydroxybutyrate dehydrogenase (α-HBDH), creatine phosphokinase (CK), and globulin were significantly different between non-DKD and pre-DKD groups, however, no previous literature had reported that these three laboratory indicators were associated with DKD progression.
To establish the prediction models for DKD, a total of 20 variables were selected from , based on multivariate logistic regression analysis. Two models were built using the forward selection method and backward elimination method, respectively. Most of these indicators were the routine clinical indexes for the evaluation of proteinuria and renal function and participated in the diagnosis and staging of DKD. While the models also identified several new indicators, including α-HBDH, CK, and globulin, further investigations are needed to reveal their potential mechanisms in the development of DKD. Under the combination of these traditional and novel indicators, both models had strong predictive powers to improve the performance of 3-year DKD risk prediction, with high values of AUC, specificity, and sensitivity, as well as Somers’ D.
A nomogram consists of score lines for the indicators and risks to predict an intended clinical outcome. Most prediction models pursue the accuracy of the predictive values, while the nomogram has visual advantages, and facilitates fast calculating the risk of a certain clinical outcome according to the points of the predictor variables in clinical practice [Citation31]. Therefore, in terms of DKD prediction, the nomogram is more intuitive, rapid, and simple. In this study, we obtained four variables for the nomogram of DKD risk prediction. These four variables were age, UACR, eGFR, and neutrophils percentages, all variables were easy to achieve from routine clinical data in medical institutions at all levels, from community health centers to large general hospitals. Furthermore, the high C-index of our nomogram indicated that this model could be accurately and widely applied in a large number of clinical samples.
In China, with the prevalence of DM increasing, DKD prevalence has risen rapidly and becomes one of the leading causes of ESKD. Our previous studies showed that ESKD patients accounted for less than 0.15% of the total population, while consuming more than 2–4% of government health expenses, with poor quality of life and high mortality [Citation32,Citation33]. The sustained increasing prevalence and medical costs of ESKD will bring heavy economic burdens to the Chinese government. Wu et al. conducted a decision-analytic model to project the lifetime cost-effectiveness of different strategies for DKD prevention in newly diagnosed T2DM patients. Compared with the control strategy (‘do nothing’ strategy), the screening strategy (screening for microalbuminuria followed by RAS inhibitors) was a cost-saving option with better clinical outcomes [Citation34]. Therefore, a compulsory early forecast and detection of DKD should be initiated, with the promise of avoiding or delaying the progression of DKD in DM patients. The results of this study might benefit DKD early screening, thereby guiding clinical intervention, delaying DKD progression, reducing related medical expenses, and improving the quality of life and outcomes in DM patients.
This study has limitations. First, it was a retrospective study based on a clinical dataset from a single medical institution, and therefore, could not guarantee the same performance in all clinical studies. Secondly, this study conducted the diagnoses of DM and DKD based on the ICD-10 criteria and the 2021 clinical guidelines for Chinese DKD, and then completed the classifications of ‘non-DKD’ and ‘pre-DKD’ subgroups. Although the ICD-10 criteria had been confirmed to be reliable in diagnosis and classification for DM patients [Citation27], there were still biases induced by grouping errors or underreporting. Moreover, further studies are still needed to evaluate and validate the application of our prediction models in DKD risk assessment in clinical practice.
In summary, we constructed prediction models and nomogram for DKD and evaluated their performance in T2DM patients. Our models based on multivariate logistic regression analysis had strong predictive powers, and our nomogram provided visual aids to DKD risk calculation, which was simple and fast. Our results could provide risk assessment tools for DKD development in T2DM patients, guide early clinical intervention, and fulfill the needs of patient self-assessment in clinical practice.
Ethical approval
The study involved Human Participants and it was performed at the Xuzhou Central Hospital. The study adhered to the International Conference on Harmonization guidelines for Good Clinical Practice and was conducted in accordance with the Declaration of Helsinki. The protocol was approved by the ethical committee of the Xuzhou Central Hospital (Approval No. XZXY-LJ-20201030-055). All participants provided a written informed consent.
Supplemental Material
Download PDF (293.2 KB)Supplemental Material
Download PDF (20.9 KB)Supplemental Material
Download PDF (96.4 KB)Supplemental Material
Download PDF (146.5 KB)Supplemental Material
Download PDF (61.1 KB)Disclosure statement
No potential conflict of interest was reported by the author(s).
Additional information
Funding
Related Research Data
References
- Federation ID. IDF diabetes atlas. 10th edn. Brussels, Belgium: International Diabetes Federation; 2021.
- Hagnas M, Sundqvist H, Jokelainen J, et al. The prevalence of chronic kidney disease and screening of renal function in type 2 diabetic patients in Finnish primary healthcare. Prim Care Diabetes. 2020;14(6):639–644.
- Ueki K, Sasako T, Okazaki Y, et al. Multifactorial intervention has a significant effect on diabetic kidney disease in patients with type 2 diabetes. Kidney Int. 2021;99(1):256–266.
- Huang Z, Zhang H, Luo Y, et al. The 100 top-cited articles in diabetic kidney disease: a bibliometric analysis. Ren Fail. 2021;43(1):781–795.
- He D, Zhang Y, Zhang W, et al. Effects of ACE inhibitors and angiotensin receptor blockers in normotensive patients with diabetic kidney disease. Horm Metab Res. 2020;52(5):289–297.
- Du YH, Guan CJ, Li LY, et al. Efficacy and safety of angiotensin converting enzyme inhibitors and angiotensin II receptor blockers in diabetic nephropathy: a systematic review and meta-analysis. Ann Palliat Med. 2022;11(3):1093–1101.
- Filippatos G, Anker SD, Agarwal R, et al. Finerenone and cardiovascular outcomes in patients with chronic kidney disease and type 2 diabetes. Circulation. 2021;143(6):540–552.
- Verma A, Patel AB. Finerenone: a non-steroidal mineralocorticoid receptor blocker for diabetic kidney disease. Trends Endocrinol Metab. 2021;32(5):261–263.
- DeFronzo RA, Reeves WB, Awad AS. Pathophysiology of diabetic kidney disease: impact of SGLT2 inhibitors. Nat Rev Nephrol. 2021;17(5):319–334.
- Gorriz JL, Soler MJ, Navarro-Gonzalez JF, et al. GLP-1 receptor agonists and diabetic kidney disease: a call of attention to nephrologists. J Clin Med. 2020;9(4):1–20.
- Allen A, Iqbal Z, Green-Saxena A, et al. Prediction of diabetic kidney disease with machine learning algorithms, upon the initial diagnosis of type 2 diabetes mellitus. BMJ Open Diabetes Res Care. 2022;10(1):1–7.
- Kong AP, Xu G, Brown N, et al. Diabetes and its comorbidities–where east meets west. Nat Rev Endocrinol. 2013;9(9):537–547.
- Nephrology EGoCSo. Chinese guidelines for diagnosis and treatment of diabetic kidney disease. Chin J Nephrol. 2021;37(3):255–304.
- Buse JB, Wexler DJ, Tsapas A, et al. 2019 Update to: management of hyperglycemia in type 2 diabetes, 2018. A consensus report by the American diabetes association (ADA) and the European association for the study of diabetes (EASD). Diabetes Care. 2020;43(2):487–493.
- Johnson JW. A heuristic method for estimating the relative weight of predictor variables in multiple regression. Multivariate Behav Res. 2000;35(1):1–19.
- Johnson JW, LeBreton JM. History and use of relative importance indices in organizational research. Organ Res Methods. 2004;7(3):238–257.
- Yamanouchi M, Furuichi K, Hoshino J, et al. Nonproteinuric diabetic kidney disease. Clin Exp Nephrol. 2020;24(7):573–581.
- Argiles A, Siwy J, Duranton F, et al. CKD273, a new proteomics classifier assessing CKD and its prognosis. PLoS One. 2013;8(5):e62837.
- Li Y, Su X, Ye Q, et al. The predictive value of diabetic retinopathy on subsequent diabetic nephropathy in patients with type 2 diabetes: a systematic review and meta-analysis of prospective studies. Ren Fail. 2021;43(1):231–240.
- Persson F, Rossing P. Diagnosis of diabetic kidney disease: state of the art and future perspective. Kidney Int Suppl. 2018;8(1):2–7.
- Patel DM, Bose M, Cooper ME. Glucose and blood pressure-dependent pathways – the progression of diabetic kidney disease. Int J Mol Sci. 2020;21(6):1–32.
- Jalal DI, Maahs DM, Hovind P, et al. Uric acid as a mediator of diabetic nephropathy. Semin Nephrol. 2011;31(5):459–465.
- Mauer M, Doria A. Uric acid and risk of diabetic kidney disease. J Nephrol. 2020;33(5):995–999.
- Li Y, Ji X, Ni W, et al. Serum albumin and albuminuria predict the progression of chronic kidney disease in patients with newly diagnosed type 2 diabetes: a retrospective study. PeerJ. 2021;9:e11735.
- Zhao WB, Alberto PSM. Serum apolipoprotein B/apolipoprotein A1 ratio is associated with the progression of diabetic kidney disease to renal replacement therapy. Int Urol Nephrol. 2020;52(10):1923–1928.
- Winter L, Wong LA, Jerums G, et al. Use of readily accessible inflammatory markers to predict diabetic kidney disease. Front Endocrinol. 2018;9:225.
- Deray G, Heurtier A, Grimaldi A, et al. Anemia and diabetes. Am J Nephrol. 2004;24(5):522–526.
- Zhao L, Li L, Ren H, et al. Association between serum alkaline phosphatase and renal outcome in patients with type 2 diabetes mellitus. Ren Fail. 2020;42(1):818–828.
- Xuan L, Wang T, Dai H, et al. Serum lipoprotein (a) associates with a higher risk of reduced renal function: a prospective investigation. J Lipid Res. 2020;61(10):1320–1327.
- Huang Y, Wang Y, Liu C, et al. C-peptide, glycaemic control, and diabetic complications in type 2 diabetes mellitus: a real-world study. Diabetes Metab Res Rev. 2022;38(4):e3514.
- Grimes DA. The nomogram epidemic: resurgence of a medical relic. Ann Intern Med. 2008;149(4):273–275.
- Sun L, Zou LX, Han YC, et al. Forecast of the incidence, prevalence and burden of end-stage renal disease in Nanjing, China to the Year 2025. BMC Nephrol. 2016;17(1):60.
- Han YC, Huang HM, Sun L, et al. Epidemiological study of RRT-Treated ESRD in Nanjing – a ten-year experience in nearly three million insurance covered population. PLoS One. 2016;11(2):e0149038.
- Wu B, Zhang SH, Lin HW, et al. Prevention of renal failure in Chinese patients with newly diagnosed type 2 diabetes: a cost-effectiveness analysis. J Diabetes Investig. 2018;9(1):152–161.