
Abstract
Background
Tacrolimus is a potent immunosuppressant, but has various side effects, with nephrotoxicity being the most common. Renal fibrosis is an important process of tacrolimus nephrotoxicity. Therefore, it is important to identify the factors that contribute to renal fibrosis after tacrolimus nephrotoxicity, and control its development.
Methods
The present study aims to determine whether tacrolimus may speed up the course of renal fibrosis by upregulating noncoding RNA activated by DNA damage (NORAD) to compete with miR-136-5p, and activating the TGF-β1/Smad3 pathway. Furthermore, in vivo rat models and in vitro cell models were established. Then, the expression levels of NORAD and miR-136-5p were determined by RT-qPCR, while the expression of the TGF-β1/Smad3 pathway was determined by western blot and RT-qPCR. In order to investigate the interaction between NORAD and miR-136-5p, as well as miR-136-5p and SYK, two luciferase reporters were employed. The renal fibrosis of mice was observed using Masson and PAS staining. The expression of inflammatory factors IL-1, IL-6, MCP-1 and TNF-α was detected by ELISA.
Results
In the in vitro experiments, NORAD was upregulated, while miR-136-5p was downregulated after tacrolimus induction. The expression of the TGF-β1/Smad3 pathway correspondingly changed after the induction by tacrolimus. In the in vivo experiments, the expression of NORAD and miR-136-5p, and the trend for renal fibrosis were consistent with the results in the in vitro experiments. Furthermore, the inflammatory factors correspondingly changed with the severity of renal fibrosis. Moreover, the expression trend of the TGF-β1/Smad3 pathway in tacrolimus-induced rats was consistent with that in the in vitro experiments.
Conclusion
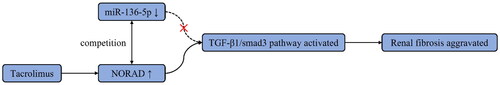
Through in vitro and in vivo experiments, the present study was able to successfully prove that tacrolimus upregulates NORAD to compete with miR-136-5p, resulting in a decrease in miR-136-5p expression, which in turn activates the TGF-β1/smad3 pathway, and finally induces the aggravation of renal fibrosis.
Graphical Abstract
Introduction
Tacrolimus is a potent immunosuppressant that was developed in the 1990s, and this can be isolated from Streptomyces tsukubaensis mainly for the treatment of patients undergoing allogeneic organ transplantation, or patients with autoimmune diseases [Citation1]. Tacrolimus has various side effects, in which nephrotoxicity is the most common, and renal fibrosis is an important process of tacrolimus nephrotoxicity [Citation2]. Therefore, it is important to identify the factors that contribute to renal fibrosis after tacrolimus nephrotoxicity, and control its development.
Studies have revealed that the tacrolimus activation of the TGF-β1/Smad pathway is closely correlated to calcineurin inhibitor (CNI)-induced renal fibrosis. Therefore, it is particularly important to study the molecular mechanism by which tacrolimus activates the TGF-β1/SMAD pathway [Citation3]. A previous study revealed that the expression of miR-136 was downregulated in diabetic rats established using the streptozotocin (STZ) method. The overexpression of miR-136 can target the inhibition of spleen tyrosine kinase (SYK), while the downregulation of miR-136 and the increase in SYK activates the TGF-β1/Smad3 signaling to mediate the renal fibrosis [Citation4]. However, related studies on miR-136 and TGF-β1/Smad3 in tacrolimus-induced renal fibrosis have not been reported, and it has not been determined whether miR-136 can be targeted and regulated by long non-coding RNA (lncRNA).
As post-transcriptional regulators of the gene expression, miRNAs and LncRNAs participate in the body’s pathological and physiological processes, and affects the occurrence and development of renal fibrosis through the TGF-β1/Smad signaling pathway [Citation5–7]. Studies have revealed that the upregulation of miRNA-1228-3p can alleviate the TGF-β1-induced renal tubular epithelial cell fibrosis by inhibiting the Smad2/4 signaling pathway, while the upregulation of miR-21 can directly downregulate Smad7/p-Smad7 and indirectly upregulate Smad3/p-Smad3, in order to enhance the TGF-β1-induced EMT, and aggravate the renal fibrosis progression [Citation8,Citation9]. In addition, TGF-β1 can upregulate miR-93, miR-192, miR-216a and miR-377, and downregulate the miR-29 and miR-200 families during renal fibrosis [Citation10]. Studies have also revealed that Erbb4-IR and lncRNA9884 are both novel Smad3-dependent lncRNAs. Erbb4-IR can lead to TGF-β1/Smad3-mediated renal fibrosis by downregulating the expression of Smad7 in UUO mice, while lncRNA9884 can enhance a single fibrosis. Furthermore, monocyte chemoattractant protein-1 (MCP-1)-dependent renal inflammation promotes renal injury in diabetic mice [Citation11,Citation12]. Given that the TGF-β1/Smad signaling pathway regulates various miRNAs and IncRNAs that play important roles in renal fibrosis, targeting these RNAs to prevent renal fibrosis would be a feasible and promising therapeutic strategy.
LncRNAs, called NORAD (non-coding RNA activated by DNA damage), are upregulated, and these help cells advance in a variety of human cancer types [Citation13]. Studies have revealed that NORAD accelerates the development of non-small cell lung cancer (NSCLC) by acting as a miR-136-5p competitor and an endogenous RNA [Citation14]. In addition, it has been demonstrated that LncRNA NORAD may activate the miR-144-3p/MYCN axis by acting on miR-144-3p to promote the proliferation and migration of renal carcinoma [Citation15]. The present study hypothesized that the renal fibrosis induced by high tacrolimus concentration was exacerbated by the upregulation of LncRNA NORAD, the downregulation of miR-136-5p, and the activation of the TGF-β1/Smad3 pathway. A potentially novel treatment approach to treat renal fibrosis symptoms is to artificially suppress the NORAD expression.
The present study aims to determine whether tacrolimus may speed up the course of renal fibrosis by upregulating NORAD to compete with miR-136-5p, and activating the TGF-β1/Smad3 pathway. Furthermore, in vivo rat models and in vitro cell models were established. Then, the NORAD and miR-136-5p expression levels were detected by RT-qPCR, while the expression of the TGF-β1/Smad3 pathway was determined by western blot and RT-qPCR. In order to determine the interaction between NORAD and miR-136-5p, as well as miR-136-5p and SYK, two luciferase reporters were employed. The renal fibrosis of mice was observed using Masson and PAS staining. The expression of inflammatory factors IL-1, IL-6, MCP-1 and TNF-α was detected by ELISA.
Materials and methods
Experiment design
All experiments in the present study were carried out according to standard experimental procedures. The present study was approved by the Ethics Committee of The First Affiliated Hospital of Zhengzhou University (No. 20200304).
In vitro experiments: Rat renal tubular duct epithelial cells (NRK-52E) were cultured strictly under sterile conditions. These cells were split in two, and one of which was treated with tacrolimus at 50 μg/mL. The knockdown of lncRNA NORAD was achieved by the transfection of si-NORAD (Thermo-Fisher, USA). The transfection of miR-136-5p mimics (Thermo-Fisher, USA) led to the overexpression of miR-136-5p. The NORAD and miR-136-5p expression levels were detected in each batch of cells by RT-qPCR. The expression of the TGF-β1/Smad3 pathway was detected by western blot and RT-qPCR. In order to determine the interaction between NORAD and miR-136-5p, as well as miR-136-5p and SYK, two luciferase reporters were employed.
In vivo experiments: Male Wistar rats (3 weeks old, body weight: 64 ± 3 g) were purchased for the experiments. These rats were randomly divided into two groups: normal group (Control) and tacrolimus nephrotoxicity group (Tac). In the Tac group, 2 mg/kg of tacrolimus was intraperitoneally injected daily. In the control group, the rats received an intraperitoneal injection of the same amount of solvent, including polyoxyethylene hydrogenated castor oil and absolute ethanol, daily, for 2 weeks. Then, these rats were euthanized by cervical dislocation under deep anesthesia with 10% chloral hydrate, and the kidney tissues were collected for the subsequent experiments. The NORAD and miR-136-5p expression levels in each set of renal tissues were detected by RT-qPCR. The renal fibrosis of mice was observed using Masson and PAS staining. The expression of inflammatory factors IL-1, IL-6, MCP-1 and TNF-α was determined by ELISA. The expression of the TGF-β1/Smad3 pathway was detected by western blot and RT-qPCR.
RT-PCR analysis
In order to extract the total RNA from the cells, the NRK-52E cells or kidney tissue cells were treated with TRIzol reagent. Then, the first strand cDNA was created using the Revert Aid TW first Strand cDNA Synthesis Kit. For the PCR analysis, the QuantiNova SyBr Green PCR Kit was utilized. The conditions for the reaction were, as follows: pre-denaturation at 95 °C for 1 min, denaturation at 95 °C for 30 s, annealing at 60 °C for 30 s, and elongation at 72 °C for 30 s.
Western blot analysis
The cells were collected from each group, and each six-well plate was filled with 200 μL of cell lysate. Then, the cells were sonicated and lysed for one hour on ice. Afterwards, the lysed cell sample was centrifuged at 12,500 rpm for 15 min at 4 °C. Subsequently, the supernatant in the centrifuge tube was transferred into a clean centrifuge tube. Next, the protein concentration was measured using a actin or tubulin protein measurement kit. Then, the analyzed protein samples were maintained at −80 °C. The protein loading concentration in the western blot electrophoresis was 50 μg per well. After the sodium dodecyl-sulfate polyacrylamide gel electrophoresis (SDS-PAGE), the membrane was transferred and blocked. In order to utilize the concentration, proteins SYK, TGF-β1, p-Smad3 and Smad3 were diluted using a primary antibody (1:500, anti-human; Thermo-Fisher, USA). Then, the samples were shaken overnight at 4 °C in an incubator. After washing with PBS, the samples were incubated for 30 min at room temperature in the dark with the secondary antibody (1:1000, anti-human; Thermo-Fisher, USA). Finally, the developer was utilized for photography and development.
Dual luciferase reporter analysis
When preparing cells and target plasmids for transfection in 96-well plates, it is best to wait until the cell density reaches 50–70%. Next, 0.16 mg of lncRNA (circRNA/3'UTR)/Mut target plasmid was combined with 5 pmol of miR/Negative in 10 mL of DMEM. The controls were place at room temperature and imitated (solution A). Then, 10 mL of DMEM was combined with 0.3 mL of the transfection agent (solution B), and the mixture was allowed to sit in room temperature for 5 min. After combining solution A and B, these were allowed to sit in room temperature for 20 min. Prior to the transfection, new media was introduced to the cells. This was followed by the addition of the transfection solution and mixing. The cells were grown in culture at 37 °C with 5% CO2. At 48 h after transfection, these cells were harvested, and after six hours, fresh media was added.
The detection kit used for the experiment was the Promega Dual-Luciferase System. The 96-well plate wells were filled with 100 μL of 1'PLB, which was diluted from 5'PLB with distilled water. The cell lysate was pipetted into a 1.5-mL centrifuge tube after gently shaking the cells using a shaker at room temperature for 15 min to disperse these. Then, the supernatant was transferred to a fresh tube after centrifugation at 13,200 g for 10 min at 4 °C. Afterwards, 100 μL of Luciferase Assay Reagent II (LAR II; Luciferase Assay Reagent, Promega) was added to the working solution in the 96-well plate. Next, 20 μL of cell lysate was added and mixed by pipetting for two to three times, and the Firefly luciferase value was measured and recorded as the internal reference value. Then, 100 μL of Stop&Glo® Reagent (Luciferase Assay Reagent, Promega) was added and mixed by pipetting for two to three times, and the Firefly luciferase value was measured and recorded as the reporter gene luminescence value.
Masson staining and PAS staining
Masson staining: The kidney tissue in each group was cut into sections, and repeatedly deparaffinized to water. After 5 min of staining with the ready-made Weigert iron hematoxylin stain, the sections were thoroughly washed in the area. Then, these were rinsed with distilled water for 1 min before restoring to blue with the Masson’s blue solution for 3 min. After 5 min, these were stained with Ponceau-magenta. Then, the weak acid working solution was prepared using the following formula: 2:1 weak acid-to-distilled water. Afterwards, these were washed for 1 min with this solution. After washing for 1 min with a solution of 1% phosphomolybdic acid, these were rinsed for 1 min with the prepared weak acid working solution. Then, the sections were rinsed with the prepared weak acid working solution for 1 min before directly staining for 1 min, without washing in aniline blue staining solution. Subsequently, these were dehydrated with absolute ethanol for three times for five seconds each, and quickly fixed with 95% ethanol. Afterwards, these were mounted with neutral gum after cleaning with xylene for three times, for a total of 1 min each time. The staining effect was observed using an optical microscope.
PAS staining: The kidney tissues obtained from each group were sectioned and routinely deparaffinized in water. Then, these were stained with the prepared periodic acid alcohol solution for 10 min, and washed with distilled water for 10 min. Afterwards, these were stained with prepared Schiff’s solution for 10 min, and washed with distilled water for 5 min. Subsequently, these were stained with hematoxylin for 3 min, and washed with distilled water for 5 min. Then, these were quickly dehydrated with 95% ethanol, and dehydrated with absolute ethanol for three times, for five seconds each time. Finally, these were cleared with xylene for three times, for 1 min each time, and mounted with neutral gum. The staining effect was observed using an optical microscope.
ELISA analysis
Five standard wells were set on the ELISA-coated plate. Then, the standard samples were added to the wells, according to the concentration requirements, and were serially diluted. The sample volume in each well was 50 μL. Next, a blank control well and a sample well to be tested were set. The blank control well was not added with the sample and enzyme-labeled reagent. The other steps were the same with those for the sample well. Next, 40 μL of the sample diluent was added to the sample well, and 10 μL of the sample was added. The final dilution of the sample was five times. Next, the plate was sealed using a sealing film, and incubated at 37 °C for 30 min. After incubation, the plate was washed using a washing solution, and dried. After drying, 50 μL of enzyme-labeled reagent was added to each well, except for the blank well. The incubation and washing steps were repeated. Next, 50 μL of developer A and 50 μL of developer B were sequentially added into each well, and the color was allowed to develop at 37 °C for 15 min in the dark. Lastly, 50 μL of stop solution was added to stop the reaction (the blue color immediately turned yellow). The blank control well was set as zero, and the absorbance (OD value) of each well was measured in sequence at 450 nm wavelength.
Statistical analysis
The statistical method used for the present experiment was paired t-test. The experimental results were expressed as mean ± standard deviation. The statistical analysis was performed using the SPSS 23.0 software. The figures were produced using the Origin 2022 b and Adobe Illustrator 2021 software.
Results and discussion
In vitro experiments
NORAD was upregulated after tacrolimus induction, while miR-136-5p was downregulated
presents the results for the detected expression levels of NORAD and miR-136-5p in each set of cells by RT-qPCR. The results for the expression of NORAD and miR-136-5p in the Control group and Tac group are presented in . In the figure, the miR-136-5p expression was significantly downregulated, while the NORAD expression was significantly upregulated in the Tac group, when compared to the Control group. Since NORAD is an endogenous RNA that competes with miR-136-5p for expression, it is possible that tacrolimus can increase the NORAD expression while decreasing the miR-136-5p expression.
Figure 1. The results for the expression levels of NORAD and miR-136-5p in each group of cells after tacrolimus induction. (A) Before NORAD transfection. (B) After NORAD transfection. *p < 0.05, compared to the Control group. #p < 0.05, compared to the Tac and Tac + si-NC groups.
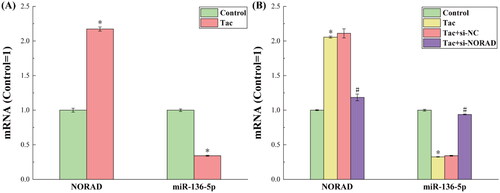
By transfecting si-NORAD to cells in the Tac group, the expression of NORAD was successfully knocked down. presents the expression results for NORAD and miR-136-5p after the NORAD expression was knocked down. It can be observed from the figure that when the expression of NORAD was artificially downregulated, the expression of miR-136-5p correspondingly increased. This once again confirms that NORAD can negatively regulate miR-136-5p, thereby affecting the miR-136-5p-regulated molecular pathways.
The expression of the TGF-β1/Smad3 pathway correspondingly changed after induction by tacrolimus
presents the results for the tacrolimus-induced and si-NORAD transfection levels for the protein and RNA expression of the TGF-β1/Smad3 pathway. The non-receptor tyrosine kinase spleen tyrosine kinase (SYK), which is present in the majority of hematological and non-hematopoietic cells, is essential for both immune and non-immune biological responses. Through immunoreceptor tyrosine activation motif (ITAM)-dependent signaling pathways and ITAM semi-dependent signaling pathways, SYK promotes a variety of cellular responses [Citation16]. A significant member of the superfamily of transforming growth factors is TGF-β. Mammals produce TGF-β in three different isoforms: TGF-β1, TGF-β2, and TGF-β3. Among these, TGF-β1 is the most prevalent. In addition, there are three TGF-receptors: TGF-type I receptor (TRI), TGF-type II receptor (TRII), and TGF-type III receptor (TRIII). According to the structure and function, the Smad protein family can be classified into three groups: inhibitory type (Smad4), universal type (Smad1), and receptor activation type (Smad1, Smad2, Smad3, Smad5, Smad8 and Smad9; Smad6 and Smad7). The important downstream signaling components of the TGF-β1 signaling include the following: Smad2, Smad3, Smad4 and Smad7 [Citation17]. TGF-β1 is typically released in an inactive state, which can mix with latency-related peptides to create a latent form of TGF-β1. Then, this latent form of TGF-β1 forms a significant latent complex with latent TGF-binding proteins. TGF-β1 is produced and activated in response to diverse stimuli, binding to TRII by phosphorylating and activating TRI kinase, which in turn, phosphorylates and activates the downstream Smad2 and Smad3. Smad4 can join with the phosphorylated Smad2 and Smad3 to create a trimeric complex that controls the transcription of target genes. Smad7 has a detrimental regulatory impact on the TGF-β1/Smad signaling pathway, because this might compete with the receptor-activated Smad protein that binds to the activated receptor [Citation18]. The TGF-canonical pathway plays a significant role in controlling the development of renal fibrosis through the TGF-β1/Smad signaling pathway.
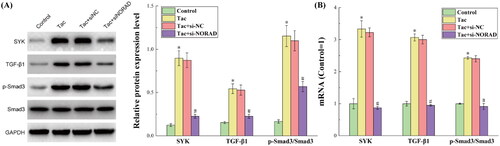
Figure 2. The results for the protein and RNA expression levels of the GF-β1/Smad3 pathway. (A) The results for the protein expression levels detected by western blot. (B) The results for the RNA expression levels detected by RT-qPCR. *p < 0.05, compared to the Control group. #p < 0.05, compared to the Tac and Tac + si-NC groups.
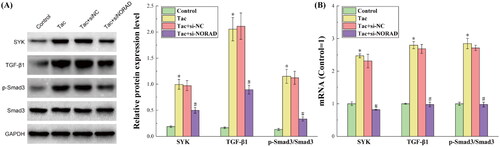
presents the results for the detected expression of each protein in the TGF-β1/Smad3 pathway by western blot. It can be observed from the figure that after the induction by tacrolimus, the expression levels of the main proteins SYK, TGF-β1 and p-Smad3/Smad3 in the TGF-β1/Smad3 pathway all increased, indicating that the TGF-β1/Smad3 pathway was activated. When si-NORAD was transfected, the expression of each protein in the TGF-β1/Smad3 pathway significantly decreased. Combined with the above results, it can be concluded that tacrolimus induces the upregulation of NORAD, thereby activating the TGF-β1/Smad3 pathway, and promoting the occurrence of renal fibrosis.
presents the results for the detected expression of each mRNA in the TGF-β1/Smad3 pathway by RT-qPCR. It can be observed from the figure that the mRNA expression trend in the TGF-β1/Smad3 pathway was completely consistent with the protein expression trend, which further strengthens the credibility of the experimental results and conclusions.
Confirmation of NORAD targeting miR-136-5p and miR-136-5p targeting SYK
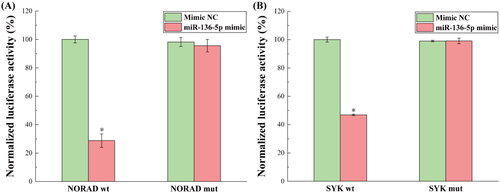
presents the outcomes of the dual luciferase reporter detection of the binding of NORAD to miR-136-5p and miR-136-5p to SYK. Through bioinformatics research, the theoretical binding sites for NORAD, miR-136-5p, miR-136-5p and SYK were extracted, and these were employed as detection sites in the dual-luciferase reporter experiment. As demonstrated, the NORAD wt construct significantly decreased, while the NORAD mut construct had no impact on the activity of the luciferase reporter gene that contained the hypothetical NORAD binding site in miR-136-5p. These findings suggest that miR-136-5p might be a target for NORAD. Simultaneously, the SYK wt construct drastically decreased the activity of the luciferase reporter gene, which contains the hypothetical miR-136-5p binding site in SYK, but the SYK mut construct had no impact. These findings suggest that miR-136-5p may specifically target SYK. By examining the likelihood of NORAD to bind to miR-136-5p, and miR-136-5p to bind to SYK, it was concluded that NORAD controls miR-136-5p, which in turn, controls the expression of the TGF-β1/Smad3 pathway.
Figure 3. The results for the dual luciferase reporters in detecting the binding of NORAD to miR-136-5p and miR-136-5p to SYK. (A) The normalized luciferase activity of NORAD wt and mut binding to miR-136-5p. (B) The normalized luciferase activity of SYK wt and mut binding to miR-136-5p. *p < 0.05, compared to the Mimic NC group.
In vivo experiments
The expression of NORAD and miR-136-5p, and the renal fibrosis trends were consistent with the in vitro experiments
The results for the expression levels of NORAD and miR-136-5p in tacrolimus-induced and si-NORAD-transfected rats are presented in . It can be observed from the figure that the expression trends of NORAD and miR-136-5p were completely consistent with the expression trends in the in vitro experiments, under the premise that the treatment methods in the four groups of rats corresponds to the treatment methods for the four groups of cells in the in vitro experiments. This shows that the conclusions speculated by the in vitro experiments were strengthened in vivo. That is, NORAD can negatively regulate miR-136-5p, thereby affecting the miR-136-5p-regulated molecular pathways.
Figure 4. (A) The results for the expression levels of NORAD and miR-136-5p in each group of kidney tissues. (B) The results for the degree of renal fibrosis in mice detected by Masson and PAS staining. *p < 0.05, compared to the Control group. #p < 0.05, compared to the Tac and Tac + si-NC groups.
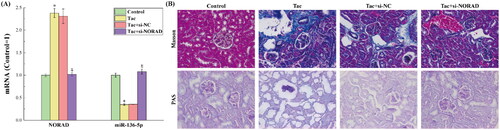
The results for the degree of renal fibrosis in mice detected by the Masson and PAS staining are presented in . Masson staining and PAS staining are typical staining methods used to determine the fibers and inflammatory factors in tissues. It can be observed from the figure that after the induction with tacrolimus, the severity of renal fibrosis in rat kidneys significantly increased. After the si-NORAD conversion, the renal fibrotic lesions were alleviated. This indicates that the upregulation of NORAD can activate the TGF-β1/smad3 pathway, thereby aggravating the degree of renal fibrosis.
Inflammatory factors correspondingly changed with the severity of renal fibrosis
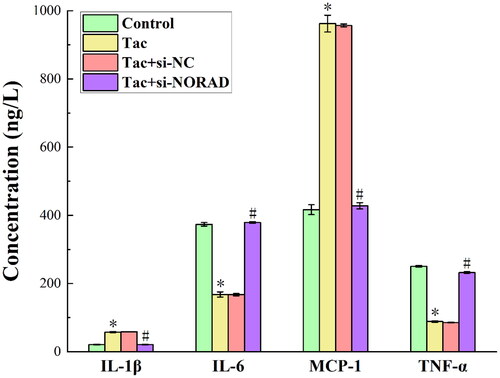
presents the outcomes for the ELISA performed to determine the expression of inflammatory factors IL-1, IL-6, MCP-1 and TNF-α in each group of kidney tissues. As observed from the figure, the tacrolimus induction significantly enhanced the expression of IL-1 and MCP-1, while this only slightly decreased the expression of IL-6 and TNF-α. In addition, the expression levels of IL-1, IL-6, MCP-1 and TNF-α again shifted in the reverse direction after the si-NORAD transfection. The typical pro-inflammatory factors are, as follows: interleukin-1 (IL-1) and monocyte chemoattractant protein 1 (MCP-1) [Citation19,Citation20]. The typical anti-inflammatory substances are, as follows: tumor necrosis factor alpha (TNF-α) and interleukin-6 (IL-6) [Citation21,Citation22]. Therefore, the induction of tacrolimus increases the secretion of pro-inflammatory factors, and reduces the secretion of anti-inflammatory factors, which in turn, leads to the aggravation of inflammatory response, and promotes the aggravation of renal fibrosis. By transfecting si-NORAD and knocking down the expression of NORAD, the secretion of pro-inflammatory factors was reduced, the secretion of anti-inflammatory factors increased, the inflammatory response was relieved, and the renal fibrosis lesions were relieved. This indicates that tacrolimus promotes renal fibrosis by upregulating the expression of NORAD.
Figure 5. The results for the expression of inflammatory factors IL-1β, IL-6, MCP-1 and TNF-α in each group of kidney tissues detected by ELISA. *p < 0.05, compared to the Control group. #p < 0.05, compared to the Tac and Tac + si-NC groups.
The expression trend of the TGF-β1/Smad3 pathway in tacrolimus-induced rats was consistent with the in vitro experiments
presents the results for the protein and RNA expression levels of the TGF-β1/Smad3 pathway in each group of kidney tissues, as determined by western blot and RT-qPCR. The figure shows that the protein and mRNA expression levels of SYK, TGF-β1 and p-Smad3/Smad3 in the in vivo studies were identical to the expression levels in the in vitro trials. This shows that the conclusions speculated by the in vitro experiments were strengthened in vivo. That is, tacrolimus induces the upregulation of NORAD, thereby activating the TGF-β1/Smad3 pathway, and promoting the occurrence of renal fibrosis.
Figure 6. The results for the protein and RNA expression levels of the TGF-β1/Smad3 pathway in each group of kidney tissues. (A) The results for the protein expression levels detected by western blot. (B) The results for the RNA expression levels detected by RT-qPCR. *p < 0.05, compared to the Control group. #p < 0.05, compared to the Tac and Tac + si-NC groups.
Conclusion
Through in vitro and in vivo experiments, the present study was able to successfully prove that tacrolimus upregulates NORAD to compete with miR-136-5p, resulting in a decrease in miR-136-5p expression, which in turn, activates the TGF-β1/smad3 pathway, and finally induces the aggravation of renal fibrosis. This provides a new potential therapeutic strategy for targeting NORAD in the treatment of renal fibrosis. Nevertheless, more in-depth studies are still needed to improve these present conclusions, and better understand the mechanisms of tacrolimus and NORAD in the initiation and progression of renal fibrosis.
Disclosure statement
No potential conflict of interest was reported by the author(s).
References
- Oberbauer R, Bestard O, Furian L, et al. Optimization of tacrolimus in kidney transplantation: new pharmacokinetic perspectives. Transplant Rev (Orlando). 2020;34(2):100531.
- Wang D, Chen X, Fu M, et al. Tacrolimus increases the expression level of the chemokine receptor CXCR2 to promote renal fibrosis progression. Int J Mol Med. 2019;44(6):2181–2188.
- Bennett J, Cassidy H, Slattery C, et al. Tacrolimus modulates TGF-beta signaling to induce epithelial-mesenchymal transition in human renal proximal tubule epithelial cells. JCM. 2016;5(5):50.
- Liu L, Pang X, Shang W, et al. miR-136 improves renal fibrosis in diabetic rats by targeting down-regulation of tyrosine kinase SYK and inhibition of TGF-beta 1/Smad3 signaling pathway. Ren Fail. 2020;42(1):513–522.
- Ma C, Yu Y, Lui Q, et al. Effect of miRNA on the TGF-beta/smad signal pathway in hepatic fibrosis. Chin J Clin Anat. 2021;39(3):369–372.
- Noetel A, Kwiecinski M, Elfimova N, et al. microRNA are Central players in anti- and profibrotic gene regulation during liver fibrosis. Front Physiol. 2012;3:49.
- Farooqi AA, Attar R, Qureshi MZ, et al. Interplay of long non-coding RNAs and TGF/SMAD signaling in different cancers. Cell Mol Biol (Noisy-le-grand). 2018;64(15):1–6.
- Chung ACK, Huang XR, Zhou L, et al. Disruption of the Smad7 gene promotes renal fibrosis and inflammation in unilateral ureteral obstruction (UUO) in mice. Nephrol Dial Transplant. 2009;24(5):1443–1454.
- Wang J-Y, Gao Y-B, Zhang N, et al. miR-21 overexpression enhances TGF-beta 1-induced epithelial-to-mesenchymal transition by target smad7 and aggravates renal damage in diabetic nephropathy. Mol Cell Endocrinol. 2014;392(1–2):163–172.
- Lan HY. Diverse roles of TGF-beta/Smads in renal fibrosis and inflammation. Int J Biol Sci. 2011;7(7):1056–1067.
- Feng M, Tang PM-K, Huang X-R, et al. TGF-beta mediates renal fibrosis via the Smad3-Erbb4-IR long noncoding RNA axis. Mol Ther. 2018;26(1):148–161.
- Zhang Y-y, Tang PM-K, Tang PC-T, et al. LRNA9884, a novel Smad3-dependent long noncoding RNA, promotes diabetic kidney injury in db/db mice via enhancing MCP-1-dependent renal inflammation. Diabetes. 2019;68(7):1485–1498.
- Ye T, Ye Z. LncRNA NORAD as a novel predictor of lymph node metastasis and prognosis in solid tumors: a systematic review and meta-analysis. Technol Cancer Res Treat. 2020;19:153303382096358.
- Gao W, Weng T, Wang L, et al. Long non-coding RNA NORAD promotes cell proliferation and glycolysis in non-small cell lung cancer by acting as a sponge for miR-136-5p. Mol Med Rep. 2019;19(6):5397–5405.
- Zhao W, Wang L, Xu F. LncRNA NORAD stimulates proliferation and migration of renal cancer via activating the miR-144-3p/MYCN axis. Eur Rev Med Pharmacol Sci. 2020;24(20):10426–10432.
- Kurniawan DW, Storm G, Prakash J, et al. Role of spleen tyrosine kinase in liver diseases. World J Gastroenterol. 2020;26(10):1005–1019.
- Yang P, Niu Y. TGF-β1/Smad signaling pathway in tissue fibrosis:research advances. Int J Pharm Res. 2019;46(10):7.
- Meng X-M, Tang PM-K, Li J, et al. TGF-beta/Smad signaling in renal fibrosis. Front Physiol. 2015;6:82.
- Aristizábal JF, Ríos H, Rey D, et al. Interleukin 1-beta (IL-1β) polymorphism and orthodontics: a systematic review. Rev Fac Odontol Univ Antioq. 2019;31(1–2):147–161.
- Singh S, Anshita D, Ravichandiran V. MCP-1: function, regulation, and involvement in disease. Int Immunopharmacol. 2021;101(Pt B):107598.
- Rose-John S. Interleukin-6 signalling in health and disease. F1000Res. 2020;9:1013.
- Subedi L, Lee SE, Madiha S, et al. Phytochemicals against TNF alpha-mediated neuroinflammatory diseases. IJMS. 2020;21(3):764.