
Abstract
As a sign of chronic kidney disease (CKD) progression, renal fibrosis is an irreversible and alarming pathological change. The accurate diagnosis of renal fibrosis depends on the widely used renal biopsy, but this diagnostic modality is invasive and can easily lead to sampling error. With the development of imaging techniques, an increasing number of noninvasive imaging techniques, such as multipara meter magnetic resonance imaging (MRI) and ultrasound elastography, have gained attention in assessing kidney fibrosis. Depending on their ability to detect changes in tissue stiffness and diffusion of water molecules, ultrasound elastography and some MRI techniques can indirectly assess the degree of fibrosis. The worsening of renal tissue oxygenation and perfusion measured by blood oxygenation level-dependent MRI and arterial spin labeling MRI separately is also an indirect reflection of renal fibrosis. Objective and quantitative indices of fibrosis may be available in the future by using novel techniques, such as photoacoustic imaging and fluorescence microscopy. However, these imaging techniques are susceptible to interference or may not be convenient. Due to the lack of sufficient specificity and sensitivity, these imaging techniques are neither widely accepted nor proposed by clinicians. These obstructions must be overcome by conducting technology research and more prospective studies. In this review, we emphasize the recent advancement of these noninvasive imaging techniques and provide clinicians a continuously updated perspective on the assessment of kidney fibrosis.
Introduction
For patients with chronic kidney disease (CKD), renal fibrosis is of great concern because of its irreversible pathological process and it impairs renal function. Biopsy is the golden standard for diagnosing kidney fibrosis, nevertheless, it has limitation due to its invasiveness and sampling error. Hence, finding the best noninvasive imaging techniques to assess kidney fibrosis is important. Kidney fibrosis is characterized by extracellular matrix (ECM) proliferation, which is mainly produced by the increasing myofibroblasts [Citation1,Citation2]. During fibrosis, the size, structure, and composition of the kidney change, which are the research focuses and fundamental of imaging techniques. With the development of ultrasonography, magnetic resonance imaging (MRI), and fluorescence microscopy, these noninvasive imaging techniques have excellent application prospects in assessing kidney fibrosis. In this review, we summarize the features and studies of noninvasive imaging techniques (, and ) and discuss the clinical application of these techniques in kidney fibrosis.
Figure 1. The pathological foundation of imaging techniques to assess kidney fibrosis. BOLD-MRI: Blood oxygenation level-dependent MRI; ASL-MRI: Arterial spin labeling MRI; SE: strain elastography; SWE: shear wave elastography; MRE: magnetic resonance elastography; PAI: photoacoustic imaging; ECM: extracellular matrix; MTI: magnetization transfer imaging; DWI: diffusion weighted imaging; DTI: diffusion tensor imaging; IVIM: intravoxel incoherent motion imaging; DKI: diffusion kurtosis imaging. The increase and deposition of ECM lead to the increase of kidney stiffness and macromolecule content, meanwhile, decrease the tissue oxygenation and perfusion, restrict the diffusion of water molecules. This pathologic change is the foundation of different imaging techniques to assess kidney fibrosis.
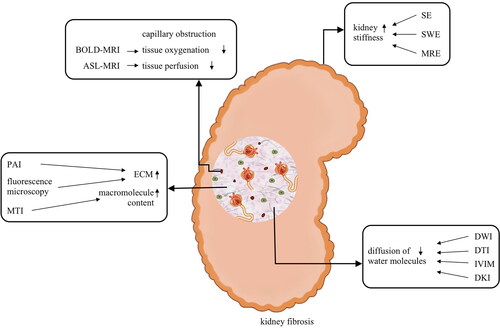
Table 1. Features of noninvasive imaging techniques for assessing kidney fibrosis.
Table 2. Studies on noninvasive imaging techniques for assessing kidney fibrosis.
Ultrasonography
Along with an increase in ECM during fibrosis, the elasticity of renal tissue changes, which is the detecting principle of ultrasonography [Citation36]. Traditional ultrasonography is mainly used for detecting kidney stones and renal space-occupying diseases; however, it provides little help for detecting renal fibrosis. With the development of ultrasonography, ultrasound elastography offers a new perspective on renal fibrosis. Two kinds of ultrasound elastography, namely, strain elastography (SE) and shear wave elastography (SWE), are mainly used.
Strain elastography
The principle of SE is that applying pressure to the kidney can make a displacement, and then, a transducer can obtain images with colors. The different colors in the images represent different stiffness [Citation37]. The completion of SE requires external pressure compression; therefore, it does not apply to the kidneys located at deeper areas of the abdomen. Studies on SE in renal fibrosis focused on renal allografts, which are closer to the body surface [Citation3,Citation36,Citation38]. A small study showed that the corticomedullary strain ratio from SE is a better method for assessing renal allograft cortical interstitial fibrosis/tubular atrophy than Doppler parameters [Citation38]. Two other studies conducted by the same research team showed that the corticomedullary strain ratio and normalized cortical strain on SE may be a good noninvasive method for detecting renal fibrosis [Citation39,Citation40]. A prospective study on graft fibrosis found that the tissue mean elasticity calculated from SE was negatively correlated with the degree of renal fibrosis, and the accuracy of diagnosing moderate to severe fibrosis could reach as high as 95% [Citation3]. Hence, SE is a promising method for assessing renal allograft cortical interstitial fibrosis.
Shear wave elastography
SWE is another ultrasound elastography technique, which can detect tissue stiffness using ultrasound-generated shear wave velocity (SWV), similar to a virtual ‘finger’. Tissue stiffness is directly proportional to the square of the SWV. SWE can assess kidney stiffness without external pressure compression and can be applied to native kidneys, not just renal allografts [Citation41,Citation42]. An experiment involving animal models of unilateral ureteral obstruction (UUO) found that SWE values had a positive correlation with kidney fibrosis, which was quantified by Picrosirius red and Masson trichrome [Citation4]. Therefore, an increasing number of researchers have focused on the application value of SWE in patients with renal fibrosis. A prospective study found that Young ’s modulus measured by SWV, an index reflecting the tissue stiffness, had high specificity and sensitivity in the diagnosis of interstitial fibrosis in patients with IgA nephropathy [Citation43].
There are three types of this imaging technique to be used in kidney diseases: acoustic radiation force impulse (ARFI), supersonic shear imaging, and transient elastography. ARFI was found to be a possibly effective and promising method for assessing CKD and renal fibrosis [Citation44,Citation45]. A study found that ARFI may be a method for predicting acute rejection in patients undergoing kidney transplantation [Citation46]; however, this study lacked adequate evidence. A prospective study showed that SWV measured using ARFI was lower in patients with diabetic nephropathy or lower estimated glomerular filtration rate (eGFR) but was unrelated to proteinuria level [Citation5]. Aimed to compare the renal cortical stiffness between individuals with CKD and healthy people, supersonic shear imaging was performed in 32 patients with CKD and 20 healthy individuals. Young’s modulus, the index that increases with tissue stiffness, was higher in the CKD group [Citation47]. In another study, the mean Young ’s modulus was negatively correlated with eGFR, and supersonic shear imaging was expected to be a potential index for diagnosing and staging diabetic kidney disease [Citation6]. Because of the deep location of native kidneys, studies of transient elastography focused on kidney allografts [Citation7,Citation48,Citation49], similar to studies on SE. Kidney stiffness measured by using transient elastography was significantly higher in renal allograft cortical interstitial fibrosis [Citation7].
However, there are different views on the effect of ultrasound elastography in renal fibrosis. Some studies found no significant correlation between SWV and renal fibrosis and CKD stage [Citation50–53]. Renal stiffness is influenced by several factors, not only fibrosis. First, age, body mass index, gender, and individual variations [Citation54] can influence renal stiffness, which was reported in some studies [Citation7,Citation47,Citation53–55]. Second, renal perfusion is a crucial factor. Animal experiments showed that renal artery and vein ligation can influence renal elasticity values [Citation56]. Aiming to explore the influence of renal perfusion on SWV values, a study measured the SWV and brachial–ankle pulse wave velocity simultaneously in 183 patients with CKD. The brachial–ankle pulse wave velocity, which represents arteriosclerosis of large vessels, was negatively correlated with SWV. In other words, patients with arteriosclerosis of large vessels, which decreases renal perfusion, may have a lower SWV [Citation55]. Additionally, the inhomogeneity of renal fibrosis, the difference in kidney perfusion between the cortex and medulla, and the cooperation degree of patients are also factors that must be considered [Citation57]. SWE is a promising technique for evaluating kidney fibrosis; it is noninvasive and easy to operate but needs more studies to confirm the correlation between renal stiffness indexes and fibrosis.
Photoacoustic imaging
Photoacoustic imaging (PAI) is a new noninvasive technique that combines ultrasound and laser without radiation. PAI can use ultrasound to detect the acoustic signals produced by the thermoelastic expansion of tissues, which is caused by laser irradiation. Because of the different light-absorption spectra of tissue components, PAI can quantify the collagen content in the kidneys and reflect the progression of fibrosis.
Animal studies confirmed that PAI could detect the blood oxygen saturation in patients with acute kidney injury [Citation58] and the kidney vasculature in patients with polycystic kidney disease [Citation59]. Recently, a study on PAI of collagen in animals and humans showed that two-dimensional PAI-based scores had a significant positive correlation with histological results, and alpha-smooth muscle actin was considered a marker of kidney fibrosis in mice with UUO. Moreover, a similar result was found in human radical nephrectomy specimens [Citation33]. This study displayed the enormous potential of PAI in quantifying collagen content and assessing renal fibrosis. Nevertheless, the lack of clinical evidence and the increasing detection depth are big problems that must be solved.
MRI
Diffusion MRI
The motion of water molecules in the body is restricted by fibers, macromolecules, and other tissue components. Renal fibrosis can influence the water diffusion pattern in the kidney, which is the application principle of diffusion MRI in kidney diseases. Generally, the following are common manners of diffusion MRI: diffusion-weighted imaging (DWI), diffusion tensor imaging (DTI), intravoxel incoherent motion imaging (IVIM), and diffusion kurtosis imaging (DKI).
Diffusion-weighted imaging
The main detection index of DWI used in renal fibrosis is the apparent diffusion coefficient (ADC), which indicates the water motion in renal tissue. Fibrosis can cause vascular structure destruction and extracellular matrix proliferation, which influence the blood flow perfusion and water motion, which decreases the ADC. An animal experiment showed that in renal allografts, the ADC of the kidneys with an acute rejection was lower than those without rejection [Citation13]. Furthermore, a similar result was found in patients after kidney transplantation [Citation16,Citation60]. Besides renal allografts, several studies have demonstrated that ADC is also effective in assessing fibrosis of native kidneys [Citation14,Citation15,Citation26,Citation61–63]. A latest prospective study of DWI involving patients with CKD or kidney allograft, found that the cortico-medullary difference of ADC is a more excellent predictor of interstitial fibrosis and kidney function decline than ADC in the cortex or medulla alone [Citation64].
Although the negative correlation between ADC and kidney fibrosis was confirmed by many studies, some defects must be considered. Similar to the SWV of ultrasound elastography, ADC is also influenced by the microcirculation perfusion and the blood flow of peritubular capillary, not only fibrosis. Animal experiments found that the ADC in the cortex and medulla decreased along with the reduction of renal perfusion during the injection of angiotensin II [Citation65]. A similar result was observed in other animal experiments and patients with renal artery stenosis [Citation66,Citation67]. An experiment involving animal models of UUO found that the ADC in rats with renal fibrosis was significantly increased at postmortem and higher than in healthy kidney parenchyma, which was because of tubular dilation and interstitial expansion [Citation68]. Hence, the decrease in ADC may be an indicator of low renal perfusion or worsening of renal function caused by fibrosis, not fibrosis itself. The variations in the results demonstrate the imperfection of ADC and a better indicator which will be unaffected by renal perfusion is needed.
Diffusion tensor imaging
DTI is a new diffusion MRI that can detect the anisotropy of water molecular diffusion based on DWI and paint a picture of changes in the renal microstructure. The main index of DTI is fractional anisotropy (FA). Renal fibrosis can lead to interstitial fibrosis, glomerulosclerosis, and inflammatory infiltration, which cause FA changes [Citation69–71]. An animal experiment on diabetic nephropathy showed that the cortex FA decreased in the early stage of renal fibrosis. Interestingly, the ADC values of rat models with diabetic nephropathy increased after 12 weeks, in contrast to FA. After 24 weeks, both decreased [Citation17]. This might be because the effect of kidney hypertrophy and hyperfiltration was stronger than that of mild fibrosis. Studies on DTI of native kidney or renal allografts found that FA was negatively correlated with the amount of renal fibrosis [Citation18,Citation19,Citation72–74]. Additionally, a study showed that the medulla FA is higher than the cortex FA, contrary to ADC [Citation75,Citation76]. And FA may be influenced by the transport of water molecules in the collecting tubules [Citation76]. FA seems to be more sensitive and stable than ADC [Citation17,Citation77].
Intravoxel incoherent motion imaging
IVIM, a supplement and optimization for ADC, can separate out the pure molecule diffusion and assess kidney capillary perfusion [Citation78]. The main parameters of IVIM include true diffusivity (D), pseudo diffusion coefficient (D*), and perfusion fraction (f). The value of D is a parameter reflecting intracellular and intercellular water molecular movement, and D* can assess microcirculation in vessels or perfusion [Citation20,Citation79]. Meanwhile, the value of f indicates the total tissue perfusion, including all blood flows to capillaries [Citation80]. Moreover, IVIM can separate the true water molecular diffusion by the biexponential fitting of DWI data and detail the mechanism of diffusion without the influence of tissue perfusion [Citation81].
Experiments on animal renal fibrosis models showed correlations between the reduction of IVIM parameters and renal fibrosis [Citation20,Citation22,Citation25,Citation82]. A prospective study on IVIM in chronic kidney disease, aimed to explore its contributions to assess renal function and pathological changes, showed that the values of D and D* were negatively correlated with the stage of CKD and the values of f. The values of D and f had a positive correlation with eGFR. Additionally, it was suggested that the values of f had a significantly negative correlation with the total renal pathological score, which included interstitial fibrosis and tubular atrophy [Citation21]. The same results were observed in other clinical studies of renal fibrosis [Citation83,Citation84]. Therefore, both animal and clinical studies showed the tremendous potential and superiority of IVIM in assessing kidney fibrosis.
Diffusion kurtosis imaging
Fibrosis can change the cell membranes and produce more ECM, which can obstruct the free diffusion of water molecules, resulting in a non-free movement, called non-Gaussian distribution. Non-Gaussian distribution is precisely what DKI aims to detect [Citation85,Citation86]. There are two parameters of DKI: apparent diffusional kurtosis (K), which reflects the peak distribution of tissue diffusivity, and diffusion coefficient (D) under a non-Gaussian distribution similar to ADC [Citation86]. Higher values of K and lower values of D indicate a greater influence on the movement of water molecules, which may reflect the greater damage to the renal parenchyma.
DKI is a novel technique, and only a few studies have evaluated its value in assessing renal fibrosis. Early animal models of renal fibrosis and studies of healthy volunteers confirmed that DKI is feasible in human kidneys [Citation85,Citation87] and can be used to assess renal fibrosis in animal models [Citation23]. Recent studies on DKI in patients with CKD showed a negative correlation between the mean D values in the renal parenchyma and the histopathological fibrosis score, whereas the mean K values in the renal parenchyma showed a positive correlation with the histopathological fibrosis score [Citation24]. The same group also conducted a prospective study to compare the diagnostic efficacy between DKI and DWI in renal fibrosis. In that study, the mean K values in the renal parenchyma were positively associated with the total pathological renal injury score, which included interstitial fibrosis and tubular atrophy. Additionally, the diagnostic efficacy of K was found to be superior to that of ADC in distinguishing between mild renal injury and moderate–severe renal injury [Citation88]. Studies of DKI in renal tissue are still scarce, and the current experiences demonstrate that this new technique deserves more researches and concerns.
Blood oxygenation level-dependent MRI
In the progression of renal fibrosis, the decrease in peritubular capillary and oxygen quantity is an important characteristic [Citation89,Citation90]. Due to the different magnetism of oxygenated and deoxygenated hemoglobin, hypoxia can influence the proportions of oxygenated and deoxygenated hemoglobin, resulting in changes in the magnetic field characteristic. This pathological change is just the fundamental of Blood oxygenation level-dependent MRI (BOLD-MRI). The main parameter of BOLD-MRI to assess tissue oxygenation is the transverse relaxation time (T2*) or the reciprocal of T2* (R2*).
According to the aforementioned pathological change, Ogawa et al. first reported BOLD-MRI as a new technique for assessing tissue oxygenation [Citation91]. Subsequently, Prasad et al. first used BOLD-MRI to assess renal tissue oxygenation and found the feasibility of this technique in the human kidney [Citation92]. A study of animal UUO models showed that the T2* values were negatively correlated with the percentage of renal fibrotic area [Citation25]. Similar results were found in other animal experiments [Citation93–95]. Additionally, a study of animal UUO models found that the R2* values did not increase and were kept steady after 6 weeks, indicating that BOLD-MRI has little effect on the long-term assessment of renal fibrosis [Citation94].
Thus far, studies on BOLD-MRI in kidney disease focused on the predictive effect and monitoring of CKD; however, the results are controversial. A controlled study found that the R2* values are higher in patients with CKD than in healthy individuals and are positively correlated with serum creatinine and blood urea nitrogen. Additionally, a study showed that the R2* values were negatively correlated with eGFR and effective renal plasma flow [Citation96]. Comparable results have been found in other studies of CKD [Citation97,Citation98]. However, a few studies found that the parameter of BOLD-MRI had no relationship to kidney function [Citation99,Citation100] or eGFR [Citation100–102].
The application of BOLD-MRI in patients with renal fibrosis is limited but has more satisfying results than in patients with CKD. Inoue et al. used DWI and BOLD-MRI to assess renal fibrosis and hypoxia of the cortex in patients with diabetic nephropathy, non-diabetic CKD, and acute kidney injury. Consistent with the results of animal UUO models, it was suggested that the values of ADC and T2* were negatively correlated with the fibrotic area [Citation26]. A recent study on BOLD-MRI in kidney allografts found that the cortical R2* values were positively associated with interstitial fibrosis in patients with allograft injury [Citation27]. The different results of BOLD-MRI in CKD suggest that the R2* or T2*values are susceptible. The effective renal plasma flow and oxygen consumption caused by different renal diseases may influence the accuracy of BOLD-MRI. As studies related to renal fibrosis are limited, the potential of BOLD-MRI in assessing renal fibrosis remains to be elucidated.
Arterial spin labeling MRI
Arterial spin labeling (ASL) MRI uses the endogenous water of arterial blood as an endogenous tracer to detect tissue perfusion. Because of the affluent blood supply of the renal cortex, the cortical ASL perfusion or renal blood flow is the main indicator of this technique. Earlier studies found that ASL perfusion could reflect and quantify the perfusion in native and transplanted kidneys [Citation103,Citation104]. An animal experiment of ASL-MRI in rats after renal transplantation showed that the mean cortical perfusion was higher in rats with chronic rejections than in those with acute rejections, and the cortical renal blood flow was positively correlated with renal creatinine clearance [Citation28]. Subsequently, several studies confirmed that ASL perfusion had a significantly positive correlation with eGFR in CKD, including diabetic nephropathy [Citation105–107], and in transplanted kidneys [Citation108].
Studies on the application of ASL-MRI in renal fibrosis are still limited. A pilot study, which combined magnetic resonance elastography (MRE) and ASL to assess fibrosis in diabetic nephropathy, indicated that ASL perfusion decreased along with the exacerbation of fibrosis [Citation29]. A similar result was found in a study on renal allograft fibrosis [Citation109]. A single-center prospective study, aimed to explore the effect of ASL-MRI in kidney allografts with stable graft function, found that the combination of the cortical ASL perfusion could effectively determine allografts with subclinical pathology, which included interstitial fibrosis, peritubular capillaritis, and tubular atrophy [Citation30]. Because of the influence of low signal-to-noise ratio and resolution, as well as the limited experiences in kidney fibrosis, ASL-MRI has not been widely used in renal diseases, despite its enormous potential. Future studies on the determination method improvement are needed.
Magnetic resonance elastography
MRE relies on the detection of shear wave diffusion caused by mechanical vibrations to reflect tissue stiffness. MRE has been widely used in liver fibrosis [Citation110,Citation111]; however, its use in kidney fibrosis has been limited. Studies confirmed the feasibility and reliability of MRE in assessing renal stiffness [Citation112]. A study of rat models with nephrocalcinosis showed that the shear stiffness measured using MRE increased with the progression of nephrocalcinosis [Citation8]. Another study involving pig models with renal artery stenosis indicated that renal medullary stiffness measured using MRE had a positive correlation with the degree of fibrosis [Citation9]. Moreover, another animal study found that renal medullary stiffness is significantly associated with the degree of fibrosis [Citation113].
Compared with those of animal studies, the results of renal fibrosis studies in humans are inconsistent. A prospective cohort study of MRE in kidney allografts found that whole-kidney stiffness was positively associated with biopsy-derived fibrosis score and negatively associated with eGFR [Citation12], which were also observed in other studies of kidney allografts and native kidneys [Citation114–116]. Conversely, a recent study on MRE in patients with glomerulonephritis and amyloid A amyloidosis demonstrated that renal stiffness values are negatively correlated with the parameters of renal fibrosis. Meanwhile, the worse the renal function, the lower the renal stiffness values [Citation10]. A decrease in MRE shear stiffness has also been found in studies on diabetic nephropathy [Citation29], IgA nephropathy [Citation117], and lupus nephritis [Citation118]. Additionally, a recent study of MRE in patients with CKD showed that the MRE values are negatively correlated with the interstitial extracellular matrix volume. Moreover, this study drew the best mapping model as follows: interstitial extracellular matrix volume = 218.504–14.651 × In (MRE)–18.499 × In(eGFR) [Citation11]. The opposite result of MRE in renal fibrosis is explained by the influence of various factors, including renal perfusion, the deep location of the kidney, and the heterogeneity of the fibrotic kidney. Several studies confirmed that the MRE shear stiffness could be influenced by renal perfusion and had a positive correlation [Citation119–121]. Hence, the aforementioned factors must be considered when MRE is used to assess renal fibrosis, particularly the renal perfusion pressure.
Magnetization transfer imaging
Magnetization transfer imaging (MTI) is aimed principally at detecting increases in macromolecules in renal fibrosis. According to the different magnetization between free water molecules and water molecules combined with ECM, MTI can reflect the macromolecule content in the renal parenchyma, which indicates renal fibrosis indirectly. The index of MTI is the MT ratio (MTR), which can indicate the macromolecule content in the renal parenchyma. Several animal studies confirmed that MTR is positively associated with renal fibrosis [Citation122–124]. Additionally, an animal experiment found that MTR was little influenced by renal perfusion, indicating the reliability of MTR in assessing renal fibrosis [Citation125].
Quantitative MTI is a superior technique developed from the traditional MTI, which can more accurately quantify the macromolecule content of tissues. The main parameters of quantitative MTI are the pool size ratio, which is the ratio between the bound and free pool magnetization, and the bound pool fraction (f), which reflects the fraction of bound pool in tissues. A study involving murine models with kidney fibrosis found that the renal fibrotic region had a higher pool size ratio, particularly in the outer stripe of the outer medulla and cortex [Citation31]. The cortical regions with a higher pool size ratio were significantly correlated with fibrosis in murine models of diabetic nephropathy [Citation32]. Additionally, animal studies on renal artery stenosis found the great potential of the f values in assessing renal fibrosis, which were immune from the effects of tissue specificity, such as renal perfusion and elasticity [Citation126,Citation127]. Nevertheless, MTI has not been used in clinical practice, and studies involving patients with renal diseases are required.
Other MRI techniques
Furthermore, some other MRI techniques contribute to the assessment of renal fibrosis, such as native T1 mapping, susceptibility-weighted imaging (SWI), and elastin-specific MRI.
Animal experiments of native T1 mapping showed that T1 relaxation times, which represent the spin-lattice, is positively correlated with the degree of renal fibrosis [Citation63,Citation128]. In patients with chronic glomerulonephritis, the T1 relaxation times were also positively associated with the glomerular, vascular, tubulointerstitial, and interstitial fibrosis scores [Citation129]. However, no relationship between T1 relaxation times and histological results was found in patients with IgA nephropathy [Citation130]. T1 relaxation times were not only influenced by fibrosis but also affected by edema and inflammation, this may limit its application.
The studies on SWI in renal fibrosis were mainly preclinical studies, such as UUO models [Citation131,Citation132]. It was found that the cortical and medullary r values from SWI were significantly inversely associated with the renal fibrosis scores [Citation132]. A study on SWI with small sample sizes of type 2 diabetes mellitus suggested that the parameters of SWI were significantly correlated with renal function indexes [Citation133]. Because of the limited studies, there is still a long way to go before the clinical application of SWI.
A recent study on elastin-specific MRI in UUO rat models and patients with various kidney diseases showed that the expression of elastin detected using elastin-specific MRI agent (ESMA) could monitor and quantify kidney fibrosis, and ESMA-based molecular MRI is a promising technique for assessing kidney fibrosis [Citation134]. Nevertheless, there are some obstructions that must be overcome, such as the safety of contrast agents in end-stage renal disease and the lack of clinical evidence [Citation135].
Fluorescence microscopy
Fluorescence microscopy is one of the research focuses currently on in vivo imaging, particularly two-photon excitation microscopy. This new technique can detect second harmonic generation (SHG), which is produced by the interaction of light with collagen. Thus, kidney fibrosis can be quantified by detecting SHG, which reflects the content of collagen [Citation136]. The deep imaging via emission recovery detector is a novel technique that helps form a label-free, deep, and highly sensitive imaging of SHG.
Recently, studies on fluorescence microscopy are limited to animal models. A study involving murine UUO models showed that SHG imaging found more collagen in the fibrotic kidney; the combination of SHG imaging and fluorescence lifetime imaging is a promising technique that can accurately assess the degree of kidney fibrosis [Citation34]. Another study using HistoIndex’s Genesis200 platform in mice with UUO, which combines SHG imaging and two-photon excitation microscopy, showed that HistoIndex’s Genesis200 platform could sensitively detect the collagen deposition of the fibrotic kidney and is be a good supplement to traditional pathological examination [Citation35]. Studies on fluorescence microscopy are still in the preclinical stage; however, they show the possibility of visual and dynamic observation of kidney fibrosis.
Conclusions
As is known to all, biopsy is the golden standard for diagnosing kidney fibrosis. And the development of pathological microscopic image can also take the furthest advantage of renal biopsy. However, its invasiveness and sampling error are still considerable [Citation137]. The development of noninvasive imaging techniques, such as MRI and ultrasonography, offers an increasing number of methods for detecting and monitoring kidney fibrosis. In patients with kidney fibrosis, changes in tissue stiffness and the water diffusion pattern can be detected using ultrasound elastography and DWI. As novel MRI techniques, ASL-MRI and BOLD-MRI can separately detect changes in tissue perfusion and oxygenation to indirectly reflect kidney fibrosis. Fluorescence microscopy and PAI are both promising techniques, which may quantify the degree of fibrosis; however, their application is still in the research phases. The aforementioned imaging techniques not only help in diagnosing and monitoring kidney fibrosis but also contribute to evaluating the prognosis and effects of this disease.
For nephrologists, the more techniques, the harder it is to choose. Future studies should subdivide the disease spectrum of kidney fibrosis and choose an individualized detection method. Based on the current experiences, different imaging techniques should be selected for different diseases, not one fits all. For example, ASL-MRI and BOLD-MRI, which aim to detect tissue perfusion and oxygenation, may have priority in patients with ischemic kidney diseases, such as renal artery stenoses. Because of their convenience and flexibility, SE and SWE may be more suitable for risk screening and follow-up of kidney fibrosis. Multiparameter MRI can offer a more comprehensive understanding of the risk and degree of kidney fibrosis. PAI and fluorescence microscopy, which can quantify the collagen content, may be more popular in animal studies, at least for now. For clinicians, an individualized detection method is a vision for the future, and further studies are needed to tell them how to choose these noninvasive techniques for all kinds of kidney diseases.
Furthermore, the immaturity of detection and quality control has produced some conflicting results, which have confused numerous clinicians. Some values of these novel techniques, such as ADC and index of BOLD-MRI, can be influenced by kidney perfusion. In the preparation for imaging, any factors which can influence the kidney perfusion should be considered, such as acute disease (diarrhea or shock) and drugs (angiotensin-converting enzyme inhibitor or angiotensin II receptor blocker). Aimed to ensure accuracy, the application of these techniques in clinical practice should avoid these disturbing factors. Strict operating standards and quality controls are required to ensure the accuracy and reproducibility of these techniques. In addition, the heterogeneity of the fibrotic kidney is also an important factor to influence the accuracy of these techniques. Due to the subjectivity and sampling error, renal biopsy in human studies is difficult to guarantee the accuracy. Whole-kidney fibrosis detection can only be performed in animal studies, which provide important basic data for human studies. Also, the increase of sample size may minimize this influence in human studies.
Except for PAI, MTI, and fluorescence microscopy, most imaging techniques mentioned above have been used in clinical practice and studies nowadays. Ultrasound elastography and DWI have broader applications than other imaging techniques, but are still limited in kidney fibrosis. With the development of these noninvasive imaging techniques for kidney fibrosis, deepening the knowledge of these novel assessment approaches is necessary for nephrologists.
Disclosure statement
No potential conflict of interest was reported by the author(s).
Additional information
Funding
References
- Duffield JS, Lupher M, Thannickal VJ, et al. Host responses in tissue repair and fibrosis. Annu Rev Pathol. 2013;8:241–276.
- Falke LL, Gholizadeh S, Goldschmeding R, et al. Diverse origins of the myofibroblast-implications for kidney fibrosis. Nat Rev Nephrol. 2015;11(4):233–244.
- Orlacchio A, Chegai F, Del Giudice C, et al. Kidney transplant: usefulness of real-time elastography (RTE) in the diagnosis of graft interstitial fibrosis. Ultrasound Med Biol. 2014;40(11):2564–2572.
- Yoon H, Lee YS, Lim BJ, et al. Renal elasticity and perfusion changes associated with fibrosis on ultrasonography in a rabbit model of obstructive uropathy. Eur Radiol. 2020;30(4):1986–1996.
- Bob F, Grosu I, Sporea I, et al. Ultrasound-based shear wave elastography in the assessment of patients with diabetic kidney disease. Ultrasound Med Biol. 2017;43(10):2159–2166.
- Shi LQ, Sun JW, Miao HH, et al. Comparison of supersonic shear wave imaging-derived renal parenchyma stiffness between diabetes mellitus patients with and without diabetic kidney disease. Ultrasound Med Biol. 2020;46(7):1630–1640.
- Sommerer C, Scharf M, Seitz C, et al. Assessment of renal allograft fibrosis by transient elastography. Transpl Int. 2013;26(5):545–551.
- Shah NS, Kruse SA, Lager DJ, et al. Evaluation of renal parenchymal disease in a rat model with magnetic resonance elastography. Magn Reson Med. 2004;52(1):56–64.
- Korsmo MJ, Ebrahimi B, Eirin A, et al. Magnetic resonance elastography noninvasively detects in vivo renal medullary fibrosis secondary to swine renal artery stenosis. Invest Radiol. 2013;48(2):61–68.
- Güven AT, Idilman IS, Cebrayilov C, et al. Evaluation of renal fibrosis in various causes of glomerulonephritis by MR elastography: a clinicopathologic comparative analysis. Abdom Radiol. 2022;47(1):288–296.
- Zhang J, Yu Y, Liu X, et al. Evaluation of renal fibrosis by mapping histology and magnetic resonance imaging. Kidney Dis. 2021;7(2):131–142.
- Kirpalani A, Hashim E, Leung G, et al. Magnetic resonance elastography to assess fibrosis in kidney allografts. Clin J Am Soc Nephrol. 2017;12(10):1671–1679.
- Hueper K, Hensen B, Gutberlet M, et al. Kidney transplantation: multiparametric functional magnetic resonance imaging for assessment of renal allograft pathophysiology in mice. Invest Radiol. 2016;51(1):58–65.
- Zhao J, Wang ZJ, Liu M, et al. Assessment of renal fibrosis in chronic kidney disease using diffusion-weighted MRI. Clin Radiol. 2014;69(11):1117–1122.
- Xu X, Palmer SL, Lin X, et al. Diffusion-weighted imaging and pathology of chronic kidney disease: initial study. Abdom Radiol. 2018;43(7):1749–1755.
- Eisenberger U, Thoeny HC, Binser T, et al. Evaluation of renal allograft function early after transplantation with diffusion-weighted MR imaging. Eur Radiol. 2010;20(6):1374–1383.
- Yan YY, Hartono S, Hennedige T, et al. Intravoxel incoherent motion and diffusion tensor imaging of early renal fibrosis induced in a murine model of streptozotocin induced diabetes. Magn Reson Imaging. 2017;38:71–76.
- Feng Q, Ma Z, Wu J, et al. DTI for the assessment of disease stage in patients with glomerulonephritis–correlation with renal histology. Eur Radiol. 2015;25(1):92–98.
- Hueper K, Khalifa AA, Brasen JH, et al. Diffusion-weighted imaging and diffusion tensor imaging detect delayed graft function and correlate with allograft fibrosis in patients early after kidney transplantation. J Magn Reson Imaging. 2016;44(1):112–121.
- Cai XR, Yu J, Zhou QC, et al. Use of intravoxel incoherent motion MRI to assess renal fibrosis in a rat model of unilateral ureteral obstruction. J Magn Reson Imaging. 2016;44(3):698–706.
- Mao W, Zhou J, Zeng M, et al. Chronic kidney disease: pathological and functional evaluation with intravoxel incoherent motion diffusion-weighted imaging. J Magn Reson Imaging. 2018;47(5):1251–1259.
- Hashim E, Yuen DA, Kirpalani A. Reduced flow in delayed graft function as assessed by IVIM is associated with time to recovery following kidney transplantation. J Magn Reson Imaging. 2021;53(1):108–117.
- Li A, Liang L, Liang P, et al. Assessment of renal fibrosis in a rat model of unilateral ureteral obstruction with diffusion kurtosis imaging: comparison with alpha-SMA expression and (18)F-FDG PET. Magn Reson Imaging. 2020;66:176–184.
- Mao W, Ding Y, Ding X, et al. Diffusion kurtosis imaging for the assessment of renal fibrosis of chronic kidney disease: a preliminary study. Magn Reson Imaging. 2021;80:113–120.
- Woo S, Cho JY, Kim SY, et al. Intravoxel incoherent motion MRI-derived parameters and T2* relaxation time for noninvasive assessment of renal fibrosis: an experimental study in a rabbit model of unilateral ureter obstruction. Magn Reson Imag. 2018;51:104–112.
- Inoue T, Kozawa E, Okada H, et al. Noninvasive evaluation of kidney hypoxia and fibrosis using magnetic resonance imaging. J Am Soc Nephrol. 2011;22(8):1429–1434.
- Wang W, Yu Y, Wen J, et al. Combination of functional magnetic resonance imaging and histopathologic analysis to evaluate interstitial fibrosis in kidney allografts. Clin J Am Soc Nephrol. 2019;14(9):1372–1380.
- Zimmer F, Klotz S, Hoeger S, et al. Quantitative arterial spin labelling perfusion measurements in rat models of renal transplantation and acute kidney injury at 3T. Z Med Phys. 2017;27(1):39–48.
- Brown RS, Sun M, Stillman IE, et al. The utility of magnetic resonance imaging for noninvasive evaluation of diabetic nephropathy. Nephrol Dial Transplant. 2020;35(6):970–978.
- Wang W, Yu Y, Li X, et al. Early detection of subclinical pathology in patients with stable kidney graft function by arterial spin labeling. Eur Radiol. 2021;31(5):2687–2695.
- Wang F, Wang S, Zhang Y, et al. Noninvasive quantitative magnetization transfer MRI reveals tubulointerstitial fibrosis in murine kidney. NMR Biomed. 2019;32(11):e4128.
- Wang F, Katagiri D, Li K, et al. Assessment of renal fibrosis in murine diabetic nephropathy using quantitative magnetization transfer MRI. Magn Reson Med. 2018;80(6):2655–2669.
- Hysi E, He X, Fadhel MN, et al. Photoacoustic imaging of kidney fibrosis for assessing pretransplant organ quality. JCI Insight. 2020;5(10):e136995.
- Ranjit S, Dobrinskikh E, Montford J, et al. Label-free fluorescence lifetime and second harmonic generation imaging microscopy improves quantification of experimental renal fibrosis. Kidney Int. 2016;90(5):1123–1128.
- Bhuiyan S, Shen M, Chelvaretnam S, et al. Assessment of renal fibrosis and anti‐fibrotic agents using a novel diagnostic and stain‐free second‐harmonic generation platform. Faseb J. 2021;35(5):e21595.
- Weitzel WF, Kim K, Rubin JM, et al. Feasibility of applying ultrasound strain imaging to detect renal transplant chronic allograft nephropathy. Kidney Int. 2004;65(2):733–736.
- Dietrich CF, Barr RG, Farrokh A, et al. Strain elastography – How to do it?. Ultrasound Int Open. 2017;3(4):E137–E149.
- Gao J, Rubin JM, Weitzel W, et al. Comparison of ultrasound corticomedullary strain with doppler parameters in assessment of renal allograft interstitial fibrosis/tubular atrophy. Ultrasound Med Biol. 2015;41(10):2631–2639.
- Gao J, Min R, Hamilton J, et al. Corticomedullary strain ratio: a quantitative marker for assessment of renal allograft cortical fibrosis. J Ultrasound Med. 2013;32(10):1769–1775.
- Gao J, Weitzel W, Rubin JM, et al. Renal transplant elasticity ultrasound imaging: correlation between normalized strain and renal cortical fibrosis. Ultrasound Med Biol. 2013;39(9):1536–1542.
- Correas JM, Anglicheau D, Joly D, et al. Ultrasound-based imaging methods of the kidney-recent developments. Kidney Int. 2016;90(6):1199–1210.
- Bamber J, Cosgrove D, Dietrich CF, et al. EFSUMB guidelines and recommendations on the clinical use of ultrasound elastography. Part 1: basic principles and technology. Ultraschall Med. 2013;34(2):169–184.
- Turgutalp K, Balci Y, Ozer C, et al. Shear wave elastography findings in immunoglobulin a nephropathy patients: is it more specific and sensitive for interstitial fibrosis or interstitial fibrosis/tubular atrophy? Ren Fail. 2020;42(1):590–599.
- Guo LH, Xu HX, Fu HJ, et al. Acoustic radiation force impulse imaging for noninvasive evaluation of renal parenchyma elasticity: preliminary findings. PLoS One. 2013;8(7):e68925.
- Hu Q, Wang X, He H, et al. Acoustic radiation force impulse imaging for non-invasive assessment of renal histopathology in chronic kidney disease. PLoS One. 2014;9(12):e115051.
- Gokalp C, Oytun MG, Gunay E, et al. Acoustic radiation force impulse elastography may predict acute rejection in kidney transplantation. Transplant Proc. 2020;52(10):3097–3102.
- Radulescu D, Peride I, Petcu LC, et al. Supersonic shear wave ultrasonography for assessing tissue stiffness in native kidney. Ultrasound Med Biol. 2018;44(12):2556–2568.
- Nakao T, Ushigome H, Nakamura T, et al. Evaluation of renal allograft fibrosis by transient elastography (fibro scan). Transplant Proc. 2015;47(3):640–643.
- Arndt R, Schmidt S, Loddenkemper C, et al. Noninvasive evaluation of renal allograft fibrosis by transient elastography–a pilot study. Transpl Int. 2010;23(9):871–877.
- Wang L, Xia P, Lv K, et al. Assessment of renal tissue elasticity by acoustic radiation force impulse quantification with histopathological correlation: preliminary experience in chronic kidney disease. Eur Radiol. 2014;24(7):1694–1699.
- Lee J, Oh YT, Joo DJ, et al. Acoustic radiation force impulse measurement in renal transplantation: a prospective, longitudinal study with protocol biopsies. Medicine. 2015;94(39):e1590.
- Asano K, Ogata A, Tanaka K, et al. Acoustic radiation force impulse elastography of the kidneys: is shear wave velocity affected by tissue fibrosis or renal blood flow? J Ultrasound Med. 2014;33(5):793–801.
- Lee A, Joo DJ, Han WK, et al. Renal tissue elasticity by acoustic radiation force impulse. Medicine. 2021;100(3):e23561.
- Goertz RS, Amann K, Heide R, et al. An abdominal and thyroid status with acoustic radiation force impulse elastometry–a feasibility study: acoustic radiation force impulse elastometry of human organs. Eur J Radiol. 2011;80(3):e226–e230.
- Bota S, Bob F, Sporea I, et al. Factors that influence kidney shear wave speed assessed by acoustic radiation force impulse elastography in patients without kidney pathology. Ultrasound Med Biol. 2015;41(1):1–6.
- Gennisson JL, Grenier N, Combe C, et al. Supersonic shear wave elastography of in vivo pig kidney: influence of blood pressure, urinary pressure and tissue anisotropy. Ultrasound Med Biol. 2012;38(9):1559–1567.
- Srivastava A, Tomar B, Prajapati S, et al. Advanced non-invasive diagnostic techniques for visualization and estimation of kidney fibrosis. Drug Discov Today. 2021;26(8):2053–2063.
- Okumura K, Matsumoto J, Iwata Y, et al. Evaluation of renal oxygen saturation using photoacoustic imaging for the early prediction of chronic renal function in a model of ischemia-induced acute kidney injury. PLoS One. 2018;13(12):e206461.
- Ogunlade O, Connell JJ, Huang JL, et al. In vivo three-dimensional photoacoustic imaging of the renal vasculature in preclinical rodent models. Am J Physiol Renal Physiol. 2018;314(6):F1145–F1153.
- Lanzman RS, Ljimani A, Pentang G, et al. Kidney transplant: functional assessment with diffusion-tensor MR imaging at 3T. Radiology. 2013;266(1):218–225.
- Ebrahimi B, Rihal N, Woollard JR, et al. Assessment of renal artery stenosis using intravoxel incoherent motion diffusion-weighted magnetic resonance imaging analysis. Invest Radiol. 2014;49(10):640–646.
- Togao O, Doi S, Kuro-O M, et al. Assessment of renal fibrosis with diffusion-weighted MR imaging: study with murine model of unilateral ureteral obstruction. Radiology. 2010;255(3):772–780.
- Friedli I, Crowe LA, Berchtold L, et al. New magnetic resonance imaging index for renal fibrosis assessment: a comparison between diffusion-weighted imaging and T1 mapping with histological validation. Sci Rep. 2016;6:30088.
- Berchtold L, Crowe LA, Combescure C, et al. Diffusion-magnetic resonance imaging predicts decline of kidney function in chronic kidney disease and in patients with a kidney allograft. Kidney Int. 2022;101(4):804–813.
- Yang D, Ye Q, Williams DS, et al. Normal and transplanted rat kidneys: diffusion MR imaging at 7 T. Radiology. 2004;231(3):702–709.
- Yildirim E, Kirbas I, Teksam M, et al. Diffusion-weighted MR imaging of kidneys in renal artery stenosis. Eur J Radiol. 2008;65(1):148–153.
- Muller MF, Prasad PV, Bimmler D, et al. Functional imaging of the kidney by means of measurement of the apparent diffusion coefficient. Radiology. 1994;193(3):711–715.
- Boor P, Perkuhn M, Weibrecht M, et al. Diffusion-weighted MRI does not reflect kidney fibrosis in a rat model of fibrosis. J Magn Reson Imaging. 2015;42(4):990–998.
- Hueper K, Hartung D, Gutberlet M, et al. Magnetic resonance diffusion tensor imaging for evaluation of histopathological changes in a rat model of diabetic nephropathy. Invest Radiol. 2012;47(7):430–437.
- Kaimori JY, Isaka Y, Hatanaka M, et al. Diffusion tensor imaging MRI with spin-echo sequence and long-duration measurement for evaluation of renal fibrosis in a rat fibrosis model. Transplant Proc. 2017;49(1):145–152.
- Hueper K, Gutberlet M, Rodt T, et al. Diffusion tensor imaging and tractography for assessment of renal allograft dysfunction-initial results. Eur Radiol. 2011;21(11):2427–2433.
- Kaimori J, Isaka Y, Hatanaka M, et al. Visualization of kidney fibrosis in diabetic nephropathy by long diffusion tensor imaging MRI with spin-echo sequence. Sci Rep. 2017;7(1):5731.
- Liu Z, Xu Y, Zhang J, et al. Chronic kidney disease: pathological and functional assessment with diffusion tensor imaging at 3T MR. Eur Radiol. 2015;25(3):652–660.
- Li Y, Lee MM, Worters PW, et al. Pilot study of renal diffusion tensor imaging as a correlate to histopathology in pediatric renal allografts. AJR Am J Roentgenol. 2017;208(6):1358–1364.
- Gaudiano C, Clementi V, Busato F, et al. Diffusion tensor imaging and tractography of the kidneys: assessment of chronic parenchymal diseases. Eur Radiol. 2013;23(6):1678–1685.
- Kataoka M, Kido A, Yamamoto A, et al. Diffusion tensor imaging of kidneys with respiratory triggering: optimization of parameters to demonstrate anisotropic structures on fraction anisotropy maps. J Magn Reson Imaging. 2009;29(3):736–744.
- Heusch P, Wittsack HJ, Kropil P, et al. Impact of blood flow on diffusion coefficients of the human kidney: a time-resolved ECG-triggered diffusion-tensor imaging (DTI) study at 3T. J Magn Reson Imaging. 2013;37(1):233–236.
- Le Bihan D, Breton E, Lallemand D, et al. Separation of diffusion and perfusion in intravoxel incoherent motion MR imaging. Radiology. 1988;168(2):497–505.
- Ichikawa S, Motosugi U, Ichikawa T, et al. Intravoxel incoherent motion imaging of the kidney: alterations in diffusion and perfusion in patients with renal dysfunction. Magn Reson Imaging. 2013;31(3):414–417.
- Henkelman RM. Does IVIM measure classical perfusion? Magn Reson Med. 1990;16(3):470–475.
- Thoeny HC, De Keyzer F. Diffusion-weighted MR imaging of native and transplanted kidneys. Radiology. 2011;259(1):25–38.
- Zhang Q, Yu Z, Zeng S, et al. Use of intravoxel incoherent motion imaging to monitor a rat kidney chronic allograft damage model. BMC Nephrol. 2019;20(1):364.
- Mao W, Zhou J, Zeng M, et al. Intravoxel incoherent motion diffusion-weighted imaging for the assessment of renal fibrosis of chronic kidney disease: a preliminary study. Magn Reson Imaging. 2018;47:118–124.
- Poynton CB, Lee MM, Li Y, et al. Intravoxel incoherent motion analysis of renal allograft diffusion with clinical and histopathological correlation in pediatric kidney transplant patients: a preliminary cross-sectional observational study. Pediatr Transplant. 2017;21(6):12996.
- Huang Y, Chen X, Zhang Z, et al. MRI quantification of non-Gaussian water diffusion in normal human kidney: a diffusional kurtosis imaging study. NMR Biomed. 2015;28(2):154–161.
- Rosenkrantz AB, Padhani AR, Chenevert TL, et al. Body diffusion kurtosis imaging: basic principles, applications, and considerations for clinical practice. J Magn Reson Imaging. 2015;42(5):1190–1202.
- Pentang G, Lanzman RS, Heusch P, et al. Diffusion kurtosis imaging of the human kidney: a feasibility study. Magn Reson Imaging. 2014;32(5):413–420.
- Mao W, Ding Y, Ding X, et al. Pathological assessment of chronic kidney disease with DWI: is there an added value for diffusion kurtosis imaging? J Magn Reson Imaging. 2021;54(2):508–517.
- Choi YJ, Chakraborty S, Nguyen V, et al. Peritubular capillary loss is associated with chronic tubulointerstitial injury in human kidney: altered expression of vascular endothelial growth factor. Hum Pathol. 2000;31(12):1491–1497.
- Tanaka S, Tanaka T, Nangaku M. Hypoxia and dysregulated angiogenesis in kidney disease. Kidney Dis. 2015;1(1):80–89.
- Ogawa S, Lee TM, Kay AR, et al. Brain magnetic resonance imaging with contrast dependent on blood oxygenation. Proc Natl Acad Sci USA. 1990;87(24):9868–9872.
- Prasad PV, Edelman RR, Epstein FH. Noninvasive evaluation of intrarenal oxygenation with BOLD MRI. Circulation. 1996;94(12):3271–3275.
- Jiang K, Ponzo TA, Tang H, et al. Multiparametric MRI detects longitudinal evolution of folic acid-induced nephropathy in mice. Am J Physiol Renal Physiol. 2018;315(5):F1252–F1260.
- Zha T, Ren X, Xing Z, et al. Evaluating renal fibrosis with R2* histogram analysis of the whole cortex in a unilateral ureteral obstruction model. Acad Radiol. 2019;26(8):e202–e207.
- Zha TT, Xing ZY, Chen J, et al. Feasibility of using blood oxygen level-dependent magnetic resonance imaging to evaluate renal fibrosis of ureteral obstruction of rabbits. Zhonghua Yi Xue Za Zhi. 2017;97(47):3733–3738.
- Chen F, Yan H, Yang F, et al. Evaluation of renal tissue oxygenation using blood oxygen level-dependent magnetic resonance imaging in chronic kidney disease. Kidney Blood Press Res. 2021;46(4):441–451.
- Yang J, Yang S, Xu Y, et al. Evaluation of renal oxygenation and hemodynamics in patients with chronic kidney disease by blood oxygenation level-dependent magnetic resonance imaging and intrarenal doppler ultrasonography. Nephron. 2021;145(6):653–663.
- Pruijm M, Milani B, Pivin E, et al. Reduced cortical oxygenation predicts a progressive decline of renal function in patients with chronic kidney disease. Kidney Int. 2018;93(4):932–940.
- Luo F, Liao Y, Cui K, et al. Noninvasive evaluation of renal oxygenation in children with chronic kidney disease using blood-oxygen-level-dependent magnetic resonance imaging. Pediatr Radiol. 2020;50(6):848–854.
- Sławińska A, Serafin Z, Zawada E, et al. Noninvasive evaluation of renal tissue oxygenation with blood oxygen level-dependent magnetic resonance imaging early after transplantation has a limited predictive value for the delayed graft function. Pol J Radiol. 2018;83:389–393.
- Michaely HJ, Metzger L, Haneder S, et al. Renal BOLD-MRI does not reflect renal function in chronic kidney disease. Kidney Int. 2012;81(7):684–689.
- Khatir DS, Pedersen M, Jespersen B, et al. Evaluation of renal blood flow and oxygenation in CKD using magnetic resonance imaging. Am J Kidney Dis. 2015;66(3):402–411.
- Ritt M, Janka R, Schneider MP, et al. Measurement of kidney perfusion by magnetic resonance imaging: comparison of MRI with arterial spin labeling to Para-aminohippuric acid plasma clearance in male subjects with metabolic syndrome. Nephrol Dial Transplant. 2010;25(4):1126–1133.
- Artz NS, Sadowski EA, Wentland AL, et al. Arterial spin labeling MRI for assessment of perfusion in native and transplanted kidneys. Magn Reson Imaging. 2011;29(1):74–82.
- Gillis KA, McComb C, Patel RK, et al. Non-contrast renal magnetic resonance imaging to assess perfusion and corticomedullary differentiation in health and chronic kidney disease. Nephron. 2016;133(3):183–192.
- Cai YZ, Li ZC, Zuo PL, et al. Diagnostic value of renal perfusion in patients with chronic kidney disease using 3D arterial spin labeling. J Magn Reson Imaging. 2017;46(2):589–594.
- Mora-Gutierrez JM, Garcia-Fernandez N, Slon RM, et al. Arterial spin labeling MRI is able to detect early hemodynamic changes in diabetic nephropathy. J Magn Reson Imaging. 2017;46(6):1810–1817.
- Heusch P, Wittsack H, Blondin D, et al. Functional evaluation of transplanted kidneys using arterial spin labeling MRI. J Magn Reson Imaging. 2014;40(1):84–89.
- Yu YM, Wang W, Wen J, et al. Detection of renal allograft fibrosis with MRI: arterial spin labeling outperforms reduced field-of-view IVIM. Eur Radiol. 2021;31(9):6696–6707.
- Andoh F, Yue JL, Julea F, et al. Multifrequency magnetic resonance elastography for elasticity quantitation and optimal tissue discrimination: a two-platform liver fibrosis mimicking phantom study. NMR Biomed. 2021;34(8):e4543.
- Dong BT, Chen YP, Lyu GR, et al. Diagnostic accuracy of two-dimensional shear wave elastography and magnetic resonance elastography for staging liver fibrosis in patients with chronic hepatitis B: a systematic review and meta-analysis. J Gastroenterol Hepatol. 2021;37(8):1646.
- Low G, Owen NE, Joubert I, et al. Reliability of magnetic resonance elastography using multislice two-dimensional spin-echo echo-planar imaging (SE-EPI) and three-dimensional inversion reconstruction for assessing renal stiffness. J Magn Reson Imaging. 2015;42(3):844–850.
- Zhang X, Zhu X, Ferguson CM, et al. Magnetic resonance elastography can monitor changes in medullary stiffness in response to treatment in the swine ischemic kidney. MAGMA. 2018;31(3):375–382.
- Lee CU, Glockner JF, Glaser KJ, et al. MR elastography in renal transplant patients and correlation with renal allograft biopsy: a feasibility study. Acad Radiol. 2012;19(7):834–841.
- Kim JK, Yuen DA, Leung G, et al. Role of magnetic resonance elastography as a noninvasive measurement tool of fibrosis in a renal allograft: a case report. Transplant Proc. 2017;49(7):1555–1559.
- Han JH, Ahn J, Kim J. Magnetic resonance elastography for evaluation of renal parenchyma in chronic kidney disease: a pilot study. Radiol Med. 2020;125(12):1209–1215.
- Lang ST, Guo J, Bruns A, et al. Multiparametric quantitative MRI for the detection of IgA nephropathy using tomoelastography, DWI, and BOLD imaging. Invest Radiol. 2019;54(10):669–674.
- Marticorena GS, Grossmann M, Bruns A, et al. Tomoelastography paired with T2* magnetic resonance imaging detects lupus nephritis with normal renal function. Invest Radiol. 2019;54(2):89–97.
- Gandhi D, Kalra P, Raterman B, et al. Magnetic resonance elastography‐derived stiffness of the kidneys and its correlation with water perfusion. NMR Biomed. 2020;33(4):e4237.
- Wilson MP, Katlariwala P, Low G. The utility of magnetic resonance elastography for native renal fibrosis is questionable and necessitates future research with rigorous methodology. Transl Res. 2020;221:110–111.
- Warner L, Yin M, Glaser KJ, et al. Noninvasive in vivo assessment of renal tissue elasticity during graded renal ischemia using MR elastography. Invest Radiol. 2011;46(8):509–514.
- Jiang K, Ferguson CM, Woollard JR, et al. Magnetization transfer magnetic resonance imaging noninvasively detects renal fibrosis in swine atherosclerotic renal artery stenosis at 3.0 T. Invest Radiol. 2017;52(11):686–692.
- Jiang K, Ferguson CM, Ebrahimi B, et al. Noninvasive assessment of renal fibrosis with magnetization transfer MR imaging: validation and evaluation in murine renal artery stenosis. Radiology. 2017;283(1):77–86.
- Afarideh M, Jiang K, Ferguson CM, et al. Magnetization transfer imaging predicts porcine kidney recovery after revascularization of renal artery stenosis. Invest Radiol. 2021;56(2):86–93.
- Jiang K, Ferguson CM, Woollard JR, et al. Magnetization transfer imaging is unaffected by decreases in renal perfusion in swine. Invest Radiol. 2019;54(11):681–688.
- Jiang K, Fang Y, Ferguson CM, et al. Quantitative magnetization transfer detects renal fibrosis in murine kidneys with renal artery stenosis. J Magn Reson Imaging. 2020;2020:27370.
- Jiang K, Ferguson CM, Grimm RC, et al. Reliable assessment of swine renal fibrosis using quantitative magnetization transfer imaging. Invest Radiol. 2022;57(5):334–342.
- de Miguel MH, Yeung HN, Goyal M, et al. Evaluation of quantitative magnetic resonance imaging as a noninvasive technique for measuring renal scarring in a rabbit model of antiglomerular basement membrane disease. J Am Soc Nephrol. 1994;4(11):1861–1868.
- Wu J, Shi Z, Zhang Y, et al. Native T1 mapping in assessing kidney fibrosis for patients with chronic glomerulonephritis. Front Med. 2021;8:772326.
- Graham-Brown MP, Singh A, Wormleighton J, et al. Association between native T1 mapping of the kidney and renal fibrosis in patients with IgA nephropathy. BMC Nephrol. 2019;20(1):256.
- Zhang JG, Xing ZY, Zha TT, et al. Feasibility of susceptibility weighted imaging in the evaluation of renal fibrosis induced by unilateral ureteral obstruction in white rabbits. Zhonghua Yi Xue Za Zhi. 2017;97(45):3573–3578.
- Zhang JG, Xing ZY, Zha TT, et al. Longitudinal assessment of rabbit renal fibrosis induced by unilateral ureteral obstruction using two-dimensional susceptibility weighted imaging. J Magn Reson Imaging. 2018;47(6):1572–1577.
- Jiang Z, Wang Y, Ding J, et al. Susceptibility weighted imaging (SWI) for evaluating renal dysfunction in type 2 diabetes mellitus: a preliminary study using SWI parameters and SWI-based texture features. Ann Transl Med. 2020;8(24):1673.
- Sun Q, Baues M, Klinkhammer BM, et al. Elastin imaging enables noninvasive staging and treatment monitoring of kidney fibrosis. Sci Transl Med. 2019;11(486):eaat4865.
- Caroli A, Remuzzi A, Remuzzi G. Does MRI trump pathology? A new era for staging and monitoring of kidney fibrosis. Kidney Int. 2020;97(3):442–444.
- Ranjit S, Lanzano L, Libby AE, et al. Advances in fluorescence microscopy techniques to study kidney function. Nat Rev Nephrol. 2021;17(2):128–144.
- Asadzadeh S, Khosroshahi HT, Abedi B, et al. Renal structural image processing techniques: a systematic review. Ren Fail. 2019;41(1):57–68.