
Abstract
Background
Since in chronic kidney disease (CKD) iron deficiency anemia (IDA) can coexist with inflammation-induced immobilization of iron in macrophages (anemia of chronic disorders – ACD), we assessed the utility of ferritin, transferrin saturation (TSAT), and hepcidin for differentiation of mixed IDA-ACD from ACD, using bone marrow (BM) examination as reference.
Methods
This cross-sectional, single-center study analyzed 162 non-dialysis iron and epoietin-naïve CKD patients (52% males, median age 67 years, eGFR 14.2 mL/min 1.73 m2, hemoglobin 9.4 g/dL). BM aspiration, serum hepcidin (ELISA), ferritin, TSAT, and C-Reactive protein (CRP) were the main studied parameters.
Results
ACD was seen in 51%, IDA-ACD in 40%, while “pure” IDA in only 9%. In univariate and binomial analyses, IDA-ACD differed from ACD by lower ferritin and TSAT, but not by hepcidin or CRP. Correspondingly, in receiver operating curve analysis, ferritin and TSAT differentiated IDA-ACD from ACD, at cutoffs of 165 ng/mL and 14%, but with moderate precision (sensitivity and specificity of 72%, and 61%, respectively).
Conclusion
The mixed pattern IDA-ACD could be more prevalent than estimated in non-dialysis CKD. Ferritin and, to a lesser degree, TSAT are useful in the diagnosis of IDA superimposed on ACD, while hepcidin, although reflecting BM macrophages iron, seems to have limited utility.
Background
Anemia is commonly seen in Chronic kidney disease (CKD) patients. Although the relative erythropoietin deficiency is the major contributor (at least in later stages), other factors such as iron metabolism abnormalities, chronic inflammation, reduced bone marrow response to erythropoietin, and shortened red cell lifespan also play a part [Citation1]. Iron deficiency anemia (IDA) diagnosed by bone marrow iron depletion was reported in proportions as high as 40–70% in anemic Chronic kidney disease (CKD) patients [Citation2–5]. The depletion of iron in bone marrow (BM) macrophages is in contrast with the massive iron deposits in the liver and spleen described in older studies [Citation6,Citation7], suggesting an abnormal CKD-related iron distribution. More recently, the abnormal iron distribution in CKD-related anemia was attributed to iron immobilization in macrophages by the high inflammation-induced hepcidin synthesis [Citation8,Citation9]. Accordingly, in the advanced CKD stage, CKD-related anemia was compounded by anemia of chronic disorders (ACD) [Citation10,Citation11].
However, the diagnosis of ACD resides not only on abnormal bone marrow iron distribution – demonstrated by Perls’ stain (increased macrophage iron) - but also on the presence of iron-depleted erythroblasts with defective hemoglobinization, and on nonspecific inflammatory changes, which could only be observed by a detailed BM examination [Citation12].
On the other hand, IDA and ACD could coexist (combined pattern IDA-ACD), as suggested by studies reporting an improvement in hemoglobin levels in anemic CKD patients without IDA [Citation13]. The relationship between IDA and ACD is further compounded in CKD by the inappropriate endogenous production of erythropoietin or by exogenous erythropoietin administration. Nevertheless, the distinction between IDA-ACD and ACD is clinically important, as iron supplementation is indicated in the first but contraindicated in the last [Citation14,Citation15]. However, this was less investigated in CKD-related anemia.
As bone marrow examination is seldom performed in the current practice despite being the gold standard [Citation16], the diagnosis of iron deficiency (associated or not with ACD) is made using peripheral iron indices, ferritin, and the transferrin saturation index (TSAT). Despite intensive investigation, the diagnostic criteria based on peripheral iron indices in CKD are still a matter of debate, since the sensitivity of classic cutoff values (serum ferritin ≤100ng/mL and transferrin saturation 20%) to detect iron deficiency was questioned [Citation16]. Anyway, the recommended cutoffs for IDA are higher than in the general population with iron deficiency and the guidelines for iron therapy are not sharply defined [Citation14,Citation16].
Hepcidin, the master iron regulator, blocks the iron export from cells, is suppressed by iron deficiency and erythropoietin, is stimulated by inflammation, and possibly retained as kidney function declines [Citation17]. Increased hepcidin impedes both intestinal iron absorption and iron release from storage sites, thus decreasing the availability of iron for erythropoiesis [Citation18]. Higher levels were reported in CKD and hepcidin was expected to solve the problem of IDA differentiation from ACD. However, conflicting results were reported and the clinical usefulness of hepcidin assessment is still to be proved [Citation19–22].
We thought to evaluate the prevalence of the combined IDA-ACD pattern in CKD-related anemia, and the diagnostic utility of ferritin, transferrin saturation index, and hepcidin in anemic, non-dialysis, iron, and epoetin free, CKD patients, using bone marrow examination as reference.
Methods
Patients
In this single-center cross-sectional observational study, 167 patients were enrolled over a twelve months period (January – December 2019). The inclusion criteria were an estimated glomerular filtration rate (eGFR, abbreviated MDRD formula, which was validated on a definite CKD cohort [Citation23]) lower than 60 mL/min 1.73 m2 and hemoglobin (Hb) lower than 11 g/dL (the cutoff value recommended by the national guidelines for the start of diagnostic assessment and treatment of CKD-related anemia), both at three measurements at least one week apart in the previous 8 weeks.
Patients with any previous iron or epoetin therapy, renal replacement therapy, active infections, cancer, blood transfusions and/or active bleeding within the preceding 3 months, hemolytic anemia, folate or vitamin B12 deficiency (mainly assessed from the bone marrow examination and erythrocytes indices), severe malnutrition (Subjective Global Assessment – SGA – score of C, on an A, B, C scale) [Citation24], severe hyperparathyroidism (intact serum parathyroid hormone >800 pg/mL) or hypothyroidism were excluded.
The fifteen controls were selected from the hospital staff with untreated iron deficiency anemia (Hb < 12 g/dL; TSAT <20%, ferritin <50 ng/mL), without proteinuria and with normal kidney function (eGFR 60 mL/min), otherwise healthy. The main causes of iron deficiency were genital loss by monthly periods (9 cases) and occult gastrointestinal loss in the remaining 6 subjects (Helicobacter pylori found in 3, antral gastritis in 2, and hiatal hernia in 1 case).
All subjects signed an informed consent form prior to any study procedure. The study was conducted in accordance with the Declaration of Helsinki with subsequent revisions and was approved by the local Research Ethics Committee (no. 11/2019).
Bone marrow examination
Bone marrow was collected by aspiration from the iliac crest only in the CKD subjects. The smears were prepared from marrow fragments, colored with Perls’ Prussian blue and May-Grünwald-Giemsa stains.
For the Perls’ stain examination, the solution was prepared immediately before the procedure by mixing equal volumes (30 mL each) of potassium hexacyanoferrate (II) 2% and hydrochloric acid 2%. The air-dried bone marrow aspirate fresh smears spread on glass slides were firstly fixed in absolute methanol for 3 min and left to air-dry. The fixed and dried slides were submerged into the staining solution for 20 min, rinsed in distilled water, then counterstained with nuclear fast red solution 0.1% for 5 min, and rinsed again in distilled water. After being air-dried, the stained smears were examined with a dry objective (10× magnification), and then with an oil immersion objective (100× magnification).
The smears were interpreted by a senior hematologist who had no knowledge of the patients’ iron status. Additional slides from aspirate were prepared if necessary, and at least nine bone marrow particles were reviewed for a final diagnosis.
The occurrence of siderotic granules in macrophages was semi-quantitatively graded, using a 0–6 scale [Citation25–27]:
score 0 – no iron granulations were seen under high-power magnification (100×);
score 1 – small iron granulations were just visible in few cells under high-power magnification (100×);
score 2 – sparsely iron granulations were just visible under low-power magnification (10×);
score 3 – multiple small iron granulations were visible all over the smear (10×);
score 4 – larger iron granulations were seen all over the smear and tend to form small groups (10×);
score 5 – big, dense groups of iron granulations were seen all over the smear (10×);
score 6 – big, dense groups of iron granulations cover all macrophage surface (10×).
Patients with a score of 0 or 1 were considered iron deficient, those graded from 2 to 4 as having normal macrophage iron, and those graded from 5 to 6, as having macrophage iron overload.
Erythroblasts with green-blue particles on Perls’ stain were defined as sideroblasts. According to the number of siderotic granules, sideroblasts were classified as type 0 (0 granules), type 1 (1–3 granules), or type 2 (≥3 granules) [Citation28]. The percentages of each type of sideroblasts were computed.
The slides were also examined for nonspecific inflammatory changes: increased plasma cells, mast cells, and macrophages [Citation29].
Bone marrow examination was classified as normal (macrophage iron 2–4, sideroblasts in normal percentage), iron deficiency (macrophage iron 0 or 1, sideroblasts absent or present in a very low percentage), anemia of chronic conditions – ACD (macrophage iron ≥5, sideroblasts absent or present in very low percentage and nonspecific inflammatory changes) or combined iron deficiency and anemia of chronic conditions – IDA-ACD (macrophage iron 2–4, sideroblasts absent or in a very low percentage and nonspecific inflammatory changes).
No adverse events were reported after BM aspiration procedure in any subject enrolled in the study.
Analytical methods
Hepcidin-25 was assessed in serum by a competitive ELISA method, using a kit produced by Peninsula Laboratories, LLC (Bachem, UK), as previously described [Citation30]. The method repeatability coefficient of variation was 2.7% and 1.1%, for intra- and interseries measurement, respectively. Allowable non-linearity was within 10% limits for hepcidin-25 concentrations from 0.01 to 25.00 ng/mL. Blood samples from controls were used to define a reference for serum hepcidin-25.
Serum ferritin and serum transferrin were measured by immunoturbidimetric methods (Good Biotech – Taiwan; Giesse Diagnostics – Italy) on an autoanalyzer Olympus AU400. Total serum iron binding capacity was calculated as serum transferrin × 1.25. Serum iron was assessed by a colorimetric method (Giesse Diagnostics – Italy). Transferrin saturation index (TSAT) was calculated as the percentage of serum iron from total serum iron binding capacity.
C-reactive protein (CRP) was assessed with a high-sensitivity latex immunoturbidimetric method (Giesse Diagnostics –Italy).
Blood samples and BM aspiration were performed at the same moment.
Statistical analysis
Data are presented as percentages or median and 95% confidence intervals (95%CI), because all continuous variables were abnormally distributed (Shapiro–Wilk test), both in the whole cohort and in study groups. Kruskal–Wallis or Chi-squared tests were used to compare groups, as required. Pairwise comparisons were assessed by the Tukey–Kramer post-hoc test.
Binomial logistic regression was used to analyze relationships between bone marrow pattern - mixed IDA-ACD (n = 65) versus ACD (n = 82) – and the relevant parameters. Data with non-normal distribution were log-transformed, using natural logarithms.
Receiver-operating characteristic (ROC) curves were created using bone marrow iron status (IDA-ACD versus ACD) as dichotomous variables, ferritin and TSAT as continuous variables. The area under the curve (AUC) was measured; sensitivity and specificity were calculated at various cutoff values.
Statistical analyses were performed with Analyze-it® (Analyze-it Software, Ltd. Leeds, UK) and SPSS (SPSS Inc. Chicago, USA) packages.
Results
More than half (52%) of the CKD patients were in stage G5, while the remaining were equally distributed between stage G4 and G3 (24% each). The proportions of CKD stages in study subgroups defined by the BM iron did not significantly differ (p = .43). Similarly, no differences among subgroups were found regarding CKD etiology. In the entire cohort, vascular nephropathies were the main primary kidney disease, accounting for 45% of cases, followed by diabetic kidney disease (19%), primary glomerulopathies (16%), and chronic tubulointerstitial nephropathies (13%). None of the subjects were on immunosuppressive therapy at the time of the study.
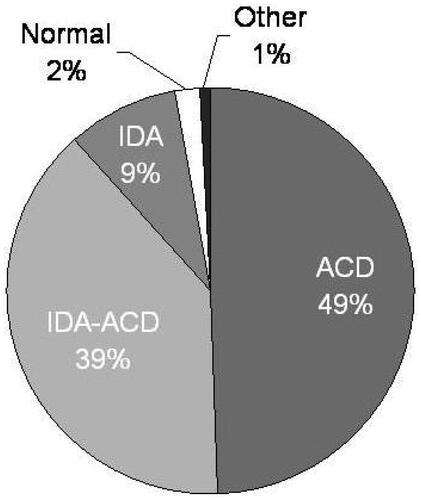
At bone marrow examination 4 patients were normal, 1 had erythrodysplasia, 15 IDA, 82 ACD, and 65 had IDA-ACD (). Patients with normal bone marrow and erythrodysplasia were excluded and 162 patients were retained in the final analysis (52% males, median age 67 [95% CI 63–70] years, 23% with diabetes mellitus, median eGFR 18.0 [95% CI 14.1–22.9] mL/min 1.73 m2, hemoglobin 9.9 [95% CI 9.6–10.2] g/dL).
Figure 1. Bone marrow examination in 167 anemic chronic kidney disease patients. IDA: Iron deficiency anemia; ACD: Anemia of chronic disorders.
CKD patients were older and had lower hemoglobin than controls. Also, serum ferritin, hepcidin, and CRP were higher in CKD anemic subjects, while TSAT has similar levels ().
Table 1. Investigated parameters in the chronic kidney disease study groups.
With increasing CKD stage and decreasing eGFR, although iron status parameters were higher, median hemoglobin was similar, probably because CRP levels were also higher ().
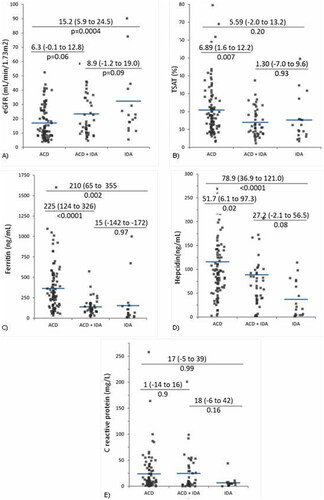
Lower TSAT, ferritin, and hepcidin were found in subjects with mixed IDA-ACD as compared to the ACD group, while none of the investigated parameters were significantly different from the “pure” IDA group (). Higher ferritin and hepcidin allowed for ACD differentiation from both IDA and IDA-ACD groups. Also, patients with ACD had lower kidney function, but similar CRP in comparison with the other two groups ().
Figure 2. Kidney function, iron status and inflammation parameters in investigated groups. (A) Estimated glomerular filtration rate (eGFR); (B) transferrin saturation (TSAT); (C) serum ferritin; (D) serum hepcidin-25. (E) C-reactive protein (CRP). CKD: chronic kidney disease; IDA: iron deficiency anemia; ACD: anemia of chronic disorders.
The distinction of IDA-ACD from ACD, which is clinically meaningful, was further evaluated by binomial logistic regression. In a model allowing for differentiation in 38% of cases, the independent predictors of IDA-ACD were younger age, lower ferritin, and TSAT. Although retained in the model, hemoglobin and hepcidin had no significant contribution, while CRP was eliminated ().
Table 2. Determinants of the differences between IDA-ACD – ACD (binomial regression).
In ROC analysis, ferritin performed better than TSAT in differentiating IDA-ACD from ACD. Areas under the curve (AUCs) were 0.80 (0.72–0.87) and 0.66 (0.56–0.75), respectively (). The cutoffs with the best combination of specificity and sensibility were 165 ng/mL (sensitivity 0.72 [0.57–0.84]; specificity [0.72 (0.62–0.81]) for ferritin and 14% (sensitivity 0.61 [0.45–0.75]; specificity [0.61 (0.51–0.71]) for TSAT ().
Figure 3. The utility of ferritin and TSAT in the differentiation of IDA-ACD from ACD. TSAT: transferrin saturation; IDA-ACD: iron deficiency anemia – anemia of chronic disorders; ACD: anemia of chronic disorders.
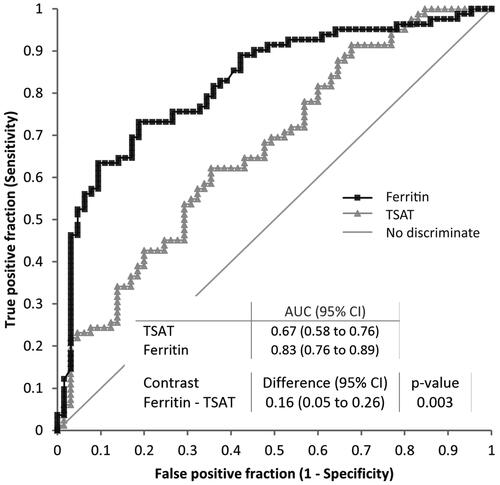
Table 3. Selected cutoff values for ferritin and TSAT for IDA-ACD differentiation from ACD.
Therefore, in clinical terms, ACD is more probable when serum ferritin is higher than 165 ng/mL and when TSAT is higher than 14%. However, it could be speculated that the diagnostic utility of TSAT is lower than that of ferritin, as its sensitivity at a cutoff of 14% is questionable, being around 0.5 (which designate the discrimination line), meaning that some cases with ACD are falsely identified as having IDA-ACD when using a cutoff of 14% for TSAT.
Discussion
CKD-related anemia is common and its prevalence increases as kidney function declines, reaching up to 80% when eGFR is lower than 15 mL/min 1.73 m2, and is associated with poor clinical outcomes [Citation31]. Its main pathogenetic factors are the relative erythropoietin deficiency, altered iron metabolism, both related to inflammation, and shorted red blood cells life span, all driven by the decline in kidney function [Citation14].
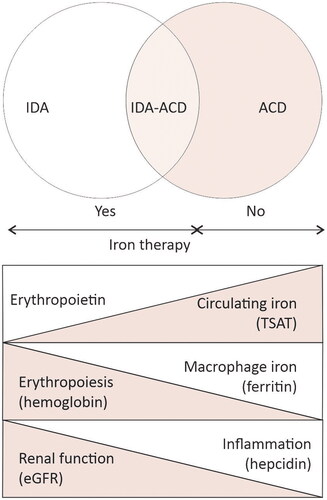
Altered iron metabolism produces anemia by reducing the iron availability for erythropoiesis and could result from a combination of two main mechanisms: iron deficiency (disbalance between intake, low absorption, and digestive loss), and altered iron distribution, e.g., iron immobilization in macrophages due to the inflammation-related increase in hepcidin [Citation32,Citation33]. The contribution of each mechanism in the pathogenesis of disturbed iron metabolism could vary – depending on CKD complications and the level of inflammation, generally reflected by eGFR – from one patient to another and in the same patient in time. Accordingly, the clinical presentation could vary from “pure” iron deficiency anemia (IDA) to “anemia of chronic disorders” (ACD). However, an overlap between both could be possible (IDA-ACD) ().
Figure 4. The spectrum of iron metabolism along chronic kidney disease stages. In early stages of CKD, the disbalance between iron intake and losses, reduces both the circulating iron (low transferrin saturation – TSAT) and the iron stores (low serum ferritin). the decline in erythropoiesis (low hemoglobin) is driven mostly by iron deficiency, e.g., “pure” iron deficiency anemia (IDA). in advanced CKD, as kidney function declines, erythropoietin production decreases and inflammation progress along with the increase in hepcidin production. Hepcidin inhibits hemoglobin production by immobilizing iron in macrophages (high serum ferritin). anemia is driven by iron restricted erythropoiesis, and by low erythropoietin levels, while circulating iron (TSAT) could be higher lower than normal, e.g., anemia of chronic disorders (ACD). during CKD, the individual contribution of each pathogenic factor of renal anemia varies, resulting in various combination of IDA and ACD. The identification of IDA, IDA-ACD overlap or ACD using serum ferritin and TSAT is important because is recommended in IDA and IDA-ACD while is contraindicated in ACD.
Studies have shown that CKD patients without IDA respond to iron therapy, even without erythropoietin supplements [Citation34], suggesting that iron therapy could be beneficial in certain patients with CKD-related anemia due to inflammation but not in those with ACD, where iron overload might be a concern [Citation32]. Thus, we hypostatized that some CKD patients with ACD could also have iron deficiency (IDA-ACD). Accordingly, in this study, we explored the utility of peripheral iron indices and of serum hepcidin to differentiate IDA-ACD from ACD, using bone marrow iron as a reference, an aspect which was not previously explored for serum hepcidin in the setting of CKD (it was tested only in the elderly general population [Citation33]).
The main finding of this study is the high proportion of CKD patients with a combined pattern of altered bone marrow iron distribution, e.g., iron deficiency superimposed on anemia of chronic conditions. Ferritin and transferrin could differentiate the mixed IDA – ACD pattern from anemia of chronic disorders and guide iron administration with moderate precision, but hepcidin measurement had little utility.
In contrast with previous reports [Citation2–5], where the depletion of siderotic particles was seen in more than 40% of cases, in this cohort of anemic, iron, and erythropoietin-free patients with advanced CKD, bone marrow examination revealed “pure” iron deficiency in only 9%, while anemia of chronic disorders and the combined pattern iron deficiency –anemia of chronic conditions were more prevalent (51% and 40%). A possible explanation is the careful BM examination in this study that used both Pearls’ and May-Grünwald-Giemsa stains and focused not only on iron particles but also evaluated the nonspecific inflammatory changes. However, the total proportion of iron-deficient patients (IDA and mixed IDA-ACD, 40 + 9 = 49%) was close to previous reports. Therefore, the mixed IDA-ACD pattern could be more frequent in CKD-related anemia than previously accepted, which would explain not only the higher cutoff for ferritin and TSAT in CKD, but also why patients having apparently enough medullary iron respond by an increase in hemoglobin to intravenous iron therapy [Citation35].
Peripheral iron indices varied in accord with BM categories, suggesting a preserved relationship between iron status and peripheral iron indices even in CKD-related anemia. Moreover, CKD patients with “pure” IDA had similar TSAT and ferritin profiles with controls, despite having higher inflammation and hepcidin. Advanced CKD is an inflammatory condition for various reasons, as oxidative and nitrosative stress followed by accumulation of advanced glycosylation end products and advanced oxidation protein products, enhanced synthesis of cytokines, systemic acidosis, altered gut microbiota, modified metabolism of adipocytes [Citation36].
On the other hand, when focusing on the IDA-ACD group, TSAT was similarly reduced as in “pure” IDA, but lower than in ACD. Accordingly, IDA-ACD is closer to “pure” IDA in terms of iron availability for erythropoiesis, than to ACD. An ascending trend in ferritin, hepcidin, and CRP was observed along the CKD groups defined based on BM iron (). However, only ferritin and hepcidin were significantly lower in IDA-ACD than in ACD, while CRP was similar. Thus, IDA-ACD is closer to ACD in terms of inflammation-mediated iron immobilization than to CKD-IDA. Hence, the IDA-ACD group is in an intermediate position, merging characteristics of “pure” IDA (low TSAT) and of ACD (high ferritin, hepcidin, and CRP).
Nevertheless, the values of ferritin in “pure” IDA-CKD were indistinct from those observed in controls with normal kidney function (40 ng/mL), while in IDA-ACD (122 ng/mL) were closer to those recommended for iron deficiency diagnosis in CKD (100–200ng/mL) [Citation21]. As the IDA-ACD and ACD groups were prevalent in this cohort, it could be speculated that the higher than in the general population thresholds recommended in CKD for iron deficiency diagnosis would result from the frequent association of iron deficiency with ACD in CKD-related anemia.
The distinction between IDA-ACD and ACD is clinically important. Iron therapy, although can improve CKD-related anemia in 36% of non-dialysis CKD patients [Citation37], and even 35% of patients with replete bone marrow iron respond to intravenous iron supplementation by an increase in hemoglobin [Citation5], is not harmless. For instance, iron administration guided by the current thresholds (ferritin under 500 ng/mL and TSAT <30%) [KDIGO, 2012] resulted in an increase in hepatic iron in one-third of dialysis patients [Citation38] and in more than a half of stage 3–5 CKD patients [Citation39]. Thus, iron therapy would be indicated when an iron deficiency exists whether associated with ACD, but not in the case of ACD without iron deficiency [Citation14].
On the other hand, IDA, IDA-ACD, and ACD cause erythropoietin resistance which is reversible only in IDA and IDA-ACD. Accordingly, the diagnosis of IDA-ACD and adequate iron supplementation could reduce or even prevent epoetin usage.
In this study, the utility of lower ferritin and TSAT to differentiate IDA-ACD from ACD-CKD was supported by both regression and ROC analyses. Ferritin performed better than TSAT: at a cutoff of 165 ng/mL, ferritin identified patients with mixed IDA-ACD in 72%, and precisely excluded those with ACD in 72% of cases, while TSAT at a cutoff of 14%, had 61% sensitivity and 61% specificity. Thus, ferritin over 165 ng/mL could be a clinically useful indicator of ACD in CKD-related anemia, while a TSAT higher than 14% has a moderate utility. However, since areas under the curve were below 0.8, the suggested level for a good screening test, it should be emphasized that neither parameter is ideal.
Hepcidin was similarly high in IDA-ACD and ACD groups as compared to “pure” IDA, which supports a role for hepcidin in the disturbed iron distribution in CKD-related anemia. Inflammation – which up-regulates hepcidin synthesis [Citation17,Citation40] – was only moderate in the whole cohort and without differences between groups. Thus, although inflammation could be responsible of the increased hepcidin levels, it only partially explains the dissimilarities in hepcidin levels between groups, which is in accord with previous reports indicating a close relationship between hepcidin and iron stores (as assessed by ferritin in CKD), even when moderate inflammation coexisted [Citation41,Citation42]. On the other hand, in our data, hepcidin was not an independent predictor of IDA-ACD. Hence, contrary to expectations [Citation17,Citation19,Citation43] and some reports from the general population [Citation44], hepcidin seems to have little utility in IDA-ACD differentiation from ACD and, accordingly, in the management of iron therapy. Similar results were recently reported in a group of elderly with newly diagnosed anemia and concomitant inflammation, but with normal kidney function, where serum hepcidin (at a cutoff of 21 ng/mL) was not superior to serum ferritin for discriminating iron deficiency [Citation33].
Our study has several limits. The analysis is entirely based on bone marrow examination, and even if all cautions were taken, the subjectivity of the semiquantitative method of iron scoring could not be excluded. More refined methods, like chemical assessment of bone marrow iron content, would have been preferable but was not available. As the real prevalence of anemia patterns in CKD is largely unknown, we used sensitivity and specificity instead of positive and negative predictive values, which limits the clinical applicability of our results. Even so, the trends are suggestive enough. Lastly, we used ELISA for hepcidin measurements, a method which is still to be standardized [Citation45], even if efforts have been recently made to implement a calibrator material for hepcidin assays [Citation46].
Conclusions
The association of iron deficiency with anemia of chronic conditions could be more prevalent than estimated in CKD-related anemia, and this high prevalence could be responsible for the higher ferritin and TSAT levels recommended for the diagnosis of iron deficiency in CKD patients. Ferritin and, to a lesser degree, TSAT are useful in the diagnosis of iron deficiency superimposed on anemia of chronic conditions, while hepcidin, although reflecting bone marrow macrophages iron, has a reduced utility in the condition of the study.
Disclosure statement
No potential conflict of interest was reported by the author(s). The results presented in this paper have not been published previously in whole or part.
Additional information
Funding
References
- Portolés J, Martín L, Broseta JJ, et al. Anemia in chronic kidney disease: from pathophysiology and current treatments, to future agents. Front Med. 2021;8:1. doi: 10.3389/fmed.2021.642296.
- Kalantar-Zadeh K, Hoffken B, Wunsch H, et al. Diagnosis of iron deficiency anemia in renal failure patients during the post-erythropoietin era. Am J Kidney Dis. 1995;26(2):292–9. doi: 10.1016/0272-6386(95)90649-5.
- Gotloib L, Silverberg D, Shostak A. Iron deficiency is a very common cause of anemia in chronic kidney insufficiency and can often be corrected with IV iron. J Nephrol. 2006;19:161–167.
- Rocha LA, Barreto DV, Barreto FC, et al. Serum ferritin level remains a reliable marker of bone marrow iron stores evaluated by histomorphometry in hemodialysis patients. Clin J Am Soc Nephrol. 2009;4:57–61.
- Stancu S, Stanciu A, Zugravu A, et al. Bone marrow iron, iron indices, and the response to intravenous iron in patients with non–Dialysis-Dependent CKD. Am J Kidney Dis. 2010;55(4):639–647. doi: 10.1053/j.ajkd.2009.10.043.
- Ali M, Fayemi AO, Rigolosi R, et al. Hemosiderosis in hemodialysis patients: an autopsy study of 50 cases. JAMA. 1980;244(4):343–345.
- Ali M, Fayemi AO, Frascino J, et al. Failure of serum ferritin levels to predict bone-marrow iron content after intravenous iron-dextran therapy. Lancet. 1982;1(8273):652–655. doi: 10.1016/s0140-6736(82)92204-8.
- Ganz T. Molecular control of iron transport. J Am Soc Nephrol. 2007;18(2):394–400. doi: 10.1681/ASN.2006070802.
- Ganz T, Nemeth E. Iron balance and the role of hepcidin in chronic kidney disease. Semin Nephrol. 2016;36(2):87–93. doi: 10.1016/j.semnephrol.2016.02.001.
- Weiss G, Goodnough LT. Anemia of chronic disease. N Engl J Med. 2005;352(10):1011–1023. doi: 10.1056/NEJMra041809.
- Goodnough LT, Nemeth E, Ganz T. Detection, evaluation, and management of iron-restricted erythropoiesis. Blood. 2010;116(23):4754–4761. doi: 10.1182/blood-2010-05-286260.
- Bain BJ, Clark DM, Wilkins BS. Bone marrow pathology. 4th ed. Singapore: WileyBlackwell; 2010. p. 100–165.
- Macdougall IC, White C, Anker SD, et al. Intravenous iron in patients undergoing maintenance hemodialysis. N Engl J Med. 2019;380(5):447–458. doi: 10.1056/NEJMoa1810742.
- Kidney Disease: improving Global Outcomes (KDIGO) Anemia Work Group. KDIGO clinical practice guideline for anemia in chronic kidney disease. Kidney Inter Suppl. 2012;2:279–335.
- Weiss G, Ganz T, Goodnough LT. Anemia of inflammation. Blood. 2019;133(1):40–50. doi: 10.1182/blood-2018-06-856500.
- Batchelor EK, Kapitsinou P, Pergola PE, et al. Iron deficiency in chronic kidney disease: updates on pathophysiology, diagnosis, and treatment. J Am Soc Nephrol. 2020;31(3):456–468. doi: 10.1681/ASN.2019020213.
- Nemeth E, Ganz T. Regulation of iron metabolism by hepcidin. Annu Rev Nutr. 2006;26:323–342. doi: 10.1146/annurev.nutr.26.061505.111303.
- Gutiérrez OM. Treatment of iron deficiency anemia in CKD and end-stage kidney disease. Kidney Int Rep. 2021;6(9):2261–2269. doi: 10.1016/j.ekir.2021.05.020.
- Swinkels DW, Wetzels JFM. Hepcidin: a new tool in the management of anaemia in patients with chronic kidney disease? Nephrol Dial Transplant. 2008;23(8):2450–2453. doi: 10.1093/ndt/gfn267.
- Ashby DR, Gale DP, Busbridge M, et al. Plasma hepcidin levels are elevated but responsive to erythropoietin therapy in renal disease. Kidney Int. 2009;75(9):976–981. doi: 10.1038/ki.2009.21.
- Weiss G, Theurl I, Eder S, et al. Serum hepcidin concentration in chronic haemodialysis patients: associations and effects of dialysis, iron and erythropoietin therapy. Eur J Clin Invest. 2009;39(10):883–890. doi: 10.1111/j.1365-2362.2009.02182.x.
- Ford BA, Eby CS, Scott MG, et al. Intra-individual variability in serum hepcidin precludes its use as a marker of iron status in hemodialysis patients. Kidney Int. 2010;78(8):769–773. doi: 10.1038/ki.2010.254.
- Levey AS, Greene T, Kusek JW, et al. A simplified equation to predict glomerular filtration rate from serum creatinine. J Am Soc Nephrol. 2000;11: a0828.
- Peritoneal Dialysis Study Group. Adequacy of dialysis and nutrition in continuous peritoneal dialysis: association with clinical outcomes. Canada-USA (CANUSA). J Am Soc Nephrol. 1996;7:198–207.
- Rath CE, Finch CA. Sternal marrow hemosiderin: a method for the determination of available iron stores in man. J Lab Clin Med. 1948;33:81–86.
- Hughes DA, Stuart-Smith SE, Bain BJ. How should stainable iron in bone marrow films be assessed? J Clin Pathol. 2004;57(10):1038–1040. doi: 10.1136/jcp.2003.015834.
- Patel K, Hathila RN, Patel PR. A study of iron store in bone marrow and its correlation in various anemia. JDPO. 2022;7(1):18–21. doi: 10.18231/j.jdpo.2022.004.
- Hansen H, Weinfeld A. Hemosiderin estimations and sideroblasts counts in the differential diagnosis of iron deficiency and other anemias. Acta Med Scand. 1959;165:333–356. doi: 10.1111/j.0954-6820.1959.tb14509.x.
- Porwit A, McCullough J, Wendy N, et al. Blood and bone marrow pathology. 2nd ed. Edinburgh: Churchill Livingstone/Elsevier; 2011. pp. 79–100.
- Brătescu LO, Bârsan L, Munteanu D, et al. Is hepcidin-25 a clinically relevant parameter for the iron status in hemodialysis patients? J Ren Nutr. 2010;20(5 Suppl):S77–S83. doi: 10.1053/j.jrn.2010.06.006.
- Wittbrodt ET, James G, Kumar S, et al. Contemporary outcomes of anemia in US patients with chronic kidney disease. Clin Kidney J. 2022;15(2):244–252. doi: 10.1093/ckj/sfab195.
- Babitt JL, Eisenga MF, Haase VH, et al. Controversies in optimal anemia management: conclusions from a kidney disease: improving global outcomes (KDIGO) conference. Kidney Int. 2021;99(6):1280–1295. doi: 10.1016/j.kint.2021.03.020.
- Karlsson T. Evaluation of a competitive hepcidin ELISA assay in the differential diagnosis of iron deficiency anaemia with concurrent inflammation and anaemia of inflammation in elderly patients. J Inflamm. 2017;14(1):21. doi: 10.1186/s12950-017-0166-3.
- Macdougall IC. Intravenous iron therapy in patients with chronic kidney disease: recent evidence and future directions. Clin Kidney J. 2017;10(Suppl 1):i16–i24. doi: 10.1093/ckj/sfx043.
- Hung SC, Tarng DC. Bone marrow iron in CKD: correlation with functional iron deficiency. Am J Kidney Dis. 2010;55(4):617–621. doi: 10.1053/j.ajkd.2009.12.027.
- Rapa SF, Di Iorio BR, Campiglia P, et al. Inflammation and oxidative stress in chronic kidney disease - Potential therapeutic role of minerals, vitamins and plant-derived metabolites. IJMS. 2019;21(1):263. doi: 10.3390/ijms21010263.
- Mircescu G, Garneata L, Capusa C, et al. Intravenous iron supplementation for the treatment of anaemia in pre-dialyzed chronic renal failure patients. Nephrol Dial Transplant. 2006;21(1):120–124. doi: 10.1093/ndt/gfi087.
- Canavese C, Bergamo D, Ciccone G, et al. Low-dose continuous iron therapy leads to a positive iron balance and decreased serum transferrin levels in chronic haemodialysis patients. Nephrol Dial Transplant. 2004;19(6):1564–1570. doi: 10.1093/ndt/gfh136.
- Ferrari P, Kulkarni H, Dheda S, et al. Serum iron markers are inadequate for guiding iron repletion in chronic kidney disease. Clin J Am Soc Nephrol. 2011;6(1):77–83. doi: 10.2215/CJN.04190510.
- Ganz T. Hepcidin and iron regulation, 10 years later. Blood. 2011;117(17):4425–4433. doi: 10.1182/blood-2011-01-258467.
- Nakanishi T, Kuragano T, Nanami M, et al. Importance of ferritin for optimizing anemia therapy in chronic kidney disease. Am J Nephrol. 2010;32(5):439–446. doi: 10.1159/000320733.
- Kalantar-Zadeh K, Kalantar-Zadeh K, Lee GH. The fascinating but deceptive ferritin: to measure it or not to measure in chronic kindey disease? Clin Am J Soc Nephrol. 2006;1(Suppl 1):S9–S18. doi: 10.2215/CJN.01390406.
- Zaritsky J, Young B, Gales B, et al. Reduction of serum hepcidin by haemodialysis in pediatric and adult patients. Clin J Am Soc Nephrol. 2010;5(6):1010–1014. doi: 10.2215/CJN.08161109.
- Svenson N, Bailey J, Durairaj S, et al. A simplified diagnostic pathway for the differential diagnosis of iron deficiency anaemia and anaemia of chronic disease. Int J Lab Hematol. 2021;43(6):1644–1652. doi: 10.1111/ijlh.13666.
- Galesloot TE, Vermeulen SH, Geurts-Moespot AJ, et al. Serum hepcidin: reference ranges and biochemical correlates in the general population. Blood. 2011;117(25):e218–e225. doi: 10.1182/blood-2011-02-337907.
- Diepeveen LE, Laarakkers CMM, Martos G, et al. Provisional standardization of hepcidin assays: creating a traceability chain with a primary reference material, candidate reference method and a commutable secondary reference material. Clin Chem Lab Med. 2019;57(6):864–872. doi: 10.1515/cclm-2018-0783.