
Abstract
Background
Established prognostic models of idiopathic membranous nephropathy (IMN) were limited to traditional modeling methods and did not comprehensively consider clinical and pathological patient data. Based on the electronic medical record (EMR) system, machine learning (ML) was used to construct a risk prediction model for the prognosis of IMN.
Methods
Data from 418 patients with IMN were diagnosed by renal biopsy at the Fifth Clinical Medical College of Shanxi Medical University. Fifty-nine medical features of the patients could be obtained from EMR, and prediction models were established based on five ML algorithms. The area under the curve, recall rate, accuracy, and F1 were used to evaluate and compare the performances of the models. Shapley additive explanation (SHAP) was used to explain the results of the best-performing model.
Results
One hundred and seventeen patients (28.0%) with IMN experienced adverse events, 28 of them had compound outcomes (ESRD or double serum creatinine (SCr)), and 89 had relapsed. The gradient boosting machine (LightGBM) model had the best performance, with the highest AUC (0.892 ± 0.052, 95% CI 0.840–0.945), accuracy (0.909 ± 0.016), recall (0.741 ± 0.092), precision (0.906 ± 0.027), and F1 (0.905 ± 0.020). Recursive feature elimination with random forest and SHAP plots based on LightGBM showed that anti-phospholipase A2 receptor (anti-PLA2R), immunohistochemical immunoglobulin G4 (IHC IgG4), D-dimer (D-DIMER), triglyceride (TG), serum albumin (ALB), aspartate transaminase (AST), β2-microglobulin (BMG), SCr, and fasting plasma glucose (FPG) were important risk factors for the prognosis of IMN. Increased risk of adverse events in IMN patients was correlated with high anti-PLA2R and low IHC IgG4.
Conclusions
This study established a risk prediction model for the prognosis of IMN using ML based on clinical and pathological patient data. The LightGBM model may become a tool for personalized management of IMN patients.
Introduction
Idiopathic membranous nephropathy (IMN) is one of the main causes of renal failure [Citation1]. In China, membranous nephropathy is the second most common chronic kidney disease (CKD), and about 80% of membranous nephropathy is IMN [Citation2]. Its clinical course is characterized by spontaneous remission and recurrence. About 20–40% of patients have varying degrees of spontaneous remission, but 15–30% of patients have a relapse, and 30% of them progress to end-stage renal disease (ESRD) [Citation3]. Predicting the progression of IMN early and accurately has become a major concern of clinicians.
Most IMN patients are male [Citation4], the average age is between 45 and 60 years, and incidence gradually increases with advancing age [Citation5]. The prognosis of the disease is related to many factors. Patients with IMN have a high degree of heterogeneity in clinical features, histological damage, treatment response, and disease outcomes. Nevertheless, established IMN prognostic models were limited to traditional modeling methods and did not comprehensively consider clinical and pathological patient data [Citation6–8]. At present, machine learning (ML) has shown good predictive ability in the prognosis of renal diseases such as diabetic nephropathy and acute renal injury [Citation9,Citation10]. ML is completely data-driven, which can fit the complex nonlinear relationship between variables. When dealing with multi-dimensional features and large sample data, it may achieve more accurate predictions than traditional modeling methods [Citation11]. Therefore, it is extremely necessary to construct an ML model of IMN prognosis using the multidimensional characteristics of the disease.
The purpose of this study was to collect long-term follow-up clinical and pathological data of IMN patients from the electronic medical record (EMR) system, to use these data with ML to determine the risk factors for the prognosis of IMN, and to construct a prognostic prediction model for IMN patients. This model may facilitate an early understanding of the risks of IMN and early intervention to assist decision-making.
Materials and methods
Study cohorts
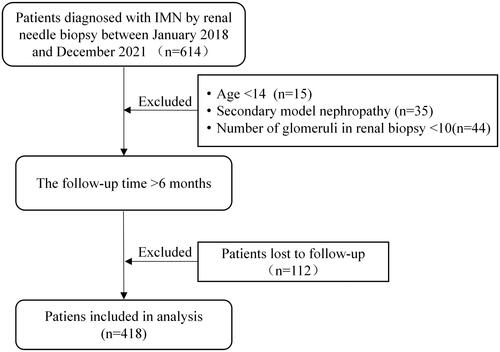
This study included patients diagnosed with IMN by renal biopsy at the Fifth Clinical Medical College of Shanxi Medical University from January 2018 to December 2021, with more than 6 months of follow-up time. Patients with incomplete data, secondary membranous nephropathy, fewer than 10 glomeruli in renal biopsy, and patients lost to follow-up were excluded from this study. The patient selection flow diagram is shown in . This study followed the tenets of the Declaration of Helsinki and was approved by the Ethics Review Committee of Shanxi Provincial People’s Hospital ([2022] Provincial Medical Opinions No. 350), Shanxi, China. Written informed consent was obtained from all study participants.
Figure 1. Flow diagram of patient selection. IMN: idiopathic membranous nephropathy.
Definitions and primary outcomes
Complete remission was defined as proteinuria <0.3 g/day. Partial response was defined as a >50% reduction from baseline in proteinuria between 0.3 g/day and 3.5 g/day. Patients who did not meet the above criteria were defined as having no response. Relapse was defined as a relapse of nephrotic syndrome in patients with partial or complete remission [Citation12].
Adverse events involved relapse, ESRD (estimated glomerular filtration rate (eGFR) <15 mL/(min × 1.73 m2) or dialysis or kidney transplantation), doubling of serum creatinine (SCr), or death. The endpoints were the occurrence of adverse events or the observation time up to December 2021.
Data processing
The baseline time of the data was defined as the time of renal puncture biopsy. The clinical and pathological baseline characteristics were obtained from EMR.
Features with more than 40% of data missing from patient records were removed, and the missing values of the remaining features were inferred by the multiple imputation method. According to prior medical knowledge, the outliers of the data were corrected, for example, the diastolic blood pressure should be lower than the systolic blood pressure. In addition, the categorical variables were encoded. Finally, 59 features were used for statistical and ML analysis, as shown in Supplementary Table 1.
Statistical analysis
Statistical analysis was performed using Python 3.7. Continuous variables that followed a normal distribution were expressed by mean ± standard deviation, and the independent sample t-test was used to compare the two groups. Continuous variables that did not follow a normal distribution were expressed by the median (interquartile range, IQR), and the Wilcoxon rank sum test was used to compare the two groups. Categorical variables were expressed by the number of cases (percentage), and the Chi-squared test was used to compare the two groups. The test in the study was two-tailed, and features with p value less than 0.05 were considered significant.
Machine learning analysis
Analyses were conducted using Python version 3.7. To identify the ML algorithm that was best suited for the problem, five of the most popular and up-to-date ML algorithms were tried: logistic regression (LR) [Citation13], support vector machine (SVM) [Citation14], random forest (RF) [Citation15], eXtreme gradient boosting (XGBoost) [Citation16], and light gradient boosting machine (LightGBM) [Citation17]. LR is a simple and more efficient method for binary and linear classification problems. It can find a function that predicts the outcome for a binary dependent variable from one or more independent variables. SVM uses kernel functions to project a nonlinearly separable sample from one low-dimensional space to another high-dimensional space for classification. RF, XGBoost, and LightGBM are all ensemble models based on the decision tree. RF has been proven to be a very effective and powerful classifier that combines multiple decision trees through majority voting. XGBoost provides a parallel tree boosting that solves many data science problems in a fast and accurate way. In the end, LightGBM can be used in classification, regression, and many more ML tasks. It is designed to be distributed and efficient with the following advantages: faster training speed and higher efficiency, support of parallel learning, and capable of handling large-scale data.
To improve the generalization ability of the models, the recursive feature elimination (RFE) based on RF with k-fold (k = 5) cross validation [Citation18] was used for feature selection. The main idea of RFE is to build a model, select the best feature, pick out the selected feature, and then repeat this process for the remaining features until all the features are traversed.
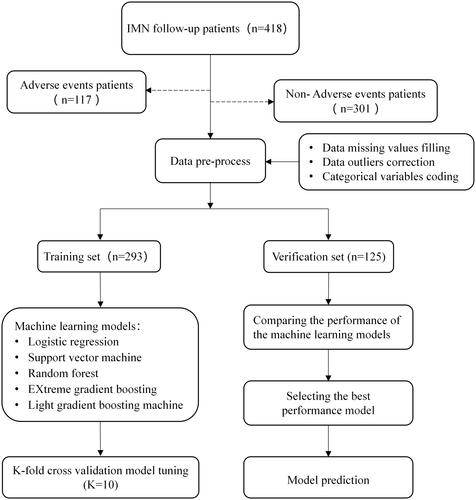
A binary outcome for the prediction model was defined according to whether the patient experienced adverse events. The data were randomly divided into 70% for training and 30% for verification. In the training set, k-fold cross validation (k = 10) was used to find the optimal model parameters through grid search and was finally executed on the test set. The forecast flow diagram is shown in . To evaluate the performance of the ML models, the following measures were calculated and compared: area under the curve (AUC), recall, accuracy, F1, and precision. To ensure the fairness of the comparison, the average results of k-fold data resampling (k = 5) were used. Furthermore, Shapley additive explanation (SHAP) were used to interpret the model globally and locally [Citation19]. Specifically, SHAP calculates the contribution of each variable to the prediction to explain the results of the predictive model. This study used SHAP values to provide consistent and locally accurate attribution values for each feature within the best-performing prediction model [Citation20,Citation21].
Figure 2. The model prediction workflow. IMN, idiopathic membranous nephropathy; Adverse events: relapse, ESRD (estimated glomerular filtration rate <15 mL/(min×1.73 m2) or dialysis or kidney transplantation), or doubling of serum creatinine.
Results
Statistical description
A total of 418 patients with IMN were included in this study. The clinical and pathological baseline characteristics of the patients are shown in . One hundred and seventeen patients (28.0%) with IMN experienced adverse events, 28 of them had compound outcomes (ESRD or double SCr), and 89 had relapsed. The average age of patients was 49.4 ± 11.5 years (38–61 years), and 295 patients (70.6%) were male. The median and quartile of follow-up time were 14.5 [8.0,22.0] months. The incidence of hypertension was 52.6%, the incidence of diabetes was 12.2%, and the incidence of thyroid disease was 14.6%. Baseline data showed that patients who experienced adverse events had significantly higher anti-phospholipase A2 receptor (anti-PLA2R), D-dimer (D-DIMER), β2-microglobulin (BMG), and triglyceride (TG) and significantly lower serum albumin (ALB) compared with patients who did not experience adverse events.
Table 1. Baseline clinical and pathological characteristics of the included patients.
Model construction and comparison
As shown in , after the RFE with RF feature selection, the optimal number of features was 9. These features were anti-PLA2R, immunohistochemical immunoglobulin G4 (IHC IgG4), D-DIMER, TG, ALB, aspartate transaminase (AST), BMG, SCr, and fasting plasma glucose (FPG). The nine features were used as input to the ML model to predict the prognosis of patients with IMN. The results of the performance evaluation of the five ML models are shown in . To more intuitively show the model’s ability to distinguish between positive and negative samples, the ROC curve and the precision–recall (PR) curve were drawn, as shown in . The performance differences between the models were significant, and the LightGBM model had the best performance, with the highest AUC (0.892 ± 0.052, 95% CI 0.840–0.945), accuracy (0.909 ± 0.016), recall (0.741 ± 0.092), precision (0.906 ± 0.027), and F1 (0.905 ± 0.020).
Figure 3. Feature selection results based on the recursive feature elimination.
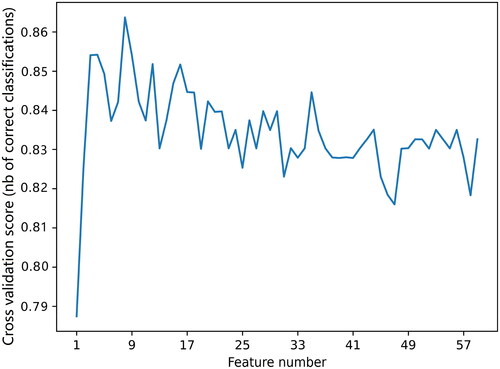
Figure 4. Evaluation of the predictive models. (a) The average ROC curves from five models in the validation set. Mean AUC values with standard deviations of different prediction models were shown in the box. (b) The average precision–recall (PR) curves, indicating the tradeoff between precision and recall. Mean AP values with standard deviations of different prediction models were shown in the box. AUC: area under the curve; ROC: receiver operating characteristic; AP: average precision; LightGBM: light gradient boosting machine; RF: random forest; XGBoost: eXtreme gradient boosting; SVM: support vector machine; LR: logistic regression.
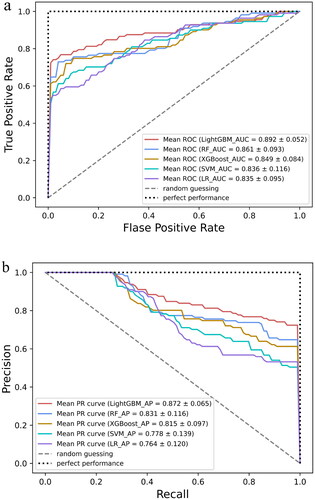
Table 2. Performance of the prediction models generated by the five machine learning models.
Model interpretation
SHAP interprets the LightGBM model results by calculating each variable’s contribution to the predicted results. Visual interpretation of the LightGBM model was carried out using the SHAP feature importance plot, the SHAP summary plot, the SHAP dependence plot, and the SHAP force plot.
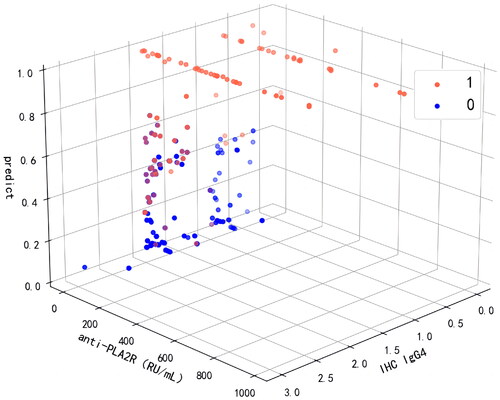
shows the feature importance in the LightGBM model. The features in order of their characteristic importance in predicting IMN progress from high to low are anti-PLA2R, IHC IgG4, D-DIMER, TG, ALB, AST, SCr, BMG, and FPG. The SHAP summary plot () shows the impact of a single characteristic variable on the progress of IMN. Characteristics with higher SHAP values increased the risk of a patient’s experiencing adverse events. Each point on the SHAP dependence plot represents a patient and describes how the importance of the feature changes with its value. Furthermore, the two most important features were selected to draw a SHAP dependence plot (); these two features could already distinguish most positive and negative samples (). SHAP values greater than zero indicated an increased risk of patients experiencing adverse events. In general, the higher the value of anti-PLA2R () and the lower the value of IHC IgG4 (), the higher the risk of an IMN patient’s experiencing adverse events.
Figure 5. (a) Importance matrix plot of the LightGBM model. (b) SHAP summary plot of the nine clinical and pathological features of the LightGBM model. There is one dot per patient per feature colored according to an attribution value, where red represents a higher value and blue represents a lower value. anti-PLA2R: anti-phospholipase A2 receptor; IHC IgG4: immunohistochemical immunoglobulin G4; D-DIMER: D-dimer; TG: triglyceride; ALB: significantly lower serum albumin; AST: aspartate transaminase; BMG: β2-microglobulin; SCr: serum creatinine; FPG: fasting plasma glucose.
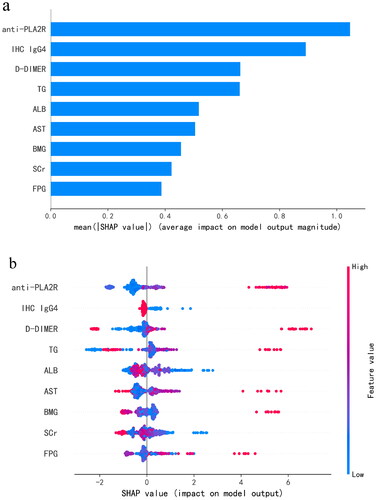
Figure 6. SHAP dependence plot of the LightGBM model, depicting how a single variable affects the prediction. SHAP value for specific features that exceed zero indicates an increased risk of patients experiencing adverse events. (a) SHAP dependence plot of anti-PLA2R. (b) SHAP dependence plot of IHC IgG4. The value 0 of IHC IgG4 represents (–), 0.5 represents (±), 1 represents (+), 2 represents (++), and 3 represents (+++). anti-PLA2R: anti-phospholipase A2 receptor; IHC IgG4: immunohistochemical immunoglobulin G4.
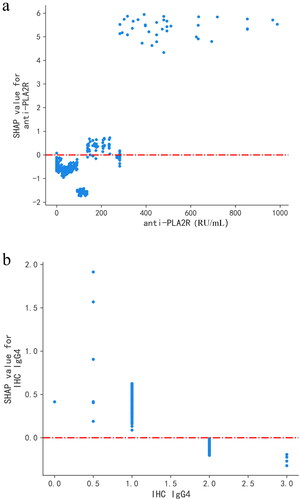
Figure 7. Predictive effect of LightGBM model using anti-PLA2R and IHC IgG4. 0: non-adverse events; 1: adverse events. The value 0 of IHC IgG4 represents (–), 0.5 represents (±), 1 represents (+), 2 represents (++), and 3 represents (+++). anti-PLA2R: anti-phospholipase A2 receptor; IHC IgG4: immunohistochemical immunoglobulin G4.
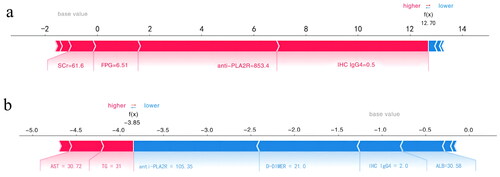
The SHAP force plot tried to explain how each feature affects the model’s one-shot decision. shows that a patient with an anti-PLA2R value of 853.4 RU/mL and an IHC IgG4 value of ± had a 99% risk of experiencing adverse events. represents a low-risk patient with a 2% probability of experiencing adverse events and having an anti-PLA2R value of 105.35 RU/mL and an IHC IgG4 value of ++.
Figure 8. SHAP force plot of LightGBM model, explaining combined event risk for two example individuals. (a) A high-risk patient experiencing adverse events. (b) A low-risk patient experiencing adverse events. Variables in the red arrow mean the impact values are positive while blue means negative. The length of the arrow bar represents the absolute value of the impact. The value 0.5 of IHC IgG4 represents (±), 2 represents (++). anti-PLA2R: anti-phospholipase A2 receptor; IHC IgG4: immunohistochemical immunoglobulin G4; D-DIMER: D-dimer; TG: triglyceride; ALB: significantly lower serum albumin; AST: aspartate transaminase; SCr: serum creatinine; FPG: fasting plasma glucose.
Discussion
In this study, five ML algorithms were developed and validated using nine clinical and pathological characteristics to predict the prognosis of IMN. The results showed that the prediction and robust performance of the LightGBM model was the best. In addition, SHAP was used to visually interpret the LightGBM model, which is the first published application of an interpretable LightGBM model to predict the prognosis of IMN. This model may be used as a convenient tool for clinical decision-making and individual management of IMN.
The combination of EMR and ML promotes the development of complex medical prediction models. Multiple studies have confirmed that ML was highly applicable to medical decision-making and prognosis evaluation because it was helpful for researchers to identify new risk factors and study the pathogenesis of the disease. Personalized evaluation will also increase the accuracy of IMN diagnosis and prognosis, as well as optimize the treatment plan. In this study, SHAP was used to explain the proposed prediction model and to understand the decision-making process of the LightGBM model [Citation19]. This study results indicate that anti-PLA2R, SCr, ALB, TG, BMG, IHC-IgG4, D-DIMER, AST, and FPG were risk factors affecting the prognosis of the IMN.
Anti-PLA2R and SCr have been used as independent predictors of IMN prognosis [22,Citation23]. Current research shows that anti-PLA2R is associated with 50–80% of IMN cases [Citation24,Citation25], but the specific mechanism that affects the progress of IMN is still not fully understood. In a cohort study in China, it was found that anti-PLA2R is an important serological marker for IMN diagnosis and a potential predictor related to the severity of IMN disease [Citation26]. It has a great influence on the output of the predictive model. Consistent with this, in 572 patients with IMN confirmed by biopsy, the level of proteinuria in serum anti-PLA2R positive patients (68.5%) was higher than in anti-PLA2R negative patients [Citation27]. More studies have shown that anti-PLA2R is closely related to the diagnosis and prognosis of IMN. Therefore, dynamic monitoring of anti-PLA2R is crucial for the treatment and prognosis of IMN patients. In the present study, the SHAP dependence plots showed that IMN patients with high anti-PLA2R had an increased risk of experiencing adverse events.
This study found that ALB, TG, BMG, IHC IgG4, D-DIMER, AST, and FPG were also influential features affecting the prognosis of IMN. A retrospective cohort study of patients with IMN showed that ALB was an independent risk factor for ESRD in patients with IMN [Citation28] and that TG and BMG were associated with the risk of deterioration of renal function in IMN [Citation29,Citation30]. In addition, there is evidence that IHC IgG4 and D-DIMER are associated with the long-term outcome of IMN [Citation31,Citation32].
In this study, the model developed was the first to incorporate pathological indicators of IHC IgG4. It is well known that this factor is closely related to the pathogenesis of IMN, but the impact of IHC IgG4 on the diagnostic value and prognosis of IMN has not been fully determined. In the present study, IHC IgG4 was an important predictor associated with IMN prognosis, second only to anti-PLA2R in influence. In recent years, a growing number of studies have been conducted on the effect of IgG4 in renal pathological tissues on IMN. A study involving surveillance of 15 renal transplant cases found that 10 patients (67%) were positive for anti-IgG4 at the time of transplantation and during follow-up, and when the follow-up period was longer than 6 months, anti-IgG4 positivity became a significant risk factor for IMN recurrence [Citation33]. Consequently, anti-IgG4 is vital for predicting the prognosis of IMN. Moreover, the complement system plays an important role in the pathogenesis of IMN. Studies have suggested that the deposition amount of IMN immune sediment IgG4 was negatively correlated with complement C1q [Citation34], but the relationship between its deposition intensity and IMN diseases still needed to be confirmed by a study with a large clinical dataset. In the present study, SHAP dependence plots showed an increased risk of adverse events in IMN patients with less IHC IgG4 deposition.
D-DIMER has traditionally not been associated with the prognosis of IMN. Previous studies have shown that D-DIMER could be used as a reliable predictor and potential biomarker to predict the severity and adverse outcome events of respiratory, cardiovascular, tumor, and immune-related diseases [Citation35–39]. However, recent studies have shown that D-DIMER was associated with the long-term prognosis of kidney diseases [Citation40]. This study proposes for the first time that D-DIMER can be used as a predictor of the prognosis of IMN.
Some studies have found that dyslipidemia may lead to changes in the AST level of IMN [Citation41], and CKD will lead to a decrease in islet receptor activity in patients, resulting in glucose metabolism damage, which may be the reason why AST and FPG become influential characteristics. FPG may be a new risk factor for the prognosis of IMN. FPG reflects islet β-cell function and generally indicates the basic insulin secretion function. Patients with CKD showed varying degrees of impaired glucose tolerance [Citation42]. In a cohort study of 1313 IMN patients, Cox regression showed that urinary glucose and baseline SCr were risk factors for a 50% reduction in eGFR [Citation43]. The reason may be that with the progression of kidney disease, patients developed insulin resistance [Citation44].
This study outlined several advantages. First, real-world data were collected, including clinical and pathological data from EMR, which may be more representative of the disease status of different IMN patients. Second, the LightGBM model performed best when compared with the other models. LightGBM is a highly optimized gradient-enhanced decision tree algorithm that can effectively deal with the complex relationships between multi-dimensional variables. Third, new risk factors associated with the prognosis of IMN were identified. Fourth, the model may be used by clinicians as a tool for individualized management of the prognosis of IMN patients and early intervention regarding its risk factors.
This study had some limitations. This study was a single-center study with a small sample size and a lack of external verification, meaning that it would be difficult to popularize and apply the model at a large scale. In addition, due to limited medical conditions, the results of renal electron microscopy could not be included in this study. In the future, we will continue to collect more categories and a larger amount of patient data to improve the clinical applicability of the model.
Conclusions
In conclusion, nine clinical and pathological variables were identified as influential factors, and a risk prediction model for the prognosis of IMN using ML was constructed. The LightGBM model developed in this study may become a tool for the personalized management of IMN patients.
Ethical approval
This study followed the tenets of the Declaration of Helsinki and was approved by the Ethics Review Committee of Shanxi Provincial People’s Hospital ([2022] Provincial Medical Opinions No. 350), Shanxi, China.
Consent form
Written informed consent was obtained from all study participants.
Supplemental Material
Download PDF (193.6 KB)Disclosure statement
The authors declare that they have no competing interests.
Data availability statement
The data supporting the findings of this study cannot be disclosed due to the need to protect patients’ privacy, but are available from the corresponding author, Dr. Zhou [[email protected]].
Correction Statement
This article has been corrected with minor changes. These changes do not impact the academic content of the article.
Additional information
Funding
References
- Gañán IN, Iturrieta-Zuazo I, Rita CG, et al. Revisiting immunological and clinical aspects of membranous nephropathy. Clin Immunol. 2022;237:1. doi: 10.1016/j.clim.2022.108976.
- Xu X, Wang G, Chen N, et al. Long-term exposure to air pollution and increased risk of membranous nephropathy in China. J Am Soc Nephrol. 2016;27(12):3739–11. doi: 10.1681/ASN.2016010093.
- Keri KC, Blumenthal S, Kulkarni V, et al. Primary membranous nephropathy: comprehensive review and historical perspective. Postgrad Med J. 2019;95(1119):23–31. doi: 10.1136/postgradmedj-2018-135729.
- Francis JM, Beck LH, Salant DJ. Membranous nephropathy: a journey from bench to bedside. Am J Kidney Dis. 2016;68(1):138–147. doi: 10.1053/j.ajkd.2016.01.030.
- McGrogan A, Franssen CFM, De Vries CS. The incidence of primary glomerulonephritis worldwide: a systematic review of the literature. Nephrol Dial Transplant. 2011;26(2):414–430. doi: 10.1093/ndt/gfq665.
- Xiaofan H, Jing X, Chenni G, et al. New risk score for predicting progression of membranous nephropathy. J Transl Med. 2019;17(1):41. doi: 10.1186/s12967-019-1792-8.
- Cheng W, Sun L, Dong H, et al. Clinicopathologic characteristic and prognosis in idiopathic membranous nephropathy patients with focal segmental sclerosis lesion: a retrospective observational study. Medicine. 2021;100(3):e23988. doi: 10.1097/MD.0000000000023988.
- Choi J-Y, Chin HJ, Lee H, et al. Idiopathic membranous nephropathy in older patients: clinical features and outcomes. PLOS One. 2020;15(10):e0240566. doi: 10.1371/journal.pone.0240566.
- Chan L, Nadkarni GN, Fleming F, et al. Derivation and validation of a machine learning risk score using biomarker and electronic patient data to predict progression of diabetic kidney disease. Diabetologia. 2021;64(7):1504–1515. doi: 10.1007/s00125-021-05444-0.
- Hu C, Tan Q, Zhang Q, et al. Application of interpretable machine learning for early prediction of prognosis in acute kidney injury. Comput Struct Biotechnol J. 2022;20:2861–2870. doi: 10.1016/j.csbj.2022.06.003.
- Wu X, Sun Y, Xu X, et al. Mortality prediction in severe traumatic brain injury using traditional and machine learning algorithms. J Neurotrauma. 2023;40(13–14):1366–1375. doi: 10.1089/neu.2022.0221.
- Couser WG. Primary membranous nephropathy. Clin J Am Soc Nephrol. 2017;12(6):983–997. doi: 10.2215/CJN.11761116.
- Fitzmaurice G, Laird N. Multivariate analysis: discrete variables (logistic regression). IESBS. 2001:10221–10228. doi: 10.1016/b0-08-043076-7/00476-9.
- Cortes C, Vapnik V. Support-vector networks. Mach Learn. 1995;20(3):273–297. doi: 10.1007/BF00994018.
- Breiman L. Random forests. Mach Learn. 2001;45(1):5–32. doi: 10.1023/A:1010933404324.
- Chen T, Guestrin C. XGBoost: a scalable tree boosting system. In: Proceedings of the 22nd ACM SIGKDD International Conference on Knowledge Discovery and Data Mining; 2016 Aug; New York, NY, USA. doi: 10.1145/2939672.2939785.
- Ke G, Meng Q, Finley T, et al. LightGBM: a highly efficient gradient boosting decision tree. 31st Conference on Neural Information Processing Systems (NIPS 2017), Long Beach, CA, USA.
- Genuer R, Poggi JM, Tuleau-Malot C. Variable selection using random forests. Pattern Recognit Lett. 2010;31(14):2225–2236. doi: 10.1016/j.patrec.2010.03.014.
- Lundberg S, Erion G, Lee S-I. Consistent individualized feature attribution for tree ensembles. arXiv. 1802.03888; 2018.
- Tseng PY, Chen YT, Wang CH, et al. Prediction of the development of acute kidney injury following cardiac surgery by machine learning. Crit Care. 2020;24(1):478. doi: 10.1186/s13054-020-03179-9.
- Lundberg SM, Lee S-I. A unified approach to interpreting model predictions. Adv Neural Inf Process Syst. 2017;30:346.
- van De Logt AE, Justino J, Vink CH, et al. Anti-PLA2R1 antibodies as prognostic biomarker in membranous nephropathy. Kidney Int Rep. 2021;6(6):1677–1686. doi: 10.1016/j.ekir.2021.04.002.
- Ghiggeri GM, Seitz-Polski B, Justino J, et al. Multi-autoantibody signature and clinical outcome in membranous nephropathy. Clin J Am Soc Nephrol. 2020;15(12):1762–1776. doi: 10.2215/CJN.02500220.
- Du Y, Li J, He F, et al. The diagnosis accuracy of PLA2R-AB in the diagnosis of idiopathic membranous nephropathy: a meta-analysis. PLOS One. 2014;9(8):e104936. doi: 10.1371/journal.pone.0104936.
- Akiyama S, Akiyama M, Imai E, et al. Prevalence of anti-phospholipase A2 receptor antibodies in Japanese patients with membranous nephropathy. Clin Exp Nephrol. 2015;19(4):653–660. doi: 10.1007/s10157-014-1054-2.
- Li X, Wei D, Zhou Z, et al. Anti-PLA2R antibodies in Chinese patients with membranous nephropathy. Med Sci Monit. 2016;22:1630–1636. doi: 10.12659/MSM.896090.
- Qin HZ, Zhang MC, Le WB, et al. Combined assessment of phospholipase A2 receptor autoantibodies and glomerular deposits in membranous nephropathy. J Am Soc Nephrol. 2016;27(10):3195–3203. doi: 10.1681/ASN.2015080953.
- Zhang B, Cheng M, Yang M, et al. Analysis of the prognostic risk factors of idiopathic membranous nephropathy using a new surrogate end-point. Biomed Rep. 2016;4(2):147–152. doi: 10.3892/br.2015.555.
- Liu B, Zhao L, Yang Q, et al. Hyperuricemia and hypertriglyceridemia indicate tubular atrophy/interstitial fibrosis in patients with IgA nephropathy and membranous nephropathy. Int Urol Nephrol. 2021;53(11):2321–2332. doi: 10.1007/s11255-021-02844-4.
- Reichert LJ, Koene RA, Wetzels JF. Prognostic factors in idiopathic membranous nephropathy. Am J Kidney Dis. 1998;31(1):1–11. doi: 10.1053/ajkd.1998.v31.pm9428445.
- Zhu H, Qi J, Schoepf J, et al. Prevalence and associated risk factors of pulmonary embolism in children and young adults with nephrotic syndrome: a Chinese large cohort study. J Thorac Imaging. 2021;36(5):326–332. doi: 10.1097/RTI.0000000000000603.
- Liu X, Xue J, Guo X, et al. A PLA2R-IgG4 antibody-based predictive model for assessing risk stratification of idiopathic membranous nephropathy. J Healthcare Eng. 2021;2021:1–6. doi: 10.1155/2021/1521013.
- Seitz-Polski B, Payré C, Ambrosetti D, et al. Prediction of membranous nephropathy recurrence after transplantation by monitoring of anti-PLA2R1 (M-type phospholipase A2 receptor) autoantibodies: a case series of 15 patients. Nephrol Dial Transplant. 2014;29(12):2334–2342. doi: 10.1093/ndt/gfu252.
- Huang CC, Lehman A, Albawardi A, et al. IgG subclass staining in renal biopsies with membranous glomerulonephritis indicates subclass switch during disease progression. Mod Pathol. 2013;26(6):799–805. doi: 10.1038/modpathol.2012.237.
- Zhang L, Yan X, Fan Q, et al. D‐dimer levels on admission to predict in‐hospital mortality in patients with covid‐19. J Thromb Haemost. 2020;18(6):1324–1329. doi: 10.1111/jth.14859.
- Nazerian P, Mueller C, Soeiro AM, et al. Diagnostic accuracy of the aortic dissection detection risk score plus D-dimer for acute aortic syndromes: the ADvISED prospective multicenter study. Circulation. 2018;137(3):250–258. doi: 10.1161/CIRCULATIONAHA.117.029457.
- Kim EY, Song KY. Prognostic value of D-dimer levels in patients with gastric cancer undergoing gastrectomy. Surg Oncol. 2021;37:101570. doi: 10.1016/j.suronc.2021.101570.
- Fok JS, Kolkhir P, Church MK, et al. Predictors of treatment response in chronic spontaneous urticaria. Allergy. 2021;76(10):2965–2981. doi: 10.1111/all.14757.
- Pyo JY, Yoo B, Kwon M, et al. D-dimer predicts poor hospitalisation outcomes in patients with antineutrophil cytoplasmic autoantibody-associated vasculitis. Clin Exp Rheumatol. 2021;39(2):94–100. doi: 10.55563/clinexprheumatol/4nlfpe.
- Johnson ED, Schell JC, Rodgers GM. The D‐dimer assay. Am J Hematol. 2019;94(7):833–839. doi: 10.1002/ajh.25482.
- RiYang L, HangYing Y, JunYan Q, et al. Association between tongue coating thickness and clinical characteristics among idiopathic membranous nephropathy patients. J Ethnopharmacol. 2015;171:125–130. doi: 10.1016/j.jep.2015.05.008.
- Kaneshige H, Endoh M, Tomino Y, et al. Abnormal glucose tolerance in patients with chronic glomerulonephritis without renal failure. Diabetes Care. 1983;6(4):381–386. doi: 10.2337/diacare.6.4.381.
- Liu L, Zuo K, Le W, et al. Non-diabetic urine glucose in idiopathic membranous nephropathy. Ren Fail. 2022;44(1):1105–1112. doi: 10.1080/0886022X.2022.2094806.
- Jin J, Jin B, Huang S, et al. Insulin resistance in children with primary nephrotic syndrome and normal renal function. Pediatr Nephrol. 2012;27(10):1901–1909. doi: 10.1007/s00467-012-2190-0.