
Abstract
Background
Nutrition and immunity play an important role in many chronic diseases. The prognostic nutritional index (PNI) has been proposed as a comprehensive indicator of an individual’s immune and nutritional status. However, there is a lack of evidence regarding the association between the PNI and mortality in patients with chronic kidney disease (CKD).
Methods
We used National Health and Nutrition Examination Survey (NHANES) data from 2001–2014 for participants with CKD. Mortality data were obtained from the National Death Index and matched to NHANES participants. Cox proportional hazards models were used to estimate hazard ratios for all-cause mortality.
Results: The patients were 72.5 ± 9.8 years old, and 47.57% were male. The median follow-up was 58 months, and the mortality rate in patients with CKD was 30.27%. A higher PNI protected against all-cause mortality in patients with CKD, with an adjusted hazard ratio (aHR) of 0.98 (95% confidence interval (CI): 0.97–0.99). After grouping according to PNI quartiles, statistically significant between-group differences were observed in survival probabilities. The aHR for the lowest PNI quartile compared to the highest PNI quartile was 1.64 (95% CI: 1.26–2.14). Sensitivity analysis further supported this association. Restricted cubic spline analysis revealed an L-shaped association between the PNI and all-cause mortality in patients with CKD, with a critical value of 50.5.
Conclusions
The PNI is a protective factor in patients with CKD, with an L-shaped decrease in all-cause mortality with an increasing PNI.
1. Introduction
Kidney disease is a major global public health problem, affecting an estimated 750 million people worldwide [Citation1]. The incidence of renal failure is increasing annually and has become a significant burden on global healthcare systems [Citation2]. Treatment options for patients with renal failure remain limited [Citation3–4], and mortality from chronic kidney disease (CKD) is increasing [Citation5]. Therefore, identifying and improving factors associated with the risk of death from renal failure is of paramount importance to improve patient survival.
Albumin, the predominant protein and major nutrient in human plasma, has been associated with increased mortality in patients with renal failure [Citation6–7]. Lymphocytes, which are produced by the lymphoid organs and play a crucial role in the immune response, have been associated with the risk of death in patients with severe AECOPD [Citation8] and COVID-19 [Citation9]. However, relying on a single indicator to assess the overall immune and nutritional status of a patient has limitations [Citation10]. In contrast, the prognostic nutritional index (PNI), calculated from serum albumin and peripheral blood lymphocyte count, provides a comprehensive assessment of the immune and nutritional status of the organism. Initially, the PNI was used to assess preoperative nutritional status, surgical risk and postoperative complications in surgical patients [Citation11]. However, a lower PNI was also reported to be associated with an increased risk of death in several conditions, including severe stroke [Citation12], diabetic foot ulcers [Citation13], Crimean-Congo hemorrhagic fever [Citation14], heart failure [Citation15] and CKD in elderly patients [Citation16]. However, there is currently no evidence that the PNI is associated with all-cause mortality in patients with CKD.
In this retrospective cohort study, we investigated the association between the PNI and all-cause mortality in patients with CKD and examined the nonlinear relationship between the two.
2. Materials and methods
2.1. Participants
Participants for this study were selected from the 2001–2014 National Health and Nutrition Examination Survey (NHANES), a continuous, multistage, probability-sampling, cross-sectional survey designed to assess the health and well-being of the civilian, noninstitutionalized population in the United States [Citation17]. Mortality data were collected from the Centers for Disease Control and Prevention National Death Index (NDI) database, with mortality information available from the date of enrollment to 31 December 2015. All data used in this study are publicly available on the CDC website (https://www.cdc.gov/nchs) (accessed 9 March 2022). The NHANES was approved by the Institutional Review Board of the National Center for Health Statistics, and written informed consent was obtained from all participants.
A total of 3360 patients with CKD, diagnosed by serum creatinine >150 μmol/L or estimated creatinine clearance (eGFR) <60 mL/min/1.73 m2 [Citation18], were included in this study. The exclusion criteria were as follows: (1) participants without albumin and/or lymphocyte count data (n = 23); (2) participants who were pregnant (n = 2); (3) participants without death data (n = 7); (4) participants who had received dialysis in the previous 12 months (n = 87); and (5) participants whose urinary albumin-to-creatinine ratio (ACR) was blank or less than 30 mg/g (n = 1097). Subsequently, 2,144 participants were enrolled, including 1,955 people with stage-2 CKD, 164 people with stage-3 CKD and 25 people with stage-4 or −5 CKD.
2.2. Measurement of albumin and lymphocyte count
The complete blood count (CBC) is a commonly used laboratory test to assess the influence of dietary intake and other factors on overall blood nutrient levels and immune competence. The methodology used to obtain CBC parameters is based on the Beckman Coulter counting and grading approach [Citation19]. Serum albumin levels are regularly used as an indicator of nutritional status and are determined using the bromocresol violet (BCP) method in the NHANES database. In this study, 5× lymphocyte count (10^9/L) + serum albumin (g/L) was used to calculate the PNI [Citation11].
2.3. Clinical and experimental data
The estimated glomerular filtration rate (eGFR) was calculated using the CKD-EPI equation [Citation20]. Smoking status was categorized as ‘never smoker’ (defined as having smoked fewer than 100 cigarettes in a lifetime) and ‘smoker’ (defined as having smoked more than 100 cigarettes in a lifetime). Alcohol consumption status was categorized as ‘nondrinkers’ (defined as having consumed fewer than 12 drinks of any type of alcoholic beverage in a year) and ‘drinkers’ (defined as having consumed more than 12 drinks of any type of alcoholic beverage in a year). Age groups were stratified into the following categories: young (<45 years), middle-aged (≥45 years and <60 years) and elderly (≥60 years). Body mass index (BMI) was calculated as weight in kilograms divided by height in meters squared and classified as normal (BMI < 25 kg/m2), overweight (25 ≤ BMI ≤ 30 kg/m2) and obese (BMI > 30 kg/m2). The ratio of family income to poverty (PIR) was classified as low (<1), medium (≥1 and <3), and high (≥3). Clinical information, including history of hemodialysis, heart failure, coronary heart disease, angina, myocardial infarction, stroke, emphysema, liver disease, gout, and cancer, was reported by a physician or other health professional.
2.4. Statistical analysis
Measured variables were expressed as the mean (standard deviation) or median (quartiles), count variables were expressed as frequencies (percentages), and the Kolmogorov–Smirnov test was used to assess the normality of variables. The t test or variance test was used for differences between groups for normal measures, the Mann–Whitney U test or Kruskal–Wallis H test was used for comparisons between groups for skewed measures, and the chi-squared test or Fisher exact test was used for count data. Analyses were performed with the PNI as a continuous variable and in quartiles to reduce the potential effect of its distribution on the results. The effects of baseline PNI categories on all-cause death were assessed using Kaplan–Meier curves (log-rank test). Hazard ratios with 95% confidence intervals (CIs) were estimated using univariable and multivariable Cox proportional hazards models. Possible nonlinear effects were modeled using restricted cubic spline models. The ROC curve was used to determine the critical value of PNI and to assess its predictive value for all-cause mortality. A 2-tailed p < 0.05 was considered indicative of statistical significance in all analyses. Data were analyzed using the statistical packages R (The R Foundation; http://www.r-project; version 4.0.2) and Empower (R) (www.empowerstats.com; X&Y Solutions Inc.).
3. Results
3.1. Baseline characteristics of participants
The mean age of the participants was 72.49 (standard deviation (SD) 9.80) years; 47.57% were male. The median duration of follow-up was 58 months (range 0–132 months). At the time of the census on 31 December 2015, 649 participants were identified as deceased (30.27%).
Compared to the survival group, the mortality group had a higher age, white blood cell count (WBC), alkaline phosphatase (ALP), gamma glutamyl transferase (GGT), total bilirubin (TBIL), blood urea nitrogen (BUN), creatinine (CREA), uric acid (UA), potassium (K), lactate dehydrogenase (LDH), C-reactive protein (CRP), and osmolality and a lower body mass index (BMI), urinary albumin-to-creatinine ratio (ACR), body mass index (BMI), absolute lymphocyte count (L), hemoglobin (HGB), hematocrit (HCT), albumin (ALB), alanine aminotransferase (ALT), cholesterol (CH), chloride (CL), total calcium (Ca), prognostic nutrition index (PNI), and estimated glomerular filtration rate (eGFR). They also had a higher prevalence of cardiovascular disease, stroke, emphysema, cancer and gout (). shows the baseline characteristics of participants in different PNI subgroups. Compared with the low PNI group, the high PNI group had higher WBC, L, HGB, HCT, PLT, TP, ALB, ALT, AST, TG, CH, Ca, Fe and eGFR and lower age, ALP, BUN, CREA, GLU, K, CL, LDH, CRP, osmolality and ACR.
Table 1. Baseline characteristics of participants who were Still alive vs. those who were deceased by December 31, 2015.
Table 2. Baseline characteristics of participants according to the PNI group.
3.2. Relationship between the PNI and mortality in patients with renal failure
Kaplan–Meier analysis revealed statistically significant differences in survival between the four PNI groups (p < 0.001, ). Subsequent unadjusted Cox proportional hazards regression models showed that a one-fold increase in the PNI was associated with a 4% reduction in all-cause mortality (HR 0.96; 95% CI 0.94, 0.97). This association remained robust and independent of potential confounders after adjustment (adjusted HR 0.98; 95% CI 0.97, 0.99). As a sensitivity analysis, the PNI was also treated as a categorical variable (quartile). The HRs showed an increasing trend from quartile 4 to quartile 1 in both the unadjusted and adjusted Cox models for all-cause mortality (P for trend < 0.001; ). HRs tended to increase from quartile 4 to quartile 1 of albumin or absolute lymphocyte count in both unadjusted and adjusted all-cause mortality Cox models (P for trend < 0.05; Supplementary Tables 1, 2). The PNI cutoff value with the best predictive power for all-cause mortality throughout follow-up was <49.0 (area under the curve [AUC] = 0.617, sensitivity 52.54%, specificity 100%, p < 0.001) in patients with CKD.
Figure 1. Kaplan–meier survival estimates for the PNI groups.
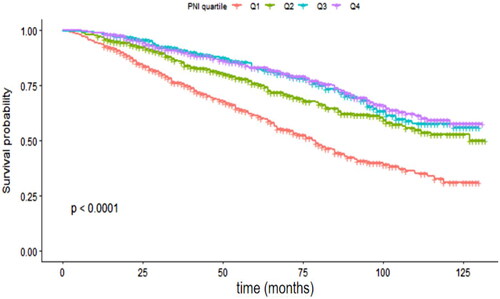
Table 3. Relationship between prognostic nutritional index and all-cause mortality in different models.
The fully adjusted model was adjusted for sex, age group, race, smoking, education, marital status, body mass index group, ratio of family income to poverty, white blood cell count, hemoglobin concentration, hematocrit, platelet count, total protein, alanine aminotransferase, aspartate aminotransferase, alkaline phosphatase, gamma glutamyl transferase, total bilirubin, blood urea nitrogen, creatinine, uric acid, glucose, triglycerides, cholesterol, potassium, chloride, total calcium, phosphorus, iron, lactate dehydrogenase, c-reactive protein group, osmolality, urinary albumin-to-creatinine ratio, diabetes mellitus, gout, heart failure, coronary heart disease, angina, myocardial infarction, stroke, emphysema, and cancer.
3.3. Analysis of the nonlinear relationship
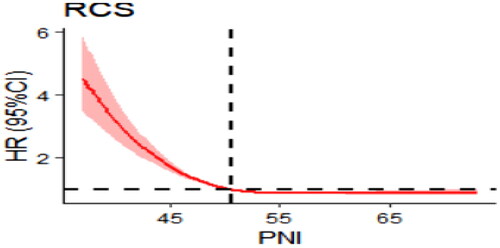
To account for nonlinear associations, we used restricted cubic spline analysis. After adjustment for confounders (the adjustment scheme was the same as in the fully adjusted model in ). We observed an ‘L-shaped’ decrease in the risk of all-cause death in patients with CKD with an increasing PNI. In addition, a clear threshold effect was observed, with the risk of death in patients with renal failure not decreasing with increasing PNI when the PNI was higher than 50.5 ().
Figure 2. Restricted cubic spline for the association between the PNI and all-cause mortality.
4. Discussion
The aim of this study was to evaluate the association between the PNI and all-cause mortality in patients with renal failure. Using data from participants in the National Health and Nutrition Examination Survey (NHANES) with a median follow-up of 58 months, it was found that a low PNI was associated with a higher all-cause mortality. This negative association remained after adjustment for potential confounding variables.
The PNI is a systemic immunonutrition index based on peripheral lymphocyte counts and serum albumin levels [Citation21], which provides a reliable and comprehensive assessment of the nutritional and inflammatory status of patients [Citation22–23]. In addition, the PNI has been shown to be a prognostic biomarker for all-cause mortality in patients with decompensated liver cirrhosis [Citation24], type-2 diabetes [Citation25] and various cancers [Citation26–29]. The PNI is also a predictor of the progression of diabetic nephropathy, and PNI is inversely associated with the incidence of end-stage nephropathy [Citation30].
In this study, a lower PNI was associated with an increased risk of all-cause mortality in patients with renal failure. The optimal PNI threshold for predicting 7-year mortality in patients with chronic kidney failure is <49, which is higher than the PNI value in elderly patients with stage 3–4 CKD [Citation16] because the nutritional status and immune function of the body decline with increasing age and progression of CKD. Malnutrition leads to a decrease in the lymphocyte count because lymphocyte synthesis requires proteins to provide raw materials, and when malnutrition occurs, lymphocyte synthesis decreases; at the same time, malnutrition tends to lead to infections in the body, which can lead to excessive depletion of lymphocytes. The study found that patients in the lowest quartile of lymphocyte count had a 21% higher risk of mortality than those in the highest quartile, as indicated in Supplementary Table 2. Causes of malnutrition in patients with CKD include decreased appetite and food intake, while patients with renal failure often experience symptoms such as vomiting and diarrhea, which interfere with nutrient absorption. Clinicians should monitor PNI levels to effectively assess the nutritional status of patients with CKD. Meanwhile, dietary nutrition therapy (DNT) (i.e. regulation of protein intake, adequate caloric intake, control of sodium and potassium intake, and reduction of phosphorus intake) is actively used to slow the process of renal failure and thus improve the prognosis of patients [Citation31].
Overall survival was significantly lower in those with a low PNI (<47.5) compared to those with a high PNI (≥47.5), similar to the findings of Shinji Itoh et al. [Citation32] in pancreatic ductal adenocarcinoma. Similar results have been reported in patients undergoing hemodialysis, where patients showed a decreasing trend in albumin levels 3 years before death [Citation33]. This has been attributed to renal failure possibly causing liver dysfunction leading to a reduction in albumin production. As summarized in Supplementary Table 1, patients in albumin Q1 had a 94% increase in the risk of death compared to patients in Q4. Therefore, monitoring and increasing albumin may reduce the risk of mortality in patients with renal failure [Citation34]. Lymphocytes are the immune cells that reflect an individual’s immune status, and lymphocyte deficiency can lead to an inadequate immune response and advanced disease progression [Citation35]. We found that a lower lymphocyte count is an indicator of impending death in patients with renal failure, in agreement with previous literature [Citation36]. One of the most controversial aspects of the PNI (and a factor hindering its application in the clinic) has been the establishment of a consensus cutoff. We found an L-shaped association between the PNI and all-cause mortality in patients with renal failure using restricted cubic splines with a critical value of 50.5, which is consistent with the literature [Citation37], indicating a saturation benefit of the negative correlation between the PNI and all-cause mortality.
Our study has several advantages. First, NHANES offers distinct advantages as a data source beyond its sampling quality and methodological rigor. Second, the study period was 14 years with a median follow-up of 5 years, which better reflects the mortality risk of patients with kidney failure. Finally, we made appropriate adjustments for potential confounders (including socioeconomic status, education, race, comorbidity, and laboratory parameters), which allowed us to better assess the independent association between the PNI and all-cause mortality in renal failure patients.
Despite the strengths of this study, some limitations must be acknowledged. First, not all selected participants may have been able or willing to engage in the NHANES survey, giving rise to potential systematic differences between the final participants and the overall population. Second, the questionnaire data within NHANES rely on the respondents’ memory, which could introduce recall bias. In addition, the data in the NHANES database may be somewhat outdated, as individuals’ health status may have changed over time.
5. Conclusion
The PNI is a protective factor in patients with CKD, with an L-shaped decrease in all-cause mortality as the PNI increases, reaching a critical value of 50.5. The PNI can be used as an important indicator to predict disease prognosis in patients with CKD. Clinicians should pay particular attention to patients with a low PNI in their medical care and take steps to correct low protein and/or lymphocyte levels promptly to improve patient survival.
Author contributions
J.-H.Y. and M.-G.Y. conceived the study and revised the paper. Y.C. analyzed the data. J.-H.Y. conceived and designed the experiments and wrote the paper. All authors have read and agreed to the published version of the manuscript.
| Abbreviations | ||
| AUC | = | Area under the curve |
| AECOPD | = | Acute exacerbation of chronic obstructive pulmonary disease |
| ACR | = | Urinary albumin-to-creatinine ratio |
| BMI | = | Body mass index |
| CRP | = | C-reactive protein |
| CI | = | Confidence interval |
| CBC | = | Complete blood count |
| CHD | = | Coronary heart disease |
| CKD | = | Chronic kidney disease |
| eGFR | = | Estimated glomerular filtration rate |
| HR | = | Hazard ratio |
| NHANES | = | National Health and Nutrition Examination Survey |
| NDI | = | National death index |
| PNI | = | Prognostic nutritional index |
| PIR | = | Ratio of family income to poverty |
| ROC | = | curve Receiver-operating characteristic curve |
| WC | = | Waist circumference |
Supplemental Material
Download PDF (105.4 KB)Disclosure statement
No potential conflict of interest was reported by the author(s).
Additional information
Funding
References
- Kassebaum NJ, Arora M, Barber RM, et al. Global, regional, and national disability-adjusted life-years (DALYs) for 315 diseases and injuries and healthy life expectancy (HALE), 1990–2015: a systematic analysis for the global burden of disease study 2015. Lancet. 2016;388(10053):1–8. doi:10.1016/S0140-6736(16)31460-X.
- Sadaghianloo N, Contenti J, Dufies M, et al. Co-culture of human fibroblasts, smooth muscle and endothelial cells promotes osteopontin induction in hypoxia. J Cell Mol Med. 2020;24(5):2931–2941. doi:10.1111/jcmm.14905.
- Harari-Steinberg O, Metsuyanim S, Omer D, et al. Identification of human nephron progenitors capable of generation of kidney structures and functional repair of chronic renal disease. EMBO Mol Med. 2013;5(10):1556–1568. doi:10.1002/emmm.201201584.
- Wang S, Tian X, Li Y, et al. Intracellular reactive oxygen species mediate the therapeutic effect of induced pluripotent stem cells for acute kidney injury. Oxid Med Cell Longev. 2020;2020:1609638. doi:10.1155/2020/1609638.
- Collaboration, G.B.D.C.K.D. Global, regional, and national burden of chronic kidney disease, 1990-2017: a systematic analysis for the global burden of disease study 2017. Lancet. 2020;395:709–733. doi:10.1016/S0140-6736(20)30045-3.
- Thongprayoon C, Cheungpasitporn W, Radhakrishnan Y, et al. Impact of hypoalbuminemia on mortality in critically ill patients requiring continuous renal replacement therapy. J Crit Care. 2022;68:72–75. doi:10.1016/j.jcrc.2021.12.008.
- Huang N, Li H, Fan L, et al. Serum phosphorus and albumin in patients undergoing peritoneal dialysis: interaction and association with mortality. Front Med (Lausanne). 2021;8:760394. doi:10.3389/fmed.2021.760394.
- Hu Y, Long H, Cao Y, et al. Prognostic value of lymphocyte count for in-hospital mortality in patients with severe AECOPD. BMC Pulm Med. 2022;22(1):376. doi:10.1186/s12890-022-02137-1.
- Wang S, Sheng Y, Tu J, et al. Association between peripheral lymphocyte count and the mortality risk of COVID-19 inpatients. BMC Pulm Med. 2021;21(1):55. doi:10.1186/s12890-021-01422-9.
- Wang N, Xi W, Lu S, et al. A novel Inflammatory-Nutritional prognostic scoring system for stage III gastric cancer patients with radical gastrectomy followed by adjuvant chemotherapy. Front Oncol. 2021;11:650562. doi:10.3389/fonc.2021.650562.
- Onodera T, Goseki N, Kosaki G. Prognostic nutritional index in gastrointestinal surgery of malnourished cancer patients. Nihon Geka Gakkai Zasshi. 1984;85:1001–1005.
- Zhang B, Zhu Q, Lu Z. Prognostic nutrition index predicts outcomes in critically ill stroke patients: a database-based cohort study. Eur Heart J. 2021;42(Supplement_1):ehab724-2054. doi:10.1093/eurheartj/ehab724.2054.
- Hong J, Huang QQ, Liu WY, et al. Three nutritional indices are effective predictors of mortality in patients with type 2 diabetes and foot ulcers. Front Nutr. 2022;9:851274. doi:10.3389/fnut.2022.851274.
- Ünver Ulusoy T, Hekimoğlu CH, Kayhan S, et al. Prognostic nutritional index: is it associated with the prognosis of crimean Congo hemorrhagic fever. J Med Virol. 2022;94(10):4910–4917. doi:10.1002/jmv.27947.
- Chen MY, Wen JX, Lu MT, et al. Association between prognostic nutritional index and prognosis in patients with heart failure: a meta-analysis. Front Cardiovasc Med. 2022;9:9, 918566. doi:10.3389/fcvm.2022.918566.
- Barutcu AD, Tugcu M, Asicioglu E, et al. Prognostic nutritional index is a predictor of mortality in elderly patients with chronic kidney disease. Int Urol Nephrol. 2022;54(5):1155–1162. doi:10.1007/s11255-021-03002-6.
- NHANES-National Health and Nutrition Examination Survey Homepage. Centers for disease control and prevention. https://www.cdc.gov/nchs/nhanes/index.htm.
- Marinozzi MC, Roumenina LT, Chauvet S, et al. Anti-Factor B and anti-C3b autoantibodies in C3 glomerulopathy and Ig-Associated membranoproliferative GN. J Am Soc Nephrol. 2017;28(5):1603–1613. doi:10.1681/ASN.2016030343.
- Hsieh MM, Everhart JE, Byrd-Holt DD, et al. Prevalence of neutropenia in the U.S. population: age, sex, smoking status, and ethnic differences. Ann Intern Med. 2007;146(7):486–492. doi:10.7326/0003-4819-146-7-200704030-00004.
- Levey AS, Stevens LA, Schmid CH, et al. A new equation to estimate glomerular filtration rate. Ann Intern Med. 2009;150(9):604–612. doi:10.7326/0003-4819-150-9-200905050-00006.
- Dai Y, Liu M, Lei L, et al. Prognostic significance of preoperative prognostic nutritional index in ovarian cancer: a systematic review and meta-analysis. Medicine (Baltimore). 2020;99(38):e21840. doi:10.1097/MD.0000000000021840.
- Li J, Xu R, Hu DM, et al. Prognostic nutritional index predicts outcomes of patients after gastrectomy for cancer: a systematic review and meta-analysis of nonrandomized studies. Nutr Cancer. 2019;71(4):557–568. doi:10.1080/01635581.2019.1577986.
- Shimizu T, Miyake M, Hori S, et al. Clinical impact of sarcopenia and inflammatory/nutritional markers in patients with unresectable metastatic urothelial carcinoma treated with pembrolizumab. Diagnostics (Basel). 2020;10(5):310. doi:10.3390/diagnostics10050310.
- Xie Y, He C, Wang W. Prognostic nutritional index: a potential biomarker for predicting the prognosis of decompensated liver cirrhosis. Front Nutr. 2023;9:1092059. doi:10.3389/fnut.2022.1092059.
- Zhang J, Chen Y, Zou L, et al. Prognostic nutritional index as a risk factor for diabetic kidney disease and mortality in patients with type 2 diabetes mellitus. Acta Diabetol. 2023;60(2):235–245. doi:10.1007/s00592-022-01985-x.
- Fu M, Yu L, Yang L, et al. Predictive value of the preoperative prognostic nutritional index for postoperative progression in patients with pancreatic neuroendocrine neoplasms. Front Nutr. 2022;9:945833. doi:10.3389/fnut.2022.945833.
- Zheng Z, Zhu H, Cai H. Preoperative prognostic nutritional index predict survival in patients with resectable esophageal squamous cell carcinoma. Front Nutr. 2022;9:824839. doi:10.3389/fnut.2022.824839.
- Meng C, Gan L, Li K, et al. Prognostic nutritional index before surgical treatment may serve as a prognostic biomarker for patients with upper tract urothelial carcinoma: a systematic review and meta-analysis. Front Nutr. 2022;9:972034. doi:10.3389/fnut.2022.972034.
- Shi Y, Zhang Y, Niu Y, et al. Prognostic role of the prognostic nutritional index (PNI) in patients with head and neck neoplasms undergoing radiotherapy: a meta-analysis. PloS One. 2021;16(9):e0257425. doi:10.1371/journal.pone.0257425.
- Zhang J, Xiao X, Wu Y, et al. Prognostic nutritional index as a predictor of diabetic nephropathy progression. Nutrients. 2022;14(17):3634. doi:10.3390/nu14173634.
- Cupisti A, Brunori G, Di Iorio BR, et al. Nutritional treatment of advanced CKD: twenty consensus statements. J Nephrol. 2018;31(4):457–473. doi:10.1007/s40620-018-0497-z.
- Itoh S, Tsujita E, Fukuzawa K, et al. Prognostic significance of preoperative PNI and CA19-9 for pancreatic ductal adenocarcinoma: a multi-institutional retrospective study. Pancreatology. 2021;21(7):1356–1363. doi:10.1016/j.pan.2021.08.003.
- Suzuki Y, Harada M, Matsuzawa R, et al. Trajectory of serum albumin prior to death in patients receiving hemodialysis. J Ren Nutr. 2023;33(2):368–375. doi:10.1053/j.jrn.2022.07.007,doi:10.1053/j.jrn.2022.07.007.
- Kobuchi S, Kai M, Ito Y. Population pharmacokinetic Model-Based evaluation of intact oxaliplatin in rats with acute kidney injury. Cancers (Basel). 2021;13(24):6382. doi:10.3390/cancers13246382.
- Sato S, Sato M, Shinohara H. Significance of preoperative evaluation of skeletal muscle index and immune-nutritional status for patients with early-stage non-small cell lung cancer. Gen Thorac Cardiovasc Surg. 2023;71(6):354–362. doi:10.1007/s11748-022-01899-z,doi:10.1007/s11748-022-01899-z.
- Troya J, Bastard P, Casanova JL, et al. Low lymphocytes and IFN-Neutralizing autoantibodies as biomarkers of COVID-19 mortality. J Clin Immunol. 2022;42(4):738–741. doi:10.1007/s10875-022-01241-5.
- Fanetti G, Polesel J, Fratta E, et al. Prognostic nutritional index predicts toxicity in head and neck cancer patients treated with definitive radiotherapy in association with chemotherapy. Nutrients. 2021;13(4):1277. doi:10.3390/nu13041277.